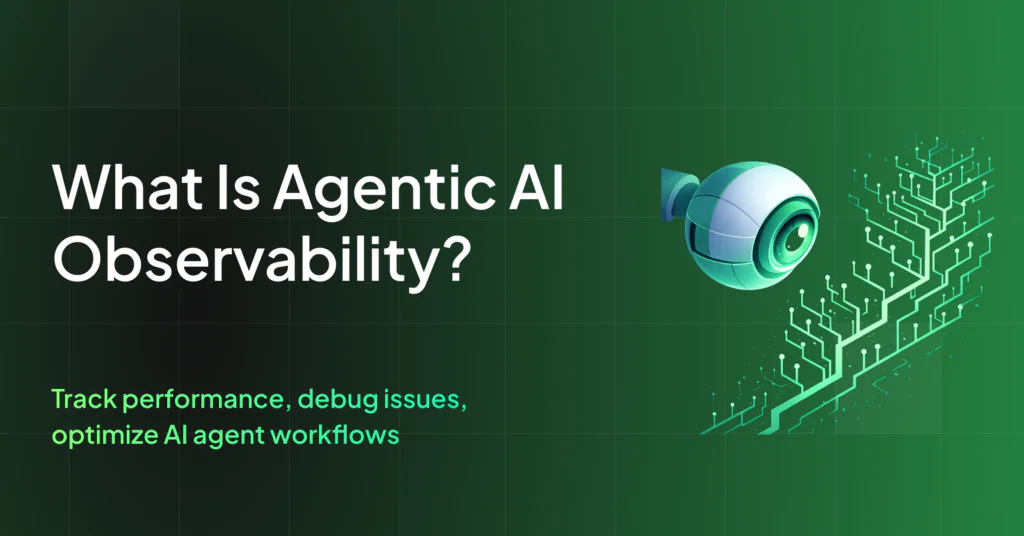
The Best AI Observability Tools in 2026: A Buyer’s Guide

A model that answers fluently is not the same as a model that answers correctly, and most teams do not find out which one they shipped until a customer complains. Traditional application performance monitoring (APM) tools confirm a system is running; they say nothing about whether the answer it gave was right.
This guide covers what artificial intelligence (AI) observability actually monitors, the criteria that separate a genuine AI observability platform from an APM tool that only surfaces large language model (LLM) telemetry, and how the best AI observability tools for 2026 compare on OpenTelemetry support, evaluation depth, and pricing model.
How to Choose AI Observability Tools
Before comparing individual platforms, four factors determine which category and vendor fit your team. Start with where AI telemetry needs to live, then decide how much evaluation depth production workflows require. Use the criteria below to compare switching cost, quality control, and pricing exposure:
- Category first: AI observability tools split into cross-stack platforms that added AI capabilities and evaluation-first tools built specifically for LLM applications, and the right choice depends on whether AI telemetry needs to correlate with existing infrastructure or run through a dedicated evaluation workflow.
- OpenTelemetry support decides switching cost: Platforms that emit and ingest standard gen_ai.* attributes export traces to any OpenTelemetry Protocol (OTLP)-compatible backend without re-instrumentation, while proprietary SDKs lock traces into a single vendor.
- Evaluation depth separates monitoring from quality control: Tracing shows where a request failed; evaluation determines whether the response met a quality or safety bar, and the strongest platforms link the two together.
- Pricing units are not comparable at face value: Span volume, data ingest, user count, and token usage all measure different things, so sticker prices need translation into an actual workload before they mean anything.
Matching a tool’s category and OpenTelemetry posture to your actual workload upfront avoids an expensive re-platforming decision later.
What AI Observability Actually Covers
AI observability is the practice of instrumenting and monitoring AI systems in production to gain visibility into their inputs, outputs, execution traces, retrieval steps and behavioral anomalies over time. That scope includes trust and cost measures for AI systems. Traditional observability answers whether the system is running. AI observability answers whether the system is producing correct outputs, which is a different question that static thresholds and error codes can’t resolve. Conventional software problems usually appear through errors, timeouts, or alerts, while AI systems can fail quietly when a model produces polished but incorrect output or drives up inference costs before teams notice.
OpenTelemetry (OTel) generative AI (GenAI) semantic conventions use a span as the basic unit of visibility and standardize span attributes such as gen_ai.request.model, so a typical agent trace tree includes a top-level invoke_agent span with child chat spans for each LLM call and execute_tool spans for each tool invocation. Spans for LLM calls, tool calls, retrievers, and agents combine into traces. Teams get the sequence they need to debug a workflow from outcome back to cause. Evaluation adds quality checks to tracing by measuring whether the output was acceptable, alongside real-time guardrails, cost tracking, and security scanning for prompt injection and personally identifiable information (PII) leakage.
What to Look for in an AI Observability Platform
The nondeterminism in generative and agentic AI applications makes reliability hard to measure, so evaluate candidates by architecture first. That nondeterminism creates a core reason teams need evaluation and observability platforms for AI systems. Before running a proof of concept, screen candidates against the capabilities that separate genuine AI observability from an APM tool with an added LLM telemetry view:
- OpenTelemetry-native support: The platform should emit and ingest standard gen_ai.* attributes so traces export to any OTLP-compatible backend without re-instrumentation.
- Tracing depth across agents: The platform needs to trace the full call graph across orchestrators, sub-agents, and tool calls, and manage context across multi-turn conversations.
- Online and offline evaluation: Evals should run on live traffic and against curated datasets, with results linked back to the traces that produced them.
- Real-time guardrails: Production AI systems need inline guardrails that block or correct unsafe responses before delivery.
- Cost and token tracking: Per-user, per-feature, and per-model attribution with budget alerting becomes essential once token costs spike without warning.
- Data ownership and pricing transparency: Customer-owned storage has moved from a niche feature into a buying criterion, and pricing should track the data sent rather than an open-ended bill.
Your role determines how heavily to weigh each criterion. Platform teams should prioritize OTel-native ingestion and data residency, while site reliability engineering (SRE) teams need clear incident context across traces, metrics, and logs. AI engineers should focus on evaluation depth and whether evaluation results link back to the traces that produced them.
The Best AI Observability Tools for 2026
The tools below split into two camps: cross-stack observability platforms that added AI capabilities, and evaluation-first tools built specifically for LLM applications. The right fit depends on whether you need AI observability correlated with your existing infrastructure telemetry or a dedicated evaluation workflow for a team shipping AI features. Buyers should also account for data ownership, evaluation depth, guardrail behavior, and pricing model before they compare feature checklists.
Coralogix AI Center closes that gap by consolidating monitoring, guardrails, evaluations, security posture management, and code agent intelligence into a single platform. Here’s how it stacks up against the six tools that engineering teams most often compare it to.
Coralogix AI Center
Coralogix AI Center is a platform for observing, guarding, and evaluating AI applications. It covers monitoring, guardrails, evaluations, AI security posture management, and code agent intelligence in a single product, rather than stitching together separate tools for each function.
Key features:
- Natively ingests standard OpenTelemetry GenAI semantic conventions. No Coralogix-specific SDK required.
- eBPF auto-instrumentation captures AI traffic from major LLM providers with no code changes.
- The AI Evaluation Engine uses small models to score every response for faithfulness, relevance, toxicity, and PII leakage as Coralogix generates the response
- Custom evaluators for domain-specific rules, such as a financial app prohibiting stock advice
- AI Guardrails intercept and block harmful outputs in real time before they reach users
- Code Agents Intelligence tracks token usage and cost per developer for Claude Code, Cursor, Codex CLI, and Copilot from a single dashboard
- Open-format storage in your own cloud bucket, so evaluation tooling gets full historical context without rehydration delays
Pros:
- The only tool on this list that unifies monitoring, guardrails, evaluation, security posture, and code agent spend into a single product. Competitors typically require two or three separate tools to cover the same ground.
- No-code, no-SDK instrumentation through OpenTelemetry and eBPF gets teams to first value faster than platforms that require manual span instrumentation
- Data lives in your own cloud bucket in an open format, so there’s no rehydration delay, and you keep full ownership of your historical evaluation data
- Code Agents Intelligence is a category most competitors don’t address at all: tracking per-developer token spend on tools like Claude Code, Cursor, and Copilot
Cons:
- Newer to the dedicated AI observability space than eval-first specialists like Arize or LangSmith, so some niche evaluation workflows are still maturing
- Teams deep in the LangChain environment may still want LangSmith’s framework-native tooling for prompt-level experimentation
Best for: Teams that want a single platform covering AI monitoring, evaluation, guardrails, security posture, and code agent cost tracking, rather than assembling separate tools for each.
Pricing: Logs cost $0.42 per GB. AI is billed separately at $1.50 per one million tokens, since AI tokens use a different billing mechanism than the ingestion units used for logs, metrics, and traces. That separation keeps AI costs predictable even as log volume grows, unlike platforms that fold LLM spend into the same metered unit as everything else.
How the alternatives compare
| Tool | OTel-native | Real-time guardrails | Evaluation depth | Data ownership | Pricing model |
| Coralogix AI Center | Yes | Yes | Inline evaluators (faithfulness, relevance, toxicity, PII) + custom | Customer-owned cloud bucket | $0.42/GB logs; $1.50 per 1M AI tokens |
| Datadog LLM Observability | Partial | Limited | Prompt/response quality metrics | Vendor-hosted | Per-host + ingest |
| Dynatrace | Partial | Limited | Davis AI correlation | Vendor-hosted | Consumption units |
| Arize AI | Yes | No | Online + offline evals, drift detection | Vendor-hosted (self-host available) | Usage-based |
| LangSmith | Partial | No | Traces, datasets, evaluation runs | Vendor-hosted | Seat + usage |
| Langfuse | Yes | No | Traces, evals, prompt management | Self-hosted or cloud | Free OSS / cloud tiers |
| Fiddler AI | Partial | Policy-level | Explainability, drift, LLM safety | Vendor or self-hosted | Enterprise |
Datadog LLM Observability
Datadog bolts AI monitoring onto its existing APM and infrastructure stack, so LLM traces appear alongside the services, hosts, and user sessions they affect.
Key features:
- LLM call tracing with prompt and response capture, plus automatic cost estimation across 800+ models
- Built-in offline and online evaluations with no separate eval fee
- Sensitive Data Scanner for PII and PHI redaction is bundled into the product
- Correlates agent behavior with backend services, infrastructure signals, and Real User Monitoring sessions
Pros:
- Single pane of glass if you’re already a Datadog shop for APM and infrastructure
- Deep root-cause tracing across the full stack, not just the model call
- No separate charge for running evaluations
Cons:
- Adds another line item on top of an already complex, multi-dimensional Datadog bill
- Requires buying into the broader Datadog stack. Coralogix AI Center works as a focused AI platform without that dependency.
- Cost estimation only works for providers on Datadog’s supported list
Best for: Teams already running Datadog for infrastructure and APM who want AI telemetry correlated with the rest of their environment.
Pricing: Free covers up to 40K LLM spans per month. Pro starts at $160 per month for 100K spans, with on-demand overages thereafter. Datadog appears to charge for this on top of whatever you’re already paying for APM, infrastructure, and logs, which are billed per host, per GB, and along several other dimensions. Teams widely report this as one of the hardest observability bills to forecast.
Dynatrace
Dynatrace leans on Davis, its causal AI engine, to correlate LLM performance signals with full-stack traces and infrastructure health.
Key features:
- Davis AI engine for automated root-cause analysis and anomaly detection, included in Full-Stack Monitoring at no extra charge
- Davis CoPilot, a separately metered generative-AI assistant for natural-language queries
- OneAgent auto-discovery instruments hosts and applications with minimal manual configuration
Pros:
- Davis has the longest head start of any competitor on causal AI, with development dating back to 2018
- No per-user fees. Unlimited seats are included.
- Strong fit for regulated industries needing platform-level compliance certifications like FedRAMP High, HIPAA, and PCI DSS
Cons:
- Consistently the most expensive option in head-to-head comparisons
- Consumption-based billing has real cost traps, including a 4 GiB minimum per host and 15-minute rounding that can inflate ephemeral workload costs by 2 to 4x
- Requires 1 to 3-year minimum commitments, a heavier procurement lift than Coralogix’s straightforward per-GB and per-token pricing
Best for: Large enterprises with complex, multi-cloud environments that already value Davis’s causal AI for infrastructure and are willing to pay a premium.
Pricing: Full-Stack Monitoring starts at $69 per month per 8 GB host, billed annually. The median enterprise annual contract, per third-party transaction data, runs around $183,000.
What people say: G2 reviewers rate it 4.5 to 5 out of 5, consistently citing Davis AI’s root-cause analysis as a strength, with pricing as the near-universal complaint even among satisfied customers.
Arize AI
Arize focuses on tracing, evaluation, and drift detection for LLM and agentic applications, with strong roots in traditional ML model monitoring.
Key features:
- Online and offline evaluations for LLM and agentic workflows
- Drift detection carried over from Arize’s ML monitoring heritage
- Phoenix, its open-source sibling project, for teams that want a self-hosted on-ramp
Pros:
- Drift and model-monitoring depth are stronger than most LLM-only competitors
- Open-source Phoenix option lowers the barrier to trying the approach before buying
- Known for RAG-specific evaluation tooling
Cons:
- Primarily an evaluation and quality layer. It doesn’t cover infrastructure correlation, security posture, or code agent spend the way Coralogix AI Center does.
- Enterprise pricing isn’t published, so budgeting requires a sales conversation
- Two overlapping products, Arize AI and Phoenix, can create confusion about which tier does what
Best for: Teams that already run traditional ML models alongside LLM features and want a single vendor to cover drift detection and LLM evaluation.
Pricing: Self-serve and free tiers are available for light usage. Production and enterprise pricing are quote-based.
LangSmith
LangSmith is LangChain’s own observability and evaluation product, tightly integrated with the LangChain and LangGraph ecosystem.
Key features:
- Tracing, prompt management, and dataset curation built around LangChain and LangGraph primitives
- Evaluation runs that plug directly into datasets built from production traces
- Native fit for teams already building on the LangChain framework
Pros:
- Lowest-friction option if your application is already built on LangChain or LangGraph
- Prompt versioning and dataset tooling are mature relative to newer entrants
- Backed by the team that maintains the underlying framework
Cons:
- Less natural fit for teams not using LangChain. The value proposition narrows outside that ecosystem.
- Framework lock-in is a real consideration if you might later migrate off LangChain
- No infrastructure, security posture, or code agent cost tracking. You’ll need to pair it with something like the Coralogix AI Center to get that coverage.
Best for: Teams already standardized on LangChain or LangGraph who want evaluation and tracing without adopting a framework-agnostic tool.
Pricing: Free developer tier with usage caps. Paid plans scale by trace volume, with enterprise pricing quoted directly.
Langfuse
Langfuse is a self-hostable tracing, evaluation, and prompt-management platform for LLM applications, with a strong open-source community following.
Key features:
- Self-hostable tracing, evaluations, and prompt management
- Analytics on top of trace data for cost and quality trends
- Active open-source community and frequent releases
Pros:
- Genuinely open-source with a real self-hosting path
- Lower long-term cost for teams with the ops capacity to run it themselves
- No vendor lock-in on where trace data lives
Cons:
- Self-hosting means your team owns uptime, scaling, and upgrades. Coralogix AI Center gives you the same open-format, own-cloud-bucket data ownership without the operational burden.
- Guardrail depth and enterprise support are lighter than commercial platforms
- No security posture management or code agent cost tracking
Best for: Teams with existing DevOps capacity who want full control over their LLM telemetry data and are comfortable operating the platform themselves.
Pricing: Free and self-hosted under an open-source license. A hosted cloud version is available with usage-based pricing tiers.
Fiddler AI
Fiddler delivers model monitoring, explainability, and LLM safety metrics aimed squarely at regulated environments.
Key features:
- Explainability tooling that traces model decisions back to contributing factors
- LLM safety metrics layered on top of traditional model monitoring
- Built for environments where model decisions need a documented audit trail
Pros:
- Explainability depth is a genuine differentiator versus observability-first competitors that treat models as black boxes
- Serves both traditional predictive ML and generative use cases under one governance umbrella
- Strong fit for financial services and healthcare compliance teams
Cons:
- Heavier weight and steeper setup than lightweight eval tools aimed at fast-moving engineering teams
- Doesn’t cover infrastructure monitoring, code agent spend, or OpenTelemetry-native ingestion the way Coralogix AI Center does
- Enterprise-only pricing model with no public self-serve tier
Best for: Regulated industries such as finance, healthcare, and insurance that need documented model explainability alongside monitoring.
Pricing: Enterprise, quote-based.
Datadog, Dynatrace, Arize, LangSmith, Langfuse, and Fiddler each solve one piece of the AI observability problem well: infrastructure correlation, causal AI, evaluation depth, framework integration, self-hosting, or compliance-grade explainability. Most teams end up paying for two or three of them to get full coverage.
Coralogix AI Center is built to be the one platform that covers monitoring, guardrails, evaluation, security posture, and code agent intelligence together, with open-format storage you control and AI billing that stays separate and predictable from log, metric, and trace costs. For teams that want to consolidate rather than stack point solutions, it’s the strongest starting point on this list.
Disclaimer: This comparison is based on publicly available information, including vendor documentation, pricing pages, and product materials, as of July 2026. Features, pricing, and capabilities are subject to change, and we encourage readers to verify current details directly with each vendor. Coralogix is not affiliated with [Competitor Name] and does not claim to represent their views. All trademarks, product names, and company names are the property of their respective owners.
Where AI Observability Is Headed Next
Agentic AI moves observability beyond after-the-fact debugging. As agents take more actions across tools and application programming interfaces (APIs), teams need observability to show what happened, why it happened, what it cost, and whether the result was acceptable enough to trust or audit. Real-time guardrails are now closer to the request path as evaluation models and policy checks move nearer to production traffic. Teams should track three criteria over the next two years:
- Agent-level standards: GenAI semantic conventions are expanding from LLM call tracing toward full agent graphs, and the OpenTelemetry request for comments (RFC) proposes a standards path for namespaces such as gen_ai.agent. and gen_ai.tool.. OTel-native architectures should reduce switching costs as the standard settles.
- Consolidation pressure: Teams also want fewer separate tools for infrastructure, AI traces, evaluations, guardrails, and cost governance.
- Explainability: By 2028, explainable AI is projected to drive LLM observability investments to 50 percent of GenAI deployments.
Together, these shifts favor tools that connect agent traces, inline policy checks, and cost attribution without locking teams into a proprietary trace format.
Picking the Right AI Observability Tool
The AI observability market divides along two lines: OTel-native tools versus proprietary SDKs, and cross-stack platforms that correlate AI telemetry with existing infrastructure versus evaluation-first tools for a dedicated AI engineering workflow. Teams shipping LLM features into production and wanting output quality scored inline should prioritize evaluation depth and real-time guardrail blocking. Teams already running a broad observability stack should weigh how well AI traces correlate with the APM, infrastructure, and real user monitoring data they depend on during an incident. Either way, workload and data residency requirements deserve modeling before comparing prices, because pricing units are not directly comparable on a sticker figure alone.
A free 14-day trial lets you run Coralogix’s Evaluation Engine and AI Guardrails against your own production traffic instead of a sales demo. You’ll see faithfulness, toxicity, and PII scoring on real requests within the first session.
Frequently Asked Questions About AI Observability Tools
Does AI observability replace application performance monitoring?
AI observability adds a layer on top of APM rather than replacing it. APM confirms a system is running and responding within acceptable latency, while AI observability adds evaluation, guardrails, and cost tracking for the model layer itself. Most teams shipping LLM features keep both and correlate AI traces with the APM data they already use during incidents.
Why is OpenTelemetry support important for AI observability?
OpenTelemetry support helps teams emit and ingest standard gen_ai.* attributes without rebuilding instrumentation for each backend. OTel-native traces can show LLM calls, tool calls, retrievers, and agents as part of the same workflow, which helps teams debug from outcome back to cause. As GenAI semantic conventions expand toward agent graphs, OTel-native architectures should reduce switching costs.
How should teams evaluate guardrails?
Teams should evaluate whether guardrails act in line before response delivery. Production AI systems need guardrails that can block or correct unsafe prompts and responses in real time when rules detect prompt injection or PII leakage. Evaluation depth determines whether guardrails can score responses against an organization’s quality and safety requirements.
How does pricing differ across AI observability tools?
AI observability pricing can depend on span volume, data ingest, user count, self-hosting requirements, or token usage. These models measure fundamentally different things, so teams should model their own usage and retention needs before comparing sticker prices. Coralogix prices logs at $0.42 per GB and bills AI separately at $1.50 per 1 million tokens on a monthly AI meter, distinct from the ingestion units used for logs, metrics, and traces.