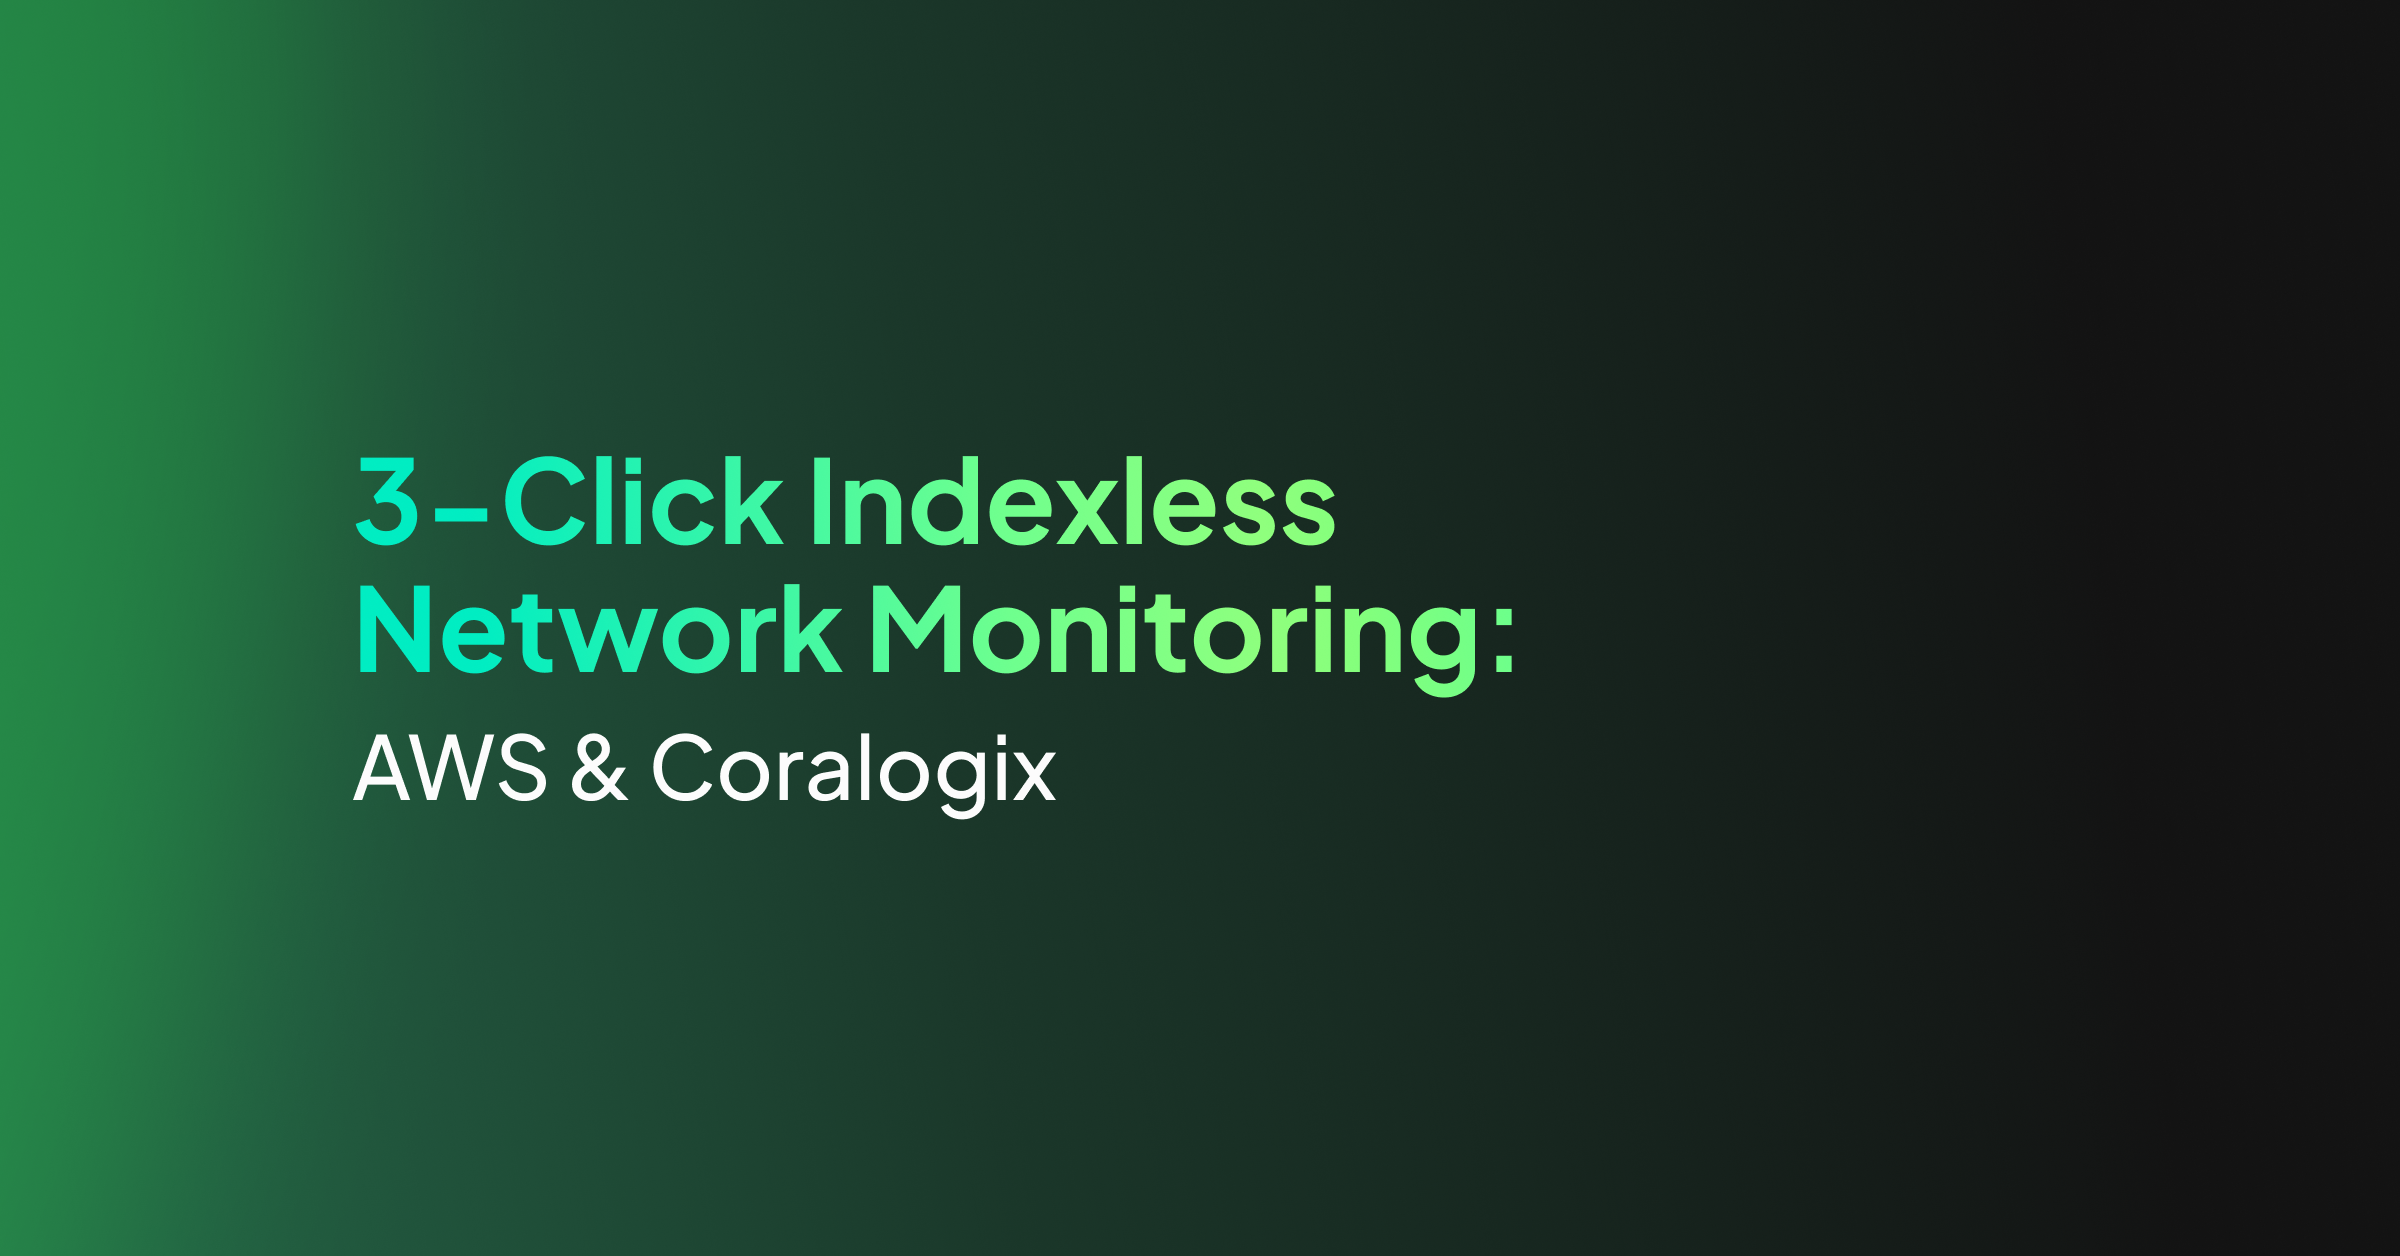
3-Click Indexless Network Monitoring: AWS & Coralogix

Network infrastructure is the hidden glue between servers. In AWS, it takes skill, knowledge and experience to build a network that can be monitored, will perform and is secure. A key source of information to determine the health of a network is the logs, but network logs suffer from a serious problem.
They’re noisy, and they’re often difficult to parse, but by leveraging indexless observability, Coralogix customers can drive insights from data that would previously have been untouchable. Let’s find out how Coralogix customers can ingest multiple AWS services, and with only a few clicks, deploy dozens of alarms, dashboards and more.
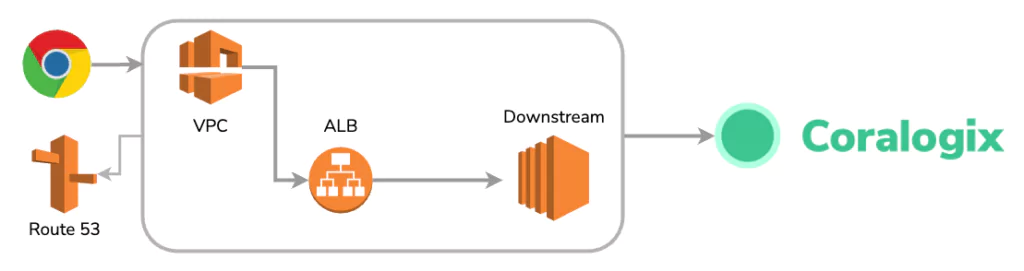
We began by building a typical application stack, with some key components:
- An AWS Virtual Private Cloud (VPC) to mimic typical production environments
- An Application Load Balancer (ALB) to handle Level 7 Traffic Routing
- Route53 Records to add DNS resolution into this stack.
Integrating logs from all of this infrastructure into Coralogix
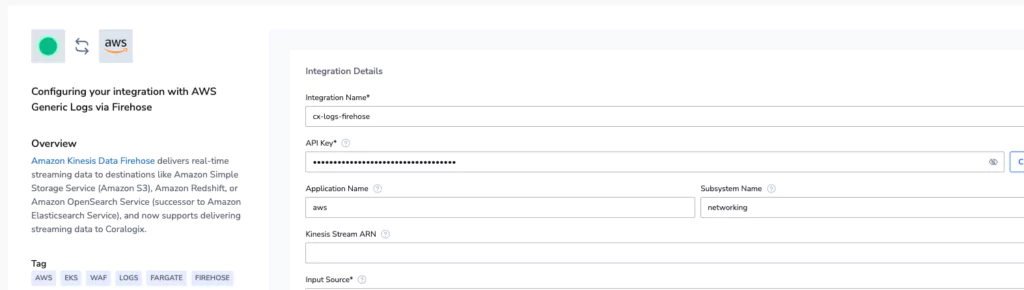
Coralogix has a number of different options for connecting logs, metrics & traces from AWS into the platform. For this stack, one integration approach was the simplest. VPC, Route53 and ALB all support pushing logs to AWS Firehose. Coralogix has a native integration with AWS Firehose.
Deploying the appropriate collector was done in a few clicks. The Coralogix Integration UI enables users to easily push their telemetry into the Coralogix platform.
Parsed logs, with alerts, metrics & dashboards in 3 clicks
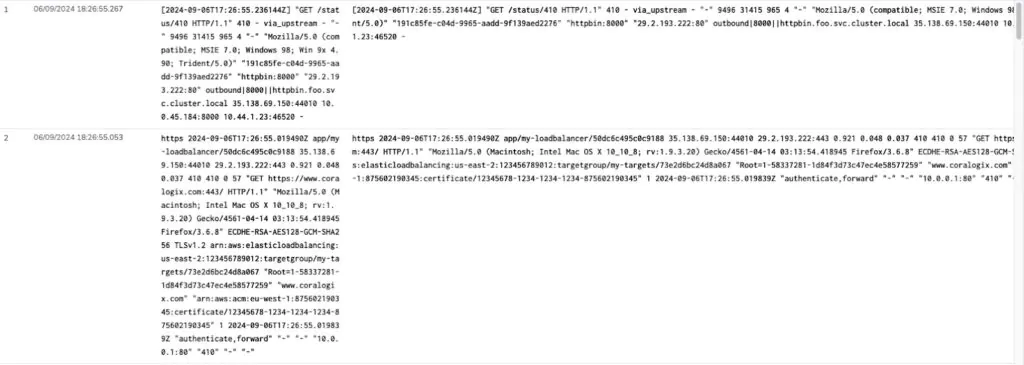
At this point, when we open up the Logs explore screen, we can see unparsed logs are arriving. This is a great start, but most network logs do not come in JSON form, they come in space separated formats, which makes it difficult to query the individual values.
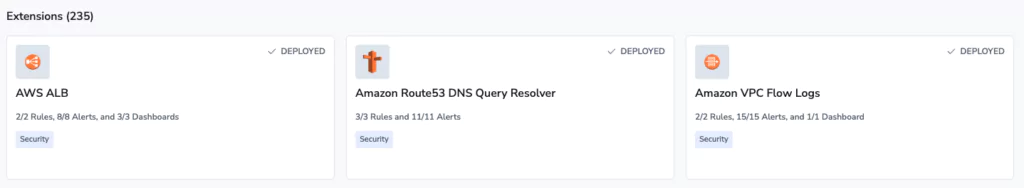
Parsing this data would be a complex task, if it wasn’t for Coralogix extensions. Route53, AWS ALB & VPC Flow Logs all have pre built extensions. This turned the job of writing regular expressions, which while intuitive can take some time, into a few simple clicks.
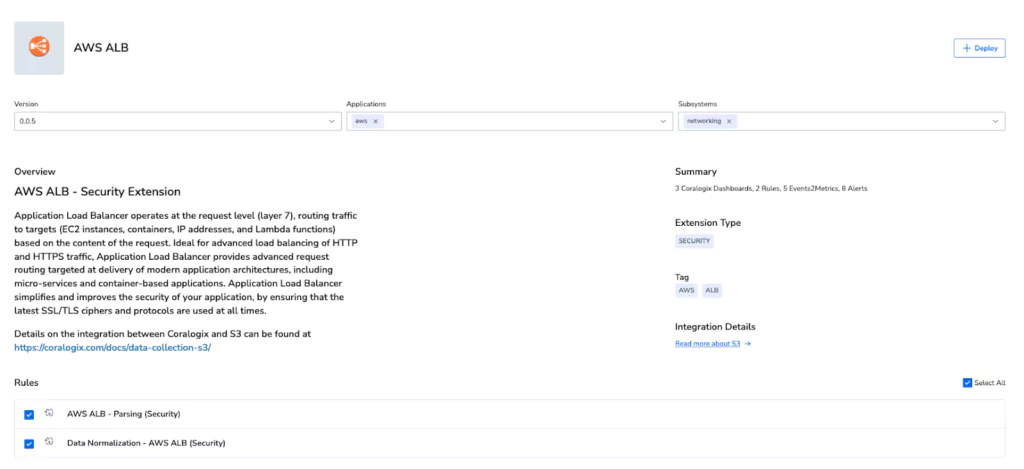
After 3 clicks, all of our AWS logs were parsed, but that’s not it, a total of:
- 7 Parsing Rules were deployed to turn the unstructured data into accessible JSON
- 34 Alerts were defined, covering a wide variety of security and observability use cases
- 4 Dashboards were deployed into the account for ALB & VPC.
- 6 metrics were generated from the ALB & VPC Logs.
All of this, by simply clicking the deploy button on 3 different extensions:
Taking the index out of the equation
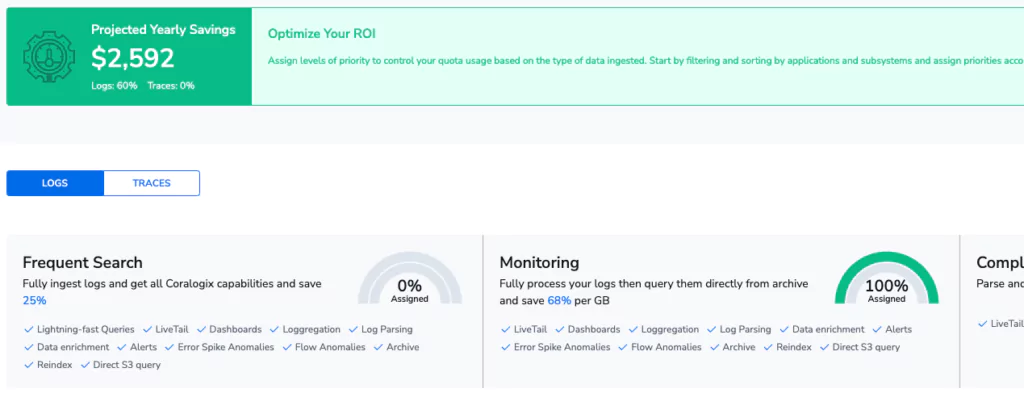
Indexless observability means that no telemetry data is going to be stored in an SSD, or held in a traditional index. Traditional indexing is very expensive, and removing it from the equation not only drives down the cost, but gives access to new methods of telemetry optimization that can actually increase performance over time without sacrificing any insight or granularity.
Removing the index, in this case, means setting the TCO Optimizer to 100% Monitoring. This means all data can be converted to metrics, trigger alarms, visualized in dashboards, train machine learning models or be directly queried at will, with no cost implications.
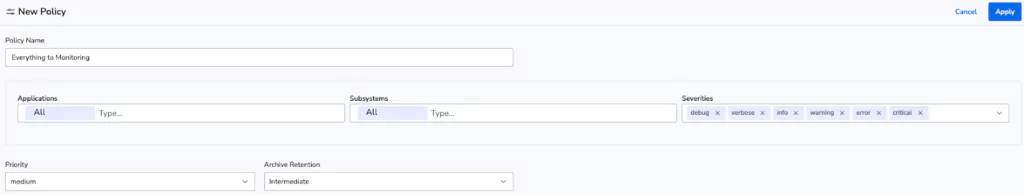
This TCO Policy will move every single log into the monitoring level. The Coralogix TCO Optimizer makes it easy to see how much this will save. By simply doing this, my data now takes up 68% less of my quota, effectively allowing me to send 3.5x more data.
Inspecting our new account
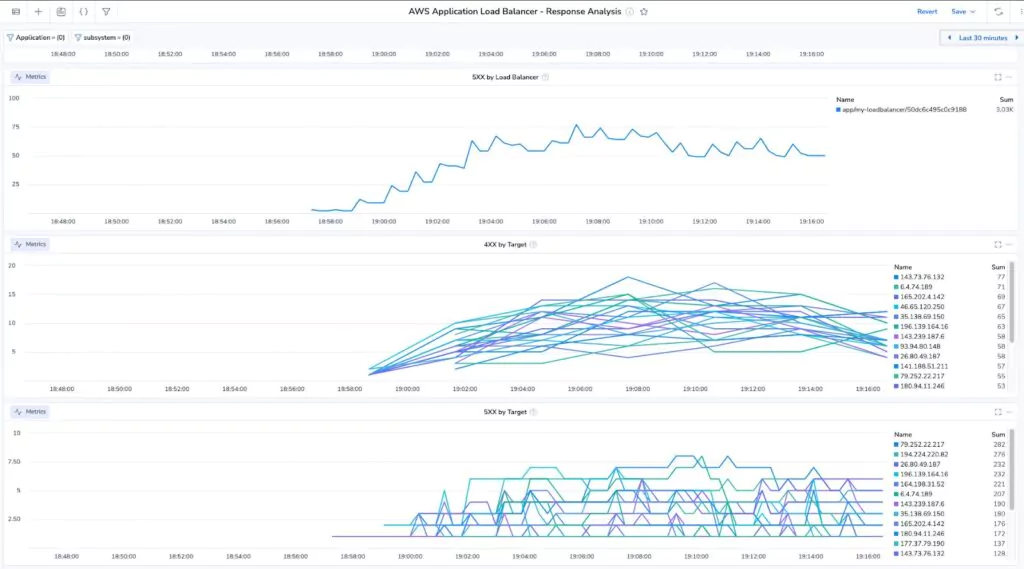
Our indexless mission is going well, and we now have dashboards and alarms that we can explore. While there are too many to list here, a few great examples are the ALB response analysis dashboard, which provides deep insights into error codes coming from both the load balancer and its downstream EC2 targets.
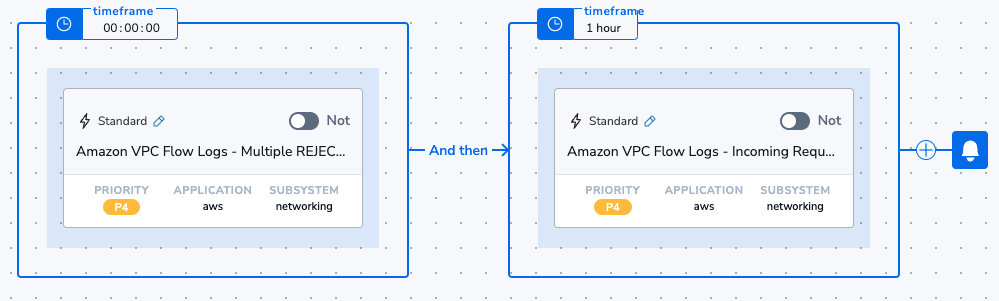
Alerts are also extremely well populated, with many complex security use cases covered effectively. For example, this flow alert detects when a given IP address is blocked at the VPC level several times, before subsequently being allowed through, which is a possible indication of a brute force attack.
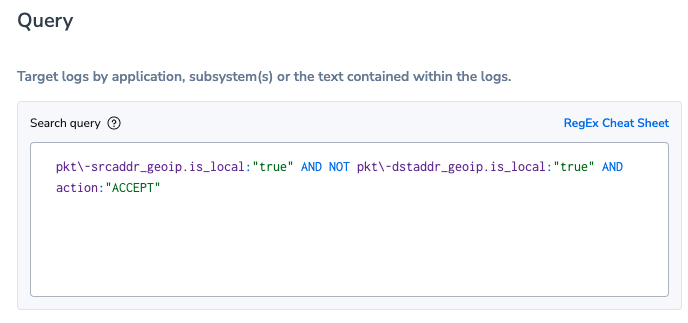
Or this alert, that will use the New Value functionality of Coralogix to automatically detect when a request that originated from a local server is subsequently sending data out to a country that has not been seen this month:
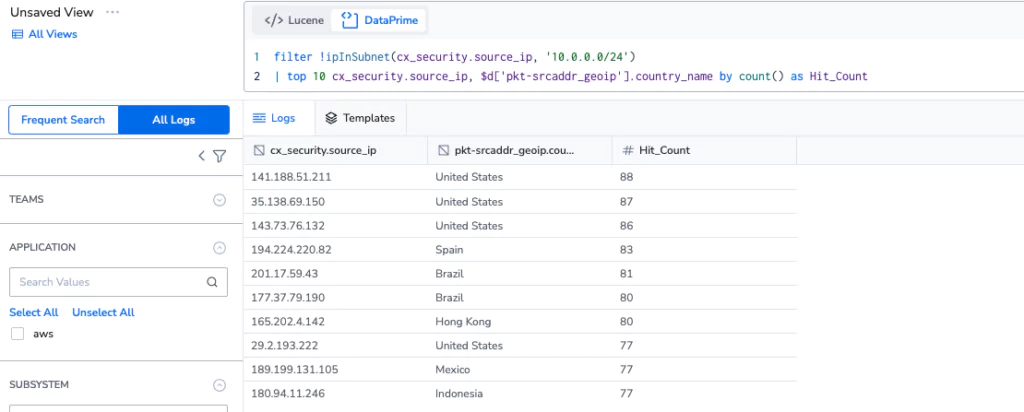
There are dozens of alarms, dashboards & parsing rules to explore, and all of this is backed by the ability for Coralogix to directly query the archive, as needed. For example, this query will pull the public IP addresses in the logs and return the top 10 IP addresses and their associated countries by the number of times they’ve appeared in the logs, all directly from the archive on data that has never been indexed, and was ingested at a 68% discount.
From 0 to observed in a few clicks
Coralogix makes it simple to observe your data, but most importantly, it does it without any mandatory relationship to the index, allowing customers to ingest far more data & only index the information that they really need. All of these dashboards are driven by metrics, and all of these alarms get complete access to the logs, as if they were indexed. This radically new approach to processing observability data replaces sampling with surety and trade-offs with limitless observability that is fit for even the most complex tasks.