A Practical Guide to Logstash: Input Plugins

In a previous post, we went through a few input plugins like the file input plugin, the TCP/UDP input plugins, etc for collecting data using Logstash. In this post, we will see a few more useful input plugins like the HTTP, HTTP poller, dead letter queue, twitter input plugins, and see how these input plugins work.
Setup
First, let’s clone the repository
sudo git clone https://github.com/2arunpmohan/logstash-input-plugins.git /etc/logstash/conf.d/logstash-input-plugins
This will clone the repository to the folder /etc/logstash/conf.d/logstash-input-plugins folder.
Heartbeat Input plugin
Heartbeat input plugin is one of the simple but most useful input plugins available for Logstash. This is one simple way by which we can check whether the Logstash is up and running without any issues. Put simply, we can check Logstash’s pulse using this plugin.
This will send periodic messages to the target Elasticsearch or any other destination. The intervals at which these messages are sent can also be defined by us.
Let’s look at the configuration for sending a status message every 5 seconds, by going to the following link:
https://raw.githubusercontent.com/2arunpmohan/logstash-input-plugins/master/heartbeat/heartbeat.conf
The configuration looks like this:
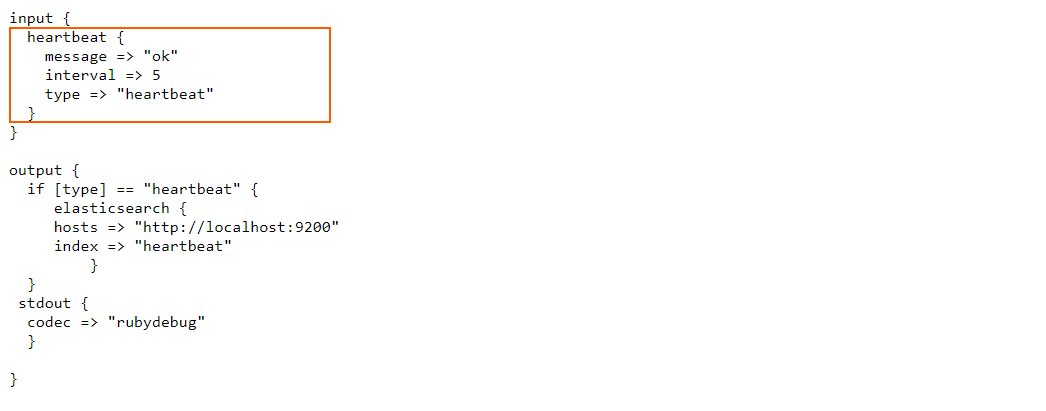
You can see there are two important settings in the “heartbeat” plugin namely the “message” and the “interval”.
The “interval” value is in seconds and the heartbeat plugin will send the periodic messages in 5 seconds interval.
“message” setting will emit the specified string as the health indicator string. By default it will emit “ok”. We can give any value here.
Let’s run logstash using the above configuration, by typing in the command:
sudo /usr/share/logstash/bin/logstash -f /etc/logstash/conf.d/logstash-input-plugins/heartbeat/heartbeat.conf
Wait for some time till the Logstash starts running and you can press CTRL+C after that.
To view a sample document generated by the heartbeat plugin, you can type in the following request:
curl -XGET "https://127.0.0.1:9200/heartbeat/_search?pretty=true" -H 'Content-Type: application/json' -d'{ "size": 1}'
This request will give the response as:
{
  "took" : 0,
  "timed_out" : false,
  "_shards" : {
    "total" : 1,
    "successful" : 1,
    "skipped" : 0,
    "failed" : 0
  },
  "hits" : {
    "total" : {
      "value" : 44,
      "relation" : "eq"
    },
    "max_score" : 1.0,
    "hits" : [
      {
        "_index" : "heartbeat",
        "_type" : "_doc",
        "_id" : "_ZOa-3IBngqXVfHU3YTf",
        "_score" : 1.0,
        "_source" : {
          "message" : "ok",
          "@timestamp" : "2020-06-28T15:45:29.966Z",
          "type" : "heartbeat",
          "host" : "es7",
          "@version" : "1"
        }
      }
    ]
  }
}
You can see the field named “message” with the specified string “ok” in the document.
Now let’s explore other two different options that can be given to the “message” setting.
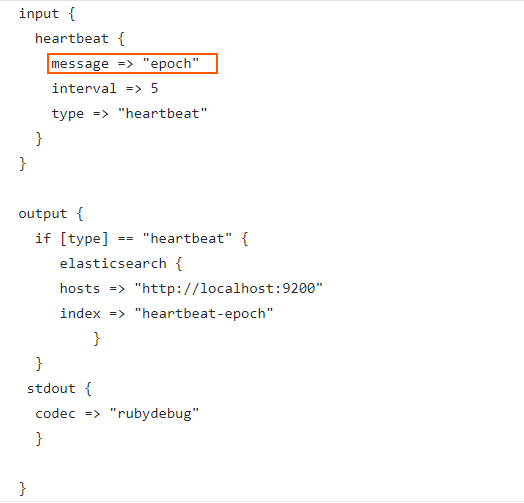
If we give the value “epoch” in the “message” setting, it will emit the time of the event as an epoch value under a field called “clock”.
Let’s replace the “ok” with the “epoch” for the “message” setting in our configuration.
The updated configuration can be found in:
https://raw.githubusercontent.com/2arunpmohan/logstash-input-plugins/master/heartbeat/heartbeat-epoch.conf
The configuration would look like this
Let’s run Logstash with this configuration file using the command:
sudo /usr/share/logstash/bin/logstash -f /etc/logstash/conf.d/logstash-input-plugins/heartbeat/heartbeat-epoch.conf
Give some time for Logstash to run. After it has started running, wait for some time and then hit CTRL+C to quit the Logstash screen and to stop it.
Let’s inspect a single document from the index which we created now by typing in the request:
curl -XGET "https://127.0.0.1:9200/heartbeat-epoch/_search?pretty=true" -H 'Content-Type: application/json' -d'{ "size": 1}'
You can see that the document in the result looks like this:
{
        "_index" : "heartbeat-epoch",
        "_type" : "_doc",
        "_id" : "_ZOM_HIBngqXVfHUd6d_",
        "_score" : 1.0,
        "_source" : {
          "host" : "es7",
          "@timestamp" : "2020-06-28T20:09:23.480Z",
          "clock" : 1593374963,
          "type" : "heartbeat",
          "@version" : "1"
        }
      }
In this document, you can see that there is a field called “clock” which has the time in “epoch” representation. This is really helpful in scenarios where we need to calculate the delays in the ingestion pipelines using Logstash. The actual time of generation of an event and the time of ingestion can be subtracted to find the time delay in ingestion.
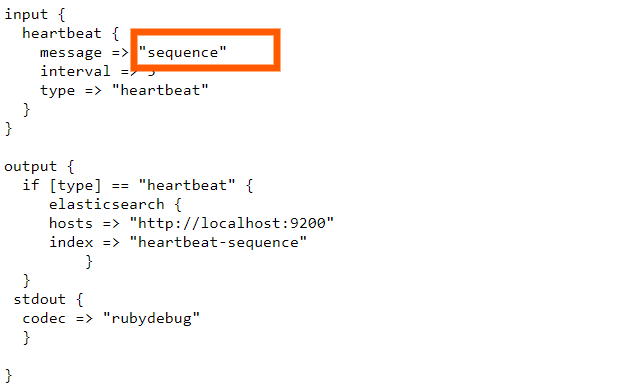
Also, the “message” setting can be set to have the value “sequence”, which basically will generate incrementing numbers in sequence under the field “clock”. The configuration of the logstash for this can be found in this link:
https://raw.githubusercontent.com/2arunpmohan/logstash-input-plugins/master/heartbeat/heartbeat-sequence.conf
The configuration would look like this:
Let’s run Logstash with this configuration file using the command:
sudo /usr/share/logstash/bin/logstash -f /etc/logstash/conf.d/logstash-input-plugins/heartbeat/heartbeat-sequence.conf
Give some time for Logstash to run. After it has started running, wait for some time and then hit CTRL+C to quit the Logstash screen and to stop it.
Let’s inspect a few documents from the index which we created now by typing in the request:
curl -XGET "https://127.0.0.1:9200/heartbeat-sequence/_search?pretty=true" -H 'Content-Type: application/json' -d'{
  "sort": [
    {
      "@timestamp": {
        "order": "asc"
      }
    }
  ]
}'
In the query, I have asked Elasticsearch to return the documents based on the ascending order of timestamps.
You can see that the returned documents would look like below:
{
  "took" : 3,
  "timed_out" : false,
  "_shards" : {
    "total" : 1,
    "successful" : 1,
    "skipped" : 0,
    "failed" : 0
  },
  "hits" : {
    "total" : {
      "value" : 45,
      "relation" : "eq"
    },
    "max_score" : null,
    "hits" : [
      {
        "_index" : "heartbeat-sequence",
        "_type" : "_doc",
        "_id" : "5Db5FnMBfj_gbv8MHEss",
        "_score" : null,
        "_source" : {
          "@timestamp" : "2020-07-03T23:18:09.159Z",
          "clock" : 1
        },
        "sort" : [
          1593818289159
        ]
      },
      {
        "_index" : "heartbeat-sequence",
        "_type" : "_doc",
        "_id" : "5zb5FnMBfj_gbv8MKEuq",
        "_score" : null,
        "_source" : {
          "@timestamp" : "2020-07-03T23:18:14.023Z",
          "clock" : 2
        },
        "sort" : [
          1593818294023
        ]
      },
      {
        "_index" : "heartbeat-sequence",
        "_type" : "_doc",
        "_id" : "8Db5FnMBfj_gbv8MO0sn",
        "_score" : null,
        "_source" : {
          "@timestamp" : "2020-07-03T23:18:19.054Z",
          "clock" : 3
        },
        "sort" : [
          1593818299054
        ]
      },
      {
        "_index" : "heartbeat-sequence",
        "_type" : "_doc",
        "_id" : "Lzb5FnMBfj_gbv8MTkyz",
        "_score" : null,
        "_source" : {
          "@timestamp" : "2020-07-03T23:18:24.055Z",
          "clock" : 4
        },
        "sort" : [
          1593818304055
        ]
      },
      {
        "_index" : "heartbeat-sequence",
        "_type" : "_doc",
        "_id" : "NDb5FnMBfj_gbv8MYkwu",
        "_score" : null,
        "_source" : {
          "@timestamp" : "2020-07-03T23:18:29.056Z",
          "clock" : 5
        },
        "sort" : [
          1593818309056
        ]
      },
      {
        "_index" : "heartbeat-sequence",
        "_type" : "_doc",
        "_id" : "OTb5FnMBfj_gbv8MdUyz",
        "_score" : null,
        "_source" : {
          "@timestamp" : "2020-07-03T23:18:34.056Z",
          "clock" : 6
        },
        "sort" : [
          1593818314056
        ]
      },
      {
        "_index" : "heartbeat-sequence",
        "_type" : "_doc",
        "_id" : "PDb5FnMBfj_gbv8MiUxA",
        "_score" : null,
        "_source" : {
          "@timestamp" : "2020-07-03T23:18:39.056Z",
          "clock" : 7
        },
        "sort" : [
          1593818319056
        ]
      },
      {
        "_index" : "heartbeat-sequence",
        "_type" : "_doc",
        "_id" : "Qjb5FnMBfj_gbv8MnEzH",
        "_score" : null,
        "_source" : {
          "@timestamp" : "2020-07-03T23:18:44.057Z",
          "clock" : 8
        },
        "sort" : [
          1593818324057
        ]
      },
      {
        "_index" : "heartbeat-sequence",
        "_type" : "_doc",
        "_id" : "RDb5FnMBfj_gbv8MsExQ",
        "_score" : null,
        "_source" : {
          "@timestamp" : "2020-07-03T23:18:49.057Z",
          "clock" : 9
        },
        "sort" : [
          1593818329057
        ]
      },
      {
        "_index" : "heartbeat-sequence",
        "_type" : "_doc",
        "_id" : "Rzb5FnMBfj_gbv8MxEwD",
        "_score" : null,
        "_source" : {
          "@timestamp" : "2020-07-03T23:18:54.057Z",
          "clock" : 10
        },
        "sort" : [
          1593818334057
        ]
      }
    ]
  }
}
Here the field “clock” can be seen with incrementing numbers and has been sent in every 5 seconds. This is also helpful in determining missed events.
Generate Input plugin
Sometimes for testing or other purposes it would be great to have some specified data to be inserted. The conditions might vary like you might want to have some specific data generated for longer times, or some data generated for some iterations etc. Of course we can write custom scripts or programs to generate such data and send to a file or even Logstash directly. But there is a much more simple way to do such things within Logstash itself. We can use the generator plugin for logstash to generate random/custom log events.
Let’s dive into an example first.
The configuration for the example can be seen in the link
https://raw.githubusercontent.com/2arunpmohan/logstash-input-plugins/master/generator/generator.conf
The configuration would look like this:

In the configuration, under the “lines” section, two JSON documents were given and also for the Logstash to understand it is JSON, we have specified the “codec” value as JSON.
Now, “count” parameter is set to 0, which basically tells the Logstash to generate an infinite number of events with the values in the “lines” array.
If we set any other number for the “count” parameter, Logstash will generate each line that many times.
Let’s run Logstash with this configuration file using the command:
sudo /usr/share/logstash/bin/logstash -f /etc/logstash/conf.d/logstash-input-plugins/generator/generator.conf
Give some time for Logstash to run. After it has started running, wait for some time and then hit CTRL+C to quit the Logstash screen and to stop it.
Let’s inspect a single document from the index which we created now by typing in the request:
curl -XGET "https://127.0.0.1:9200/generator/_search?pretty=true" -H 'Content-Type: application/json' -d'{ "size": 1}'
You can see that the document in the result looks like this:
{
        "_index" : "generator",
        "_type" : "_doc",
        "_id" : "oDYqF3MBfj_gbv8MqlUB",
        "_score" : 1.0,
        "_source" : {
          "last_name" : "Tarn",
          "sequence" : 0,
          "gender" : "Male",
          "host" : "es7",
          "@version" : "1",
          "@timestamp" : "2020-07-04T00:12:16.363Z",
          "email" : "[email protected]",
          "id" : 1,
          "ip_address" : "112.29.200.6",
          "first_name" : "Ford"
        }
}
This plugin is very useful when we need to have documents generated for testing. We can give multiple lines and test grok patterns or filters and see how they are getting indexed using this plugin.
Dead letter queue
This is one important input plugin and is an immensely helpful one too. So far we have seen the cases of successful processing of events by Logstash. Now what happens when Logstash fails to process an event? Normally the event is dropped and hence we will lose it.
In many cases it would be helpful to collect those documents for further inspection and do the necessary actions so that in future the event dropping won’t happen.
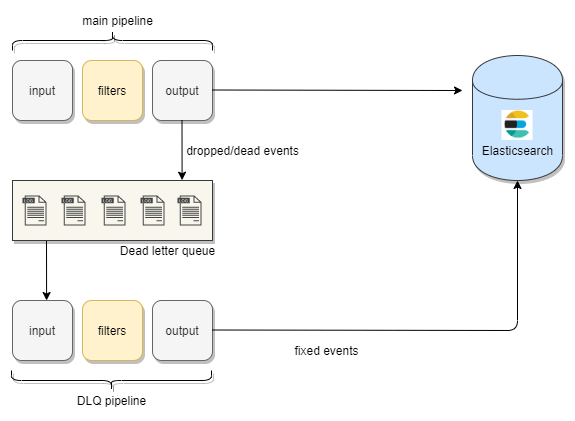
To make this possible Logstash provides us with a queue called dead-letter-queue. The events which are dropped would get collected here.
Now, once in the dead-letter-queue, with the help of this dead-letter-queue input plugin , we can process these documents using another Logstash configuration and make the necessary changes and then index them back to Elasticsearch.
You can see the flow of unprocessed events to dead-letter-queue and then to Elasticsearch in this diagram.
So that we have seen what is “dead-letter-queue” in Logstash, let’s move on to a simple use case involving the dead letter queue input plugin.
Since we are using the dead-letter-queue input plugin, we need to do two things prior.
First, we need to enable the dead-letter-queue.
Second, we need to set the path to the dead-letter-queue.
Let’s create a folder named dlq to store the dead-letter-queue data by typing in the following command
mkdir /home/student/dlq
Now, Logstash creates a user named “logstash” during the installation and performs the actions using this user. So let’s change the ownership of the above folder to the user named “logstash” by typing in the following command
sudo chown -R logstash:logstash /home/student/dlq
Now let’s enable the dead_letter_queue and also specify its path in the logstash’s setting by editing the settings file by typing in
sudo nano /etc/logstash/logstash.yml
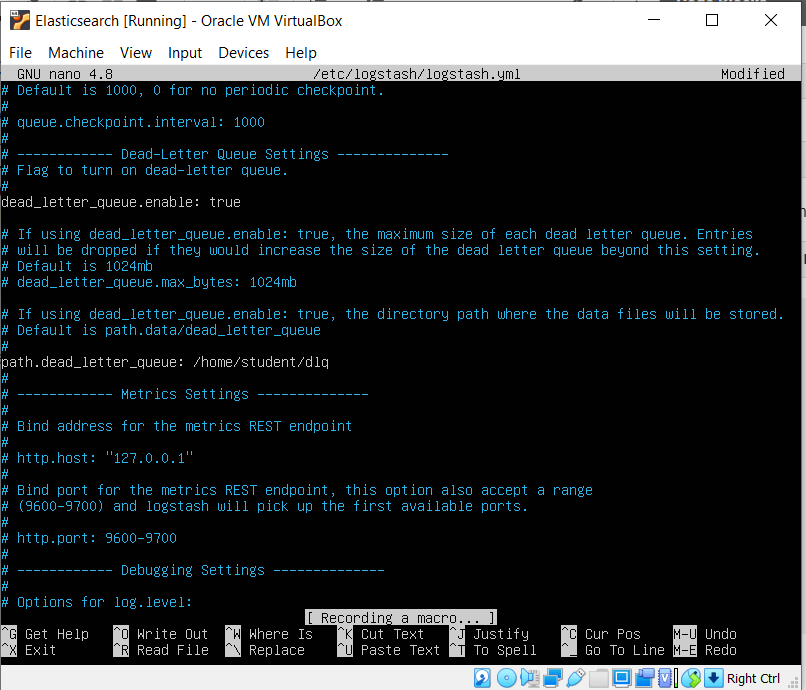
Now uncomment the setting dead_letter_queue and give the value as true
Also give set the path to store the queue data, by uncommenting the path.dead_letter_queue as /home/student/dlq
The sections of the logstash.yml file will look like this after we have made the necessary edits

To save our file, we press CTRL+X, then press Y, and finally ENTER.
Now let’s input a few documents from a JSON file.
Let’s have a look at the documents in the file by opening the file using the command
cat /etc/logstash/conf.d/logstash-input-plugins/sample-data.json
You can see that, in the first 10 documents, the “age” field has integer values. But from the 11th document, it is mistakenly given as boolean. So what happens is that Elasticsearch will assign a type “long” data type used for the integers for the “age” field. This is because, when we are indexing the documents the first document which has the “age” as integers are indexed first, so Elasticsearch will assign them the “age” field. Now, when the 11th document comes with the boolean value for “age” , Elasticsearch will reject the document since a field cannot contain two data types. So it does for all the documents with “age” as a boolean value.
So let’s index the sample data and see what happens.
For that let’s run the configuration file for logstash. Let’s have a look at the configuration file by going to the following link:
https://raw.githubusercontent.com/2arunpmohan/logstash-input-plugins/master/dead-letter-queue/dlq-data-01-ingest.conf
The configuration file would look like this:
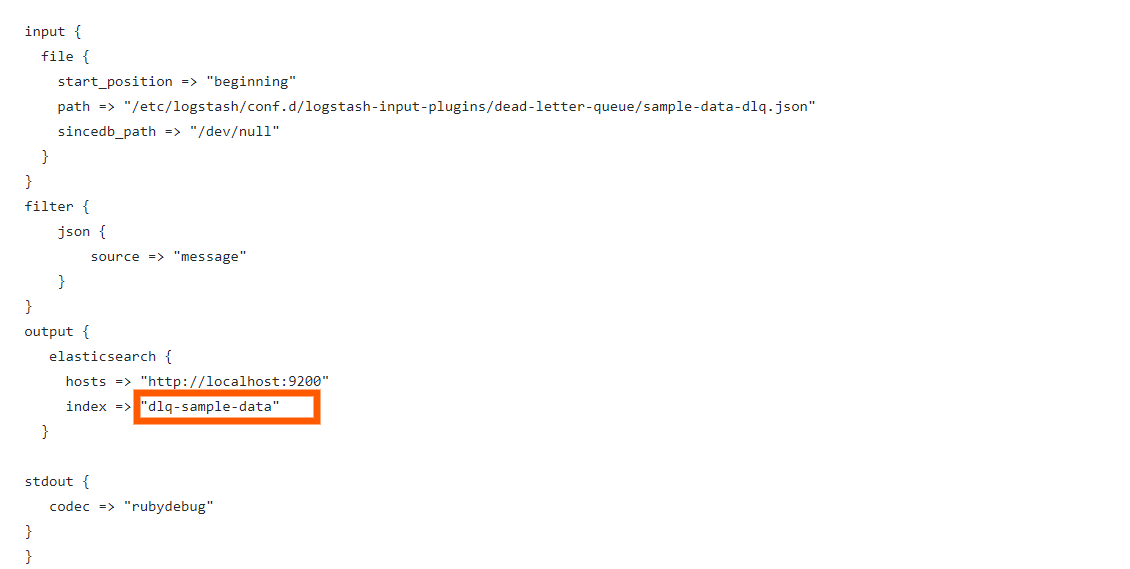
You can type in this command to run Logstash for indexing the sample data
sudo /usr/share/logstash/bin/logstash --path.settings /etc/logstash -f /etc/logstash/conf.d/dead-letter-queue/dlq-data-01.conf
In the command we typed, there is an extra parameter called “path.settings” and its value “/etc/logstash”. This is given so that Logstash will understand where the logstash.yml file is located and will take that settings.
Give some time for Logstash to run. After it has started running, wait for some time and then hit CTRL+C to quit the Logstash screen and to stop it.
Let’s inspect how many documents were inserted to the index. There was a total of 20 documents and out of it only 10 should have been indexed as the other 10 would have the mapping issue.
curl -XGET "https://127.0.0.1:9200/dlq-sample-data/_search?pretty=true" -H 'Content-Type: application/json' -d'{ "track_total_hits": true, size:0}'
You can see that the response will looks like this:
{
  "took" : 0,
  "timed_out" : false,
  "_shards" : {
    "total" : 1,
    "successful" : 1,
    "skipped" : 0,
    "failed" : 0
  },
  "hits" : {
    "total" : {
      "value" : 10,
      "relation" : "eq"
    },
    "max_score" : 1.0,
    "hits" : [
      {
        "_index" : "dlq-sample-data",
        "_type" : "_doc",
        "_id" : "G2v1GHMBfj_gbv8MTzae",
        "_score" : 1.0,
        "_source" : {
          "@timestamp" : "2020-07-04T08:33:14.322Z",
          "@version" : "1",
          "gender" : "Female",
          "host" : "es7",
          "message" : """{"age":39,"full_name":"Shelley Bangs","gender":"Female"}""",
          "path" : "/etc/logstash/conf.d/logstash-input-plugins/dead-letter-queue/sample-data-dlq.json",
          "age" : 39,
          "full_name" : "Shelley Bangs"
        }
      }
    ]
  }
}
In the response you can see that the hits.total.value is equal to 10 (marked in bold in the above response).
Now you can see that the remaining 10 documents are not indexed.So these documents are dropped and since we have enabled the dead_letter_queue, these documents should be there.
Let’s use the input plugin for reading from the dead_letter_queue.
The configuration for reading from the dead_letter_queue can be seen in this link:
https://raw.githubusercontent.com/2arunpmohan/logstash-input-plugins/master/dead-letter-queue/dlq.conf
The configuration looks like this
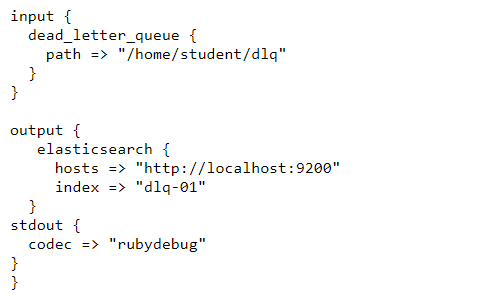
In the configuration, we have pointed to the path where we had set the dead_letter_queue. Now if we run the configuration Logstash will read the contents in the dead_letter_queue and process it and then index to Elasticsearch.
For the sake of simplicity , in the configuration, I have not added any filters. We definitely can add filters depending up on the use case and then run the configuration if we want.
Let’s run Logstash with this configuration file using the command:
sudo /usr/share/logstash/bin/logstash --path.settings /etc/logstash -f /etc/logstash/conf.d/logstash-input-plugins/dead-letter-queue/dlq.conf
Give some time for Logstash to run. After it has started running, wait for some time and then hit CTRL+C to quit the Logstash screen and to stop it.
Let’s inspect the number of documents that were indexed now by typing in the request:
curl -XGET "https://127.0.0.1:9200/dlq-01/_search?pretty=true" -H 'Content-Type: application/json' -d'{ "size": 1}'
The response to the request will return this.
{
  "took" : 0,
  "timed_out" : false,
  "_shards" : {
    "total" : 1,
    "successful" : 1,
    "skipped" : 0,
    "failed" : 0
  },
  "hits" : {
    "total" : {
      "value" : 10,
      "relation" : "eq"
    },
    "max_score" : 1.0,
    "hits" : [
      {
        "_index" : "dlq-01",
        "_type" : "_doc",
        "_id" : "O2thGnMBfj_gbv8MJmR4",
        "_score" : 1.0,
        "_source" : {
          "@timestamp" : "2020-07-04T08:33:14.502Z",
          "full_name" : "Robbyn Narrie",
          "gender" : "Female",
          "@version" : "1",
          "path" : "/etc/logstash/conf.d/logstash-input-plugins/dead-letter-queue/sample-data-dlq.json",
          "host" : "es7",
          "message" : """{"age":false,"full_name":"Robbyn Narrie","gender":"Female"}""",
          "age" : false
        }
      }
    ]
  }
}
You can see that there are 10 documents that were indexed. And upon inspection on the sample document, it has returned the document which had the boolean value for the field “age”.
Note that with this configuration, after running the Logstash, the queue contents would not be cleared. If you want the documents which were read not to be indexed again, the flag “commit_offsets” to true, just under the “path” setting.
Http_poller plugin
The http_poller plugin is a very useful input plugin that comes with Logstash. As the name indicates, this plugin can be used to poll http endpoints periodically and let us store the response in Elasticsearch.
This can be helpful if we have health APIs exposed for our applications and need periodic status monitoring of them. Also we can use it to collect the status like weather, match details etc periodically.
In our case let’s look at polling two http APIs for the purpose of understanding the plugin. We will first call a POST method to an external API at an interval of 5 seconds, and will store it to an index named “http-poller-api”. Then we will also call the Elasticsearch’s cluster health API, which is a GET request , in every second and store it in an index named “http-poller-es-health”.
Let’s first familiarize with both of the APIs first.
The first API is a simple online free API, which gives some response when we give a POST request.
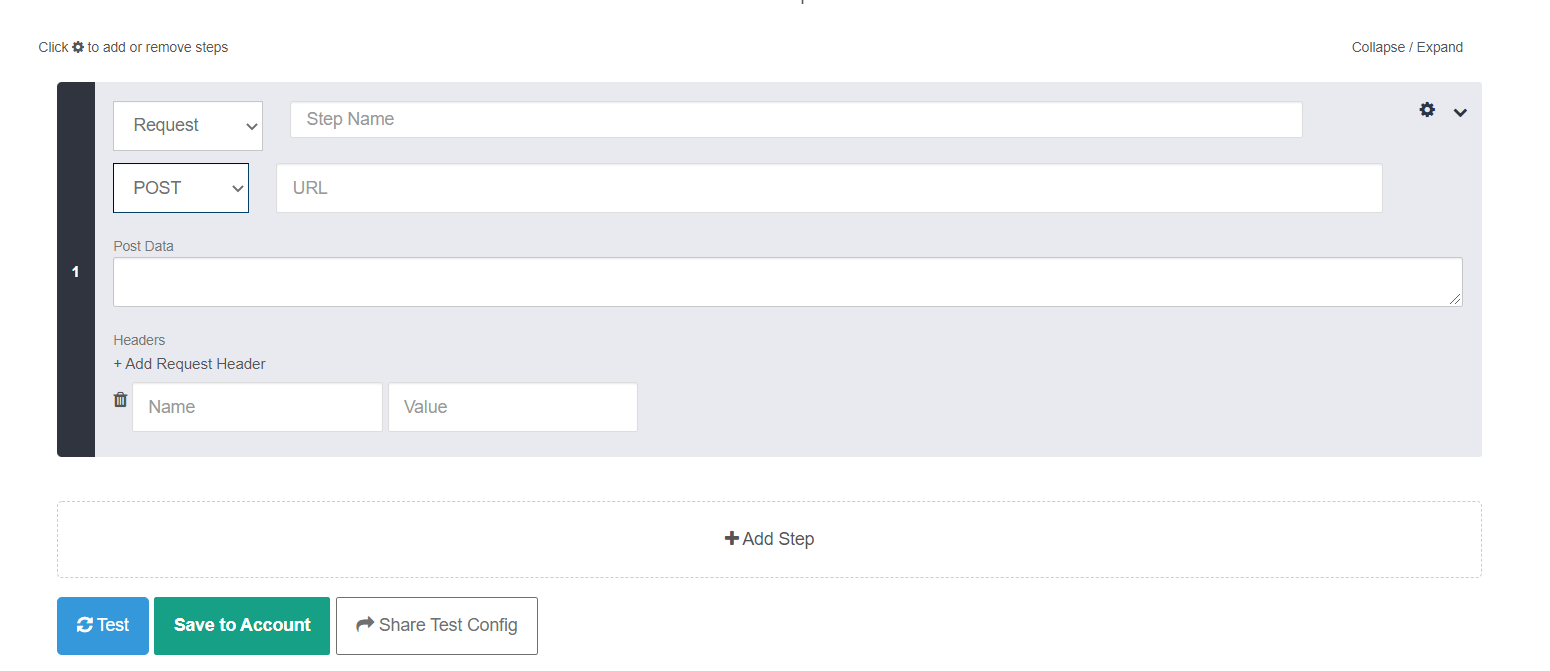
Open the website apitester.com and a web page will open like this. We open this website simply to test one of the APIs we are trying to call.
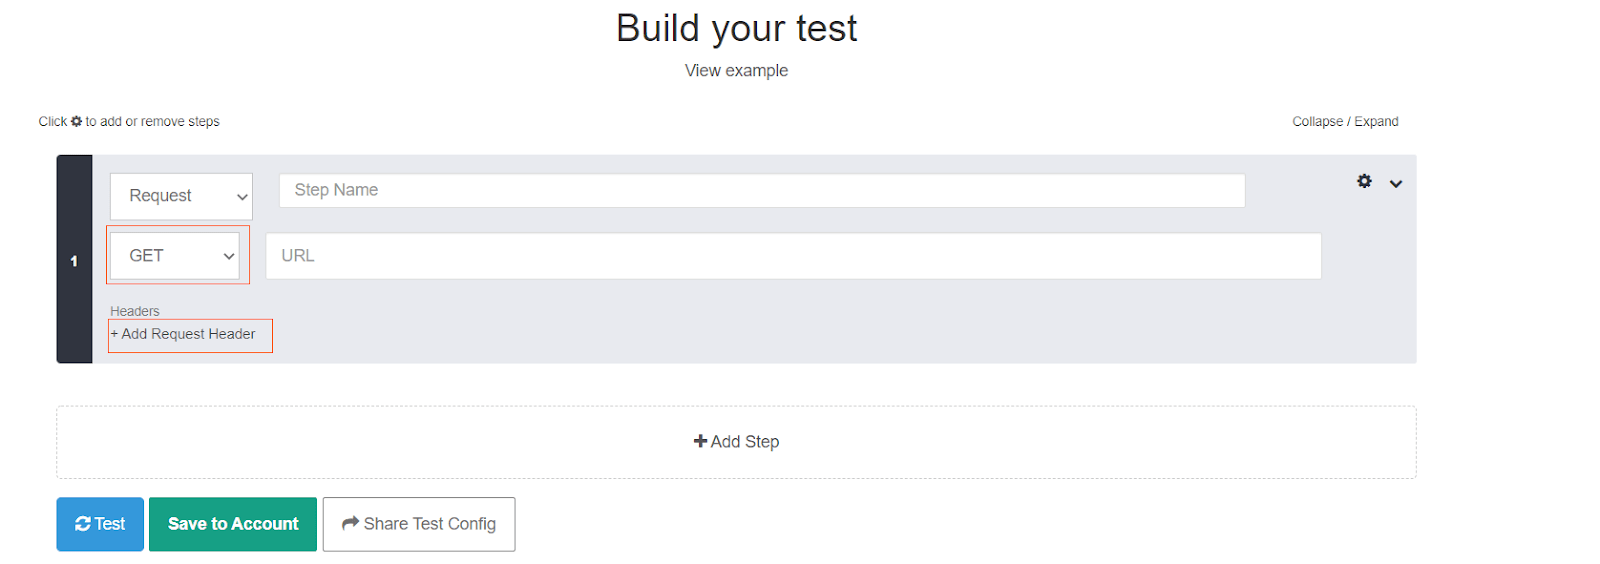
Now change the value GET to POST from the dropdown and also click on the “Add Request Header”. The resulting window would look like this:
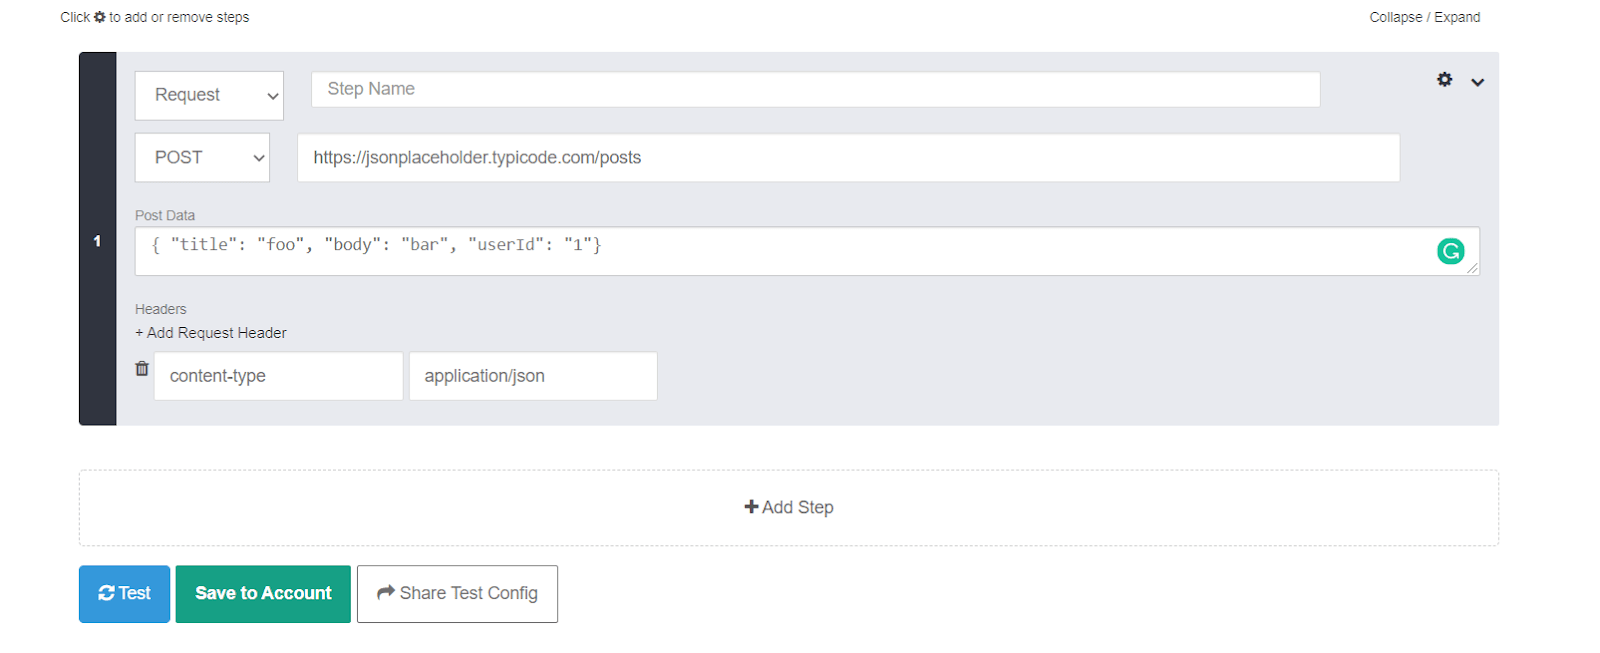
Now, fill the box marked as URL with this address https://jsonplaceholder.typicode.com/posts
In the section post data, add the following JSON lines
{ "title": "foo", "body": "bar", "userId": "1"}
And add “content-type” and “application/json” as the key value pairs for the boxes named “name” and “value” respectively.
The filled form details would look like this:
Now press the “Test” button and you can see the response details as below:
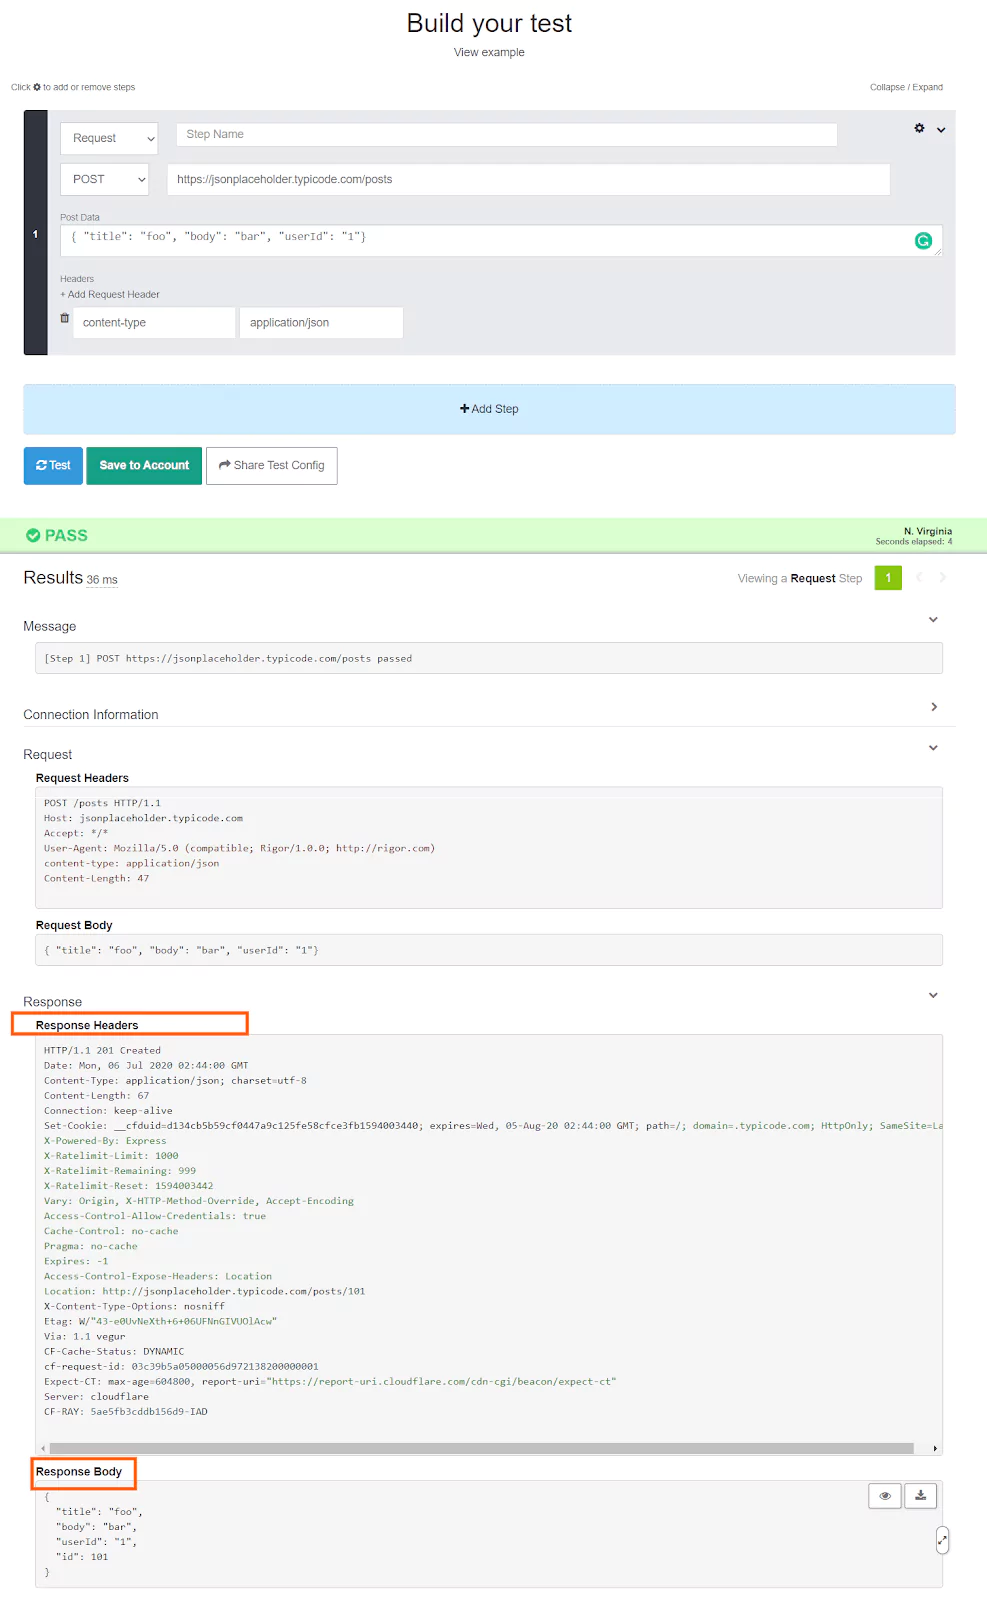
What this API does is that it will create a record in the remote database and send the details with the record id as the response body. You can also see a pretty long response header also along with the response.
Our second API is a GET request supplied by our own Elasticsearch itself, which gives us the cluster status. You can test the API by typing in the following request in the terminal
curl -XGET "https://localhost:9200/_cluster/health"
This will result in the following response:
{
  "cluster_name" : "elasticsearch",
  "status" : "yellow",
  "timed_out" : false,
  "number_of_nodes" : 1,
  "number_of_data_nodes" : 1,
  "active_primary_shards" : 56,
  "active_shards" : 56,
  "relocating_shards" : 0,
  "initializing_shards" : 0,
  "unassigned_shards" : 50,
  "delayed_unassigned_shards" : 0,
  "number_of_pending_tasks" : 0,
  "number_of_in_flight_fetch" : 0,
  "task_max_waiting_in_queue_millis" : 0,
  "active_shards_percent_as_number" : 52.83018867924528
}
Now that we have familiarised both the API calls , let’s have a look at the configuration for logstash. You can see the configuration in this link:
https://raw.githubusercontent.com/2arunpmohan/logstash-input-plugins/master/http-poller/http-poller.conf
The configuration would look like this:
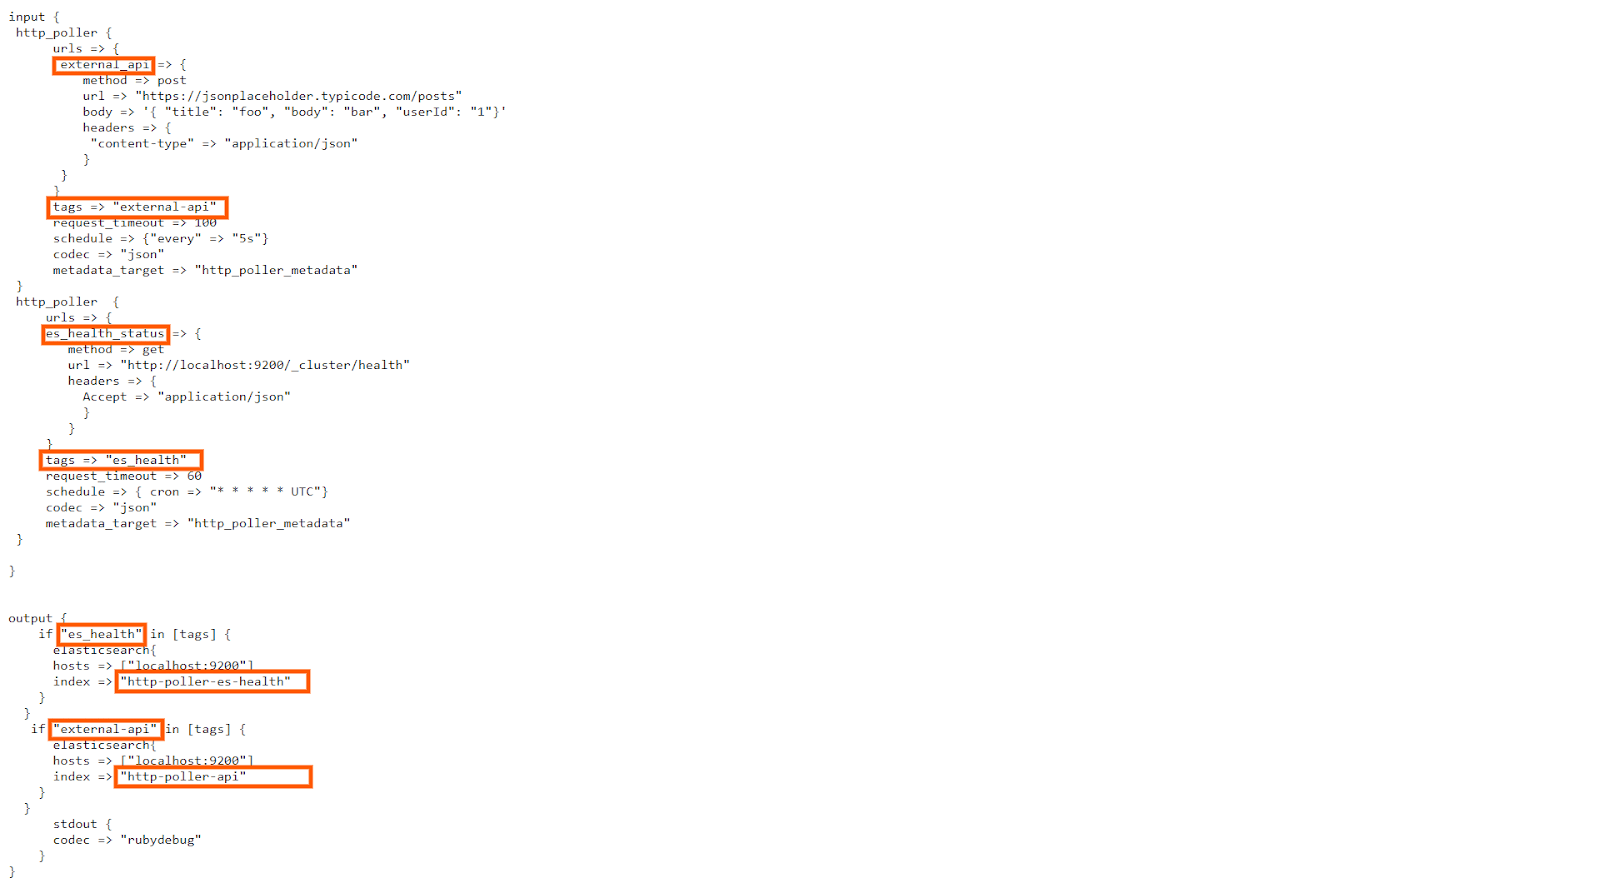
In the configuration you can see two “http_poller” sections. One is named as “external_api” and the other is named as “es_health_status”.
In the “external_api” section , you can see the URL we have called in the first example, with the method, and the content-type mentioned in the “headers” section.
Apart from that, I have given an identifier named “external-api” in the “tags” to identify the response from this section.
Also the periodic scheduling is done every 5 seconds. This is specified under the “schedule” section.
Another important setting is the “metadata_target”. I have specified that to be “http_poller_metadata”. This will ensure that the response headers will be stored in the field named “http_poller_metadata” when storing in ES.
Similar settings are applied to the “es_health_status” section too. Here the difference is that the “method” is a GET method and also the “Schedule” section is given a cron expression as the value. Also the value of “tags” is “es_health”.
Now coming to the output section, there is a check on the “tags” field. If the data is coming from the “external-api” tag, the index where the data is stored is “http-poller-api”. But if the data contains “tags” value as “es_health”, it will be stored in the index named “http-poller-es-health”.
Since we have a good understanding of the Logstash configuration, let’s run this configuration by typing in this command
sudo /usr/share/logstash/bin/logstash -f /etc/logstash/conf.d/logstash-input-plugins/http_poller/http_poller.conf
Wait for some time for the logstash to run. Since it is a polling operation, Logstash won’t finish running,but will keep running. So after about 5 mins, you can stop the Logstash by hitting CTRL+C
Now let’s check whether we have data in both of the indices. Lets first query the index “http-poller-api” with this query:
curl -XGET "https://localhost:9200/http-poller-api/_search?pretty=true" -H 'Content-Type: application/json' -d'{
  "query": {
    "match_all": {
    }
  },
  "size": 1,
  "sort": [
    {
      "@timestamp": {
        "order": "desc"
      }
    }
  ]
}'
This will return a single document like this:
{
  "took" : 2,
  "timed_out" : false,
  "_shards" : {
    "total" : 1,
    "successful" : 1,
    "skipped" : 0,
    "failed" : 0
  },
  "hits" : {
    "total" : {
      "value" : 463,
      "relation" : "eq"
    },
    "max_score" : null,
    "hits" : [
      {
        "_index" : "http-poller-api",
        "_type" : "_doc",
        "_id" : "YGw8InMBfj_gbv8MmFqD",
        "_score" : null,
        "_source" : {
          "userId" : "1",
          "id" : 101,
          "@timestamp" : "2020-07-06T03:47:43.258Z",
          "http_poller_metadata" : {
            "request" : {
              "headers" : {
                "content-type" : "application/json"
              },
              "body" : """{ "title": "foo", "body": "bar", "userId": "1"}""",
              "method" : "post",
              "url" : "https://jsonplaceholder.typicode.com/posts"
            },
            "response_headers" : {
              "server" : "cloudflare",
              "expires" : "-1",
              "x-ratelimit-limit" : "1000",
              "content-length" : "67",
              "access-control-expose-headers" : "Location",
              "access-control-allow-credentials" : "true",
              "x-content-type-options" : "nosniff",
              "via" : "1.1 vegur",
              "pragma" : "no-cache",
              "etag" : "W/"43-e0UvNeXth+6+06UFNnGIVUOlAcw"",
              "date" : "Mon, 06 Jul 2020 03:47:43 GMT",
              "location" : "https://jsonplaceholder.typicode.com/posts/101",
              "cf-ray" : "5ae6588feab20000-SIN",
              "cache-control" : "no-cache",
              "connection" : "keep-alive",
              "content-type" : "application/json; charset=utf-8",
              "x-powered-by" : "Express",
              "x-ratelimit-reset" : "1594007283",
              "cf-cache-status" : "DYNAMIC",
              "expect-ct" : "max-age=604800, report-uri="https://report-uri.cloudflare.com/cdn-cgi/beacon/expect-ct"",
              "vary" : "Origin, X-HTTP-Method-Override, Accept-Encoding",
              "x-ratelimit-remaining" : "991",
              "cf-request-id" : "03c3d5adf3000100d3bf307200000001"
            },
            "code" : 201,
            "name" : "external_api",
            "response_message" : "Created",
            "times_retried" : 0,
            "runtime_seconds" : 0.576409,
            "host" : "es7"
          },
          "@version" : "1",
          "body" : "bar",
          "title" : "foo",
          "tags" : [
            "external-api"
          ]
        },
        "sort" : [
          1594007263258
        ]
      }
    ]
  }
}
In the response, you can see the “http_poller_metadata” field with the necessary details of both the request and response headers. Also there is the field named “id” returned by the server.
Now coming to the index “http-poller-es-health”, lets query the same query like this:
curl -XGET "https://localhost:9200/http-poller-es-health/_search?pretty=true" -H 'Content-Type: application/json' -d'{
  "query": {
    "match_all": {

    }
  },
  "size": 1,
  "sort": [
    {
      "@timestamp": {
        "order": "desc"
      }
    }
  ]
}'
This will return document like this:
{
  "took" : 0,
  "timed_out" : false,
  "_shards" : {
    "total" : 1,
    "successful" : 1,
    "skipped" : 0,
    "failed" : 0
  },
  "hits" : {
    "total" : {
      "value" : 39,
      "relation" : "eq"
    },
    "max_score" : null,
    "hits" : [
      {
        "_index" : "http-poller-es-health",
        "_type" : "_doc",
        "_id" : "PWw7InMBfj_gbv8M8Fqg",
        "_score" : null,
        "_source" : {
          "number_of_pending_tasks" : 0,
          "task_max_waiting_in_queue_millis" : 0,
          "active_shards_percent_as_number" : 52.83018867924528,
          "status" : "yellow",
          "relocating_shards" : 0,
          "initializing_shards" : 0,
          "unassigned_shards" : 50,
          "active_primary_shards" : 56,
          "active_shards" : 56,
          "delayed_unassigned_shards" : 0,
          "timed_out" : false,
          "@version" : "1",
          "tags" : [
            "es_health"
          ],
          "cluster_name" : "elasticsearch",
          "@timestamp" : "2020-07-06T03:47:00.279Z",
          "number_of_in_flight_fetch" : 0,
          "number_of_nodes" : 1,
          "http_poller_metadata" : {
            "request" : {
              "headers" : {
                "Accept" : "application/json"
              },
              "method" : "get",
              "url" : "https://localhost:9200/_cluster/health"
            },
            "response_headers" : {
              "content-type" : "application/json; charset=UTF-8"
            },
            "code" : 200,
            "name" : "es_health_status",
            "response_message" : "OK",
            "times_retried" : 0,
            "runtime_seconds" : 0.0057480000000000005,
            "host" : "es7"
          },
          "number_of_data_nodes" : 1
        },
        "sort" : [
          1594007220279
        ]
      }
    ]
  }
}
Here also you can see the same.
So by using this input plugin we can call HTTP calls periodically index the response with necessary data to a single index or multiple indices.
Twitter plugin
Another interesting input plugin which is provided by Logstash is the Twitter plugin. Twitter input plugin allows us to stream Twitter events directly to Elasticsearch or any output that Logstash support.
Let’s explore the Twitter input plugin and see it in action.
For this to work, you need to have a Twitter account. If you don’t have one, don’t worry, just go to Twitter and create one using the signup option.
Now once you have your Twitter account, go to
https://developer.twitter.com/en/apps
This is the developer portal of Twitter. You can see the screen like this

Click on the “create an app” button. If you are creating an app for the first time, it would ask to “apply” and it might take a day or two to get the approval. So once you have the approval, the “create an app” clicking would redirect to a screen like this:
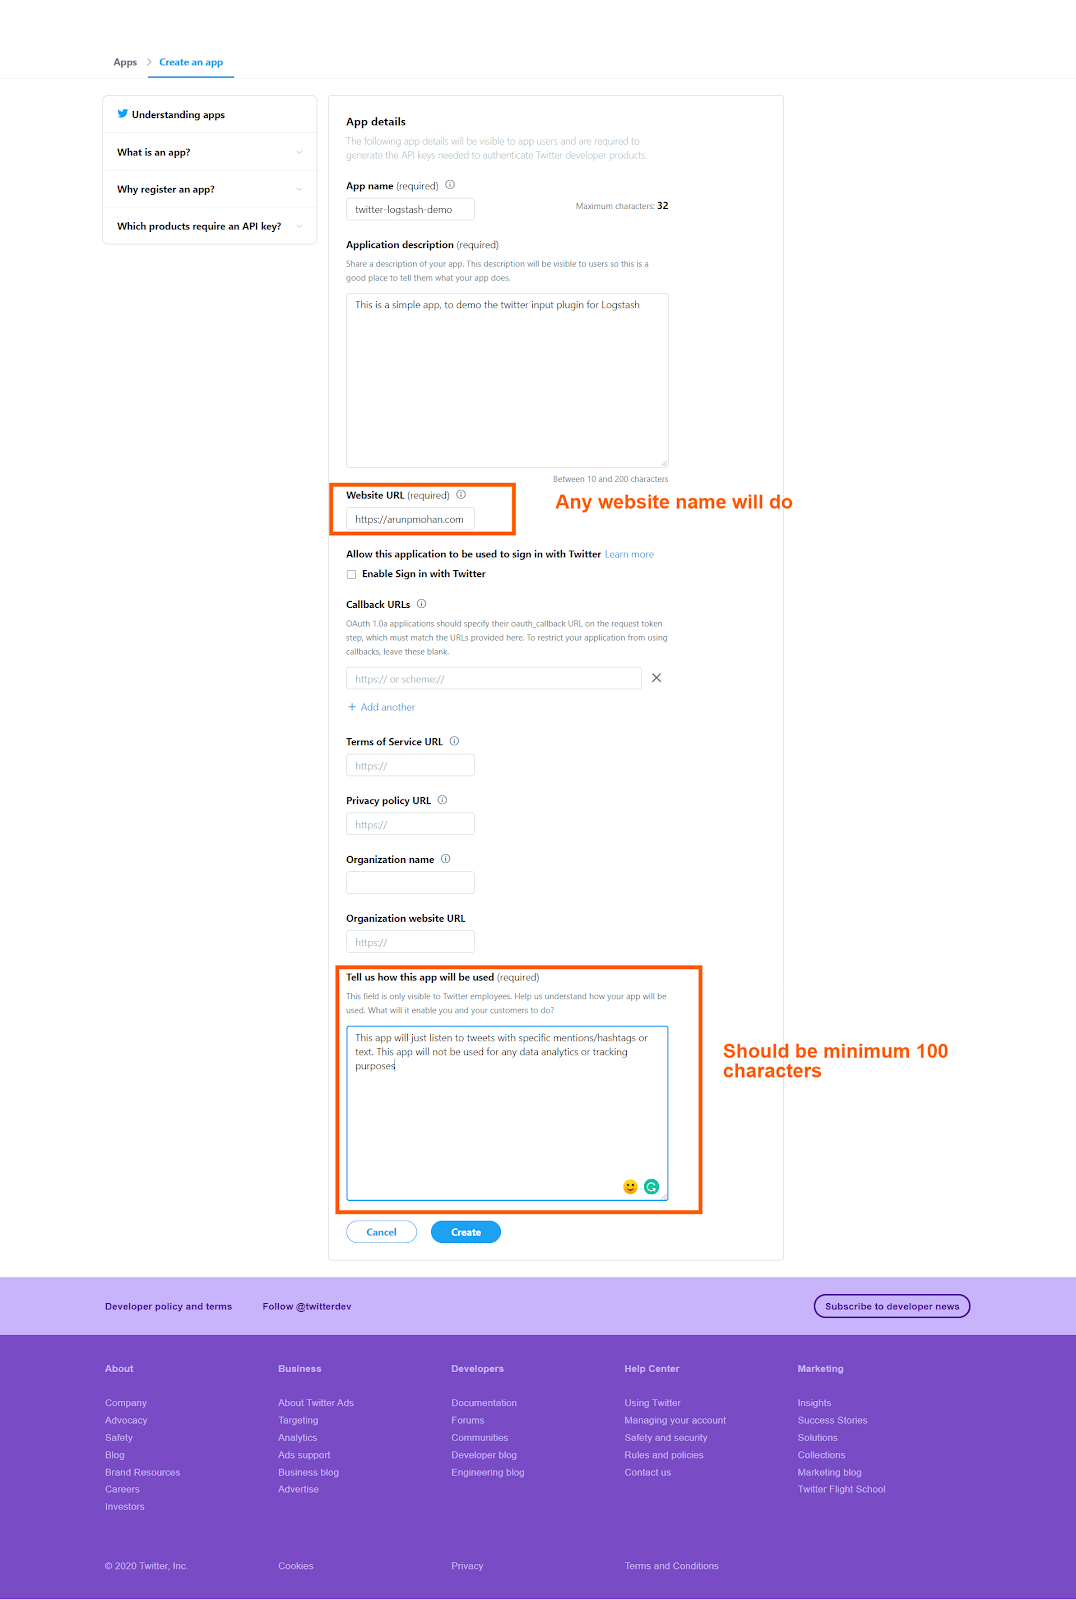
After pressing the “create” button in the bottom, it will ask once again for confirmation with the updated terms and conditions like this:

Clicking on the “create” button will create the app for us and you will see the screen like this
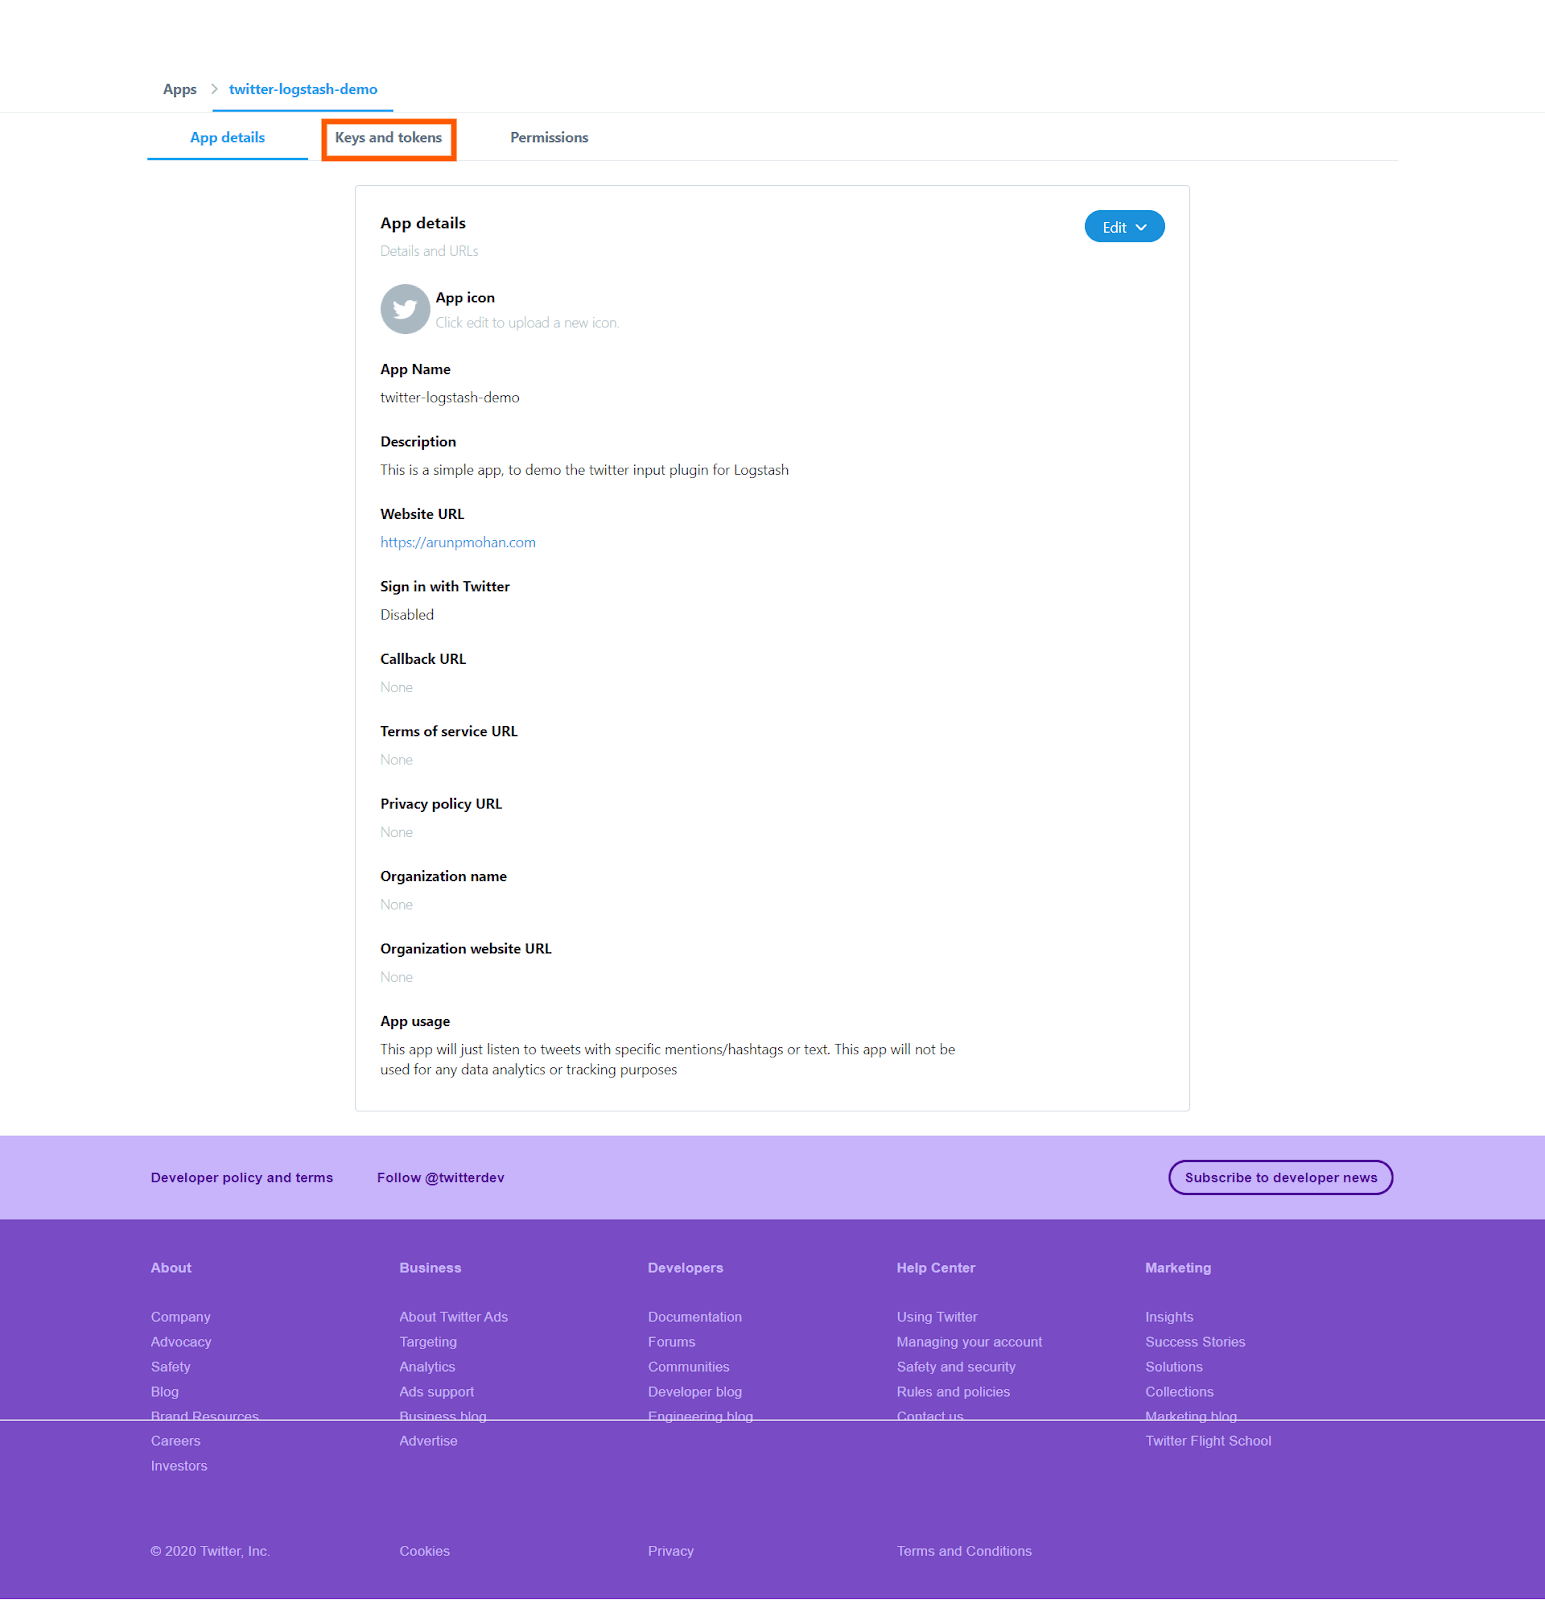
In the screen you can see three tabs, press the “keys and tokens” tab and you will see this screen, which contains the necessary keys and tokens
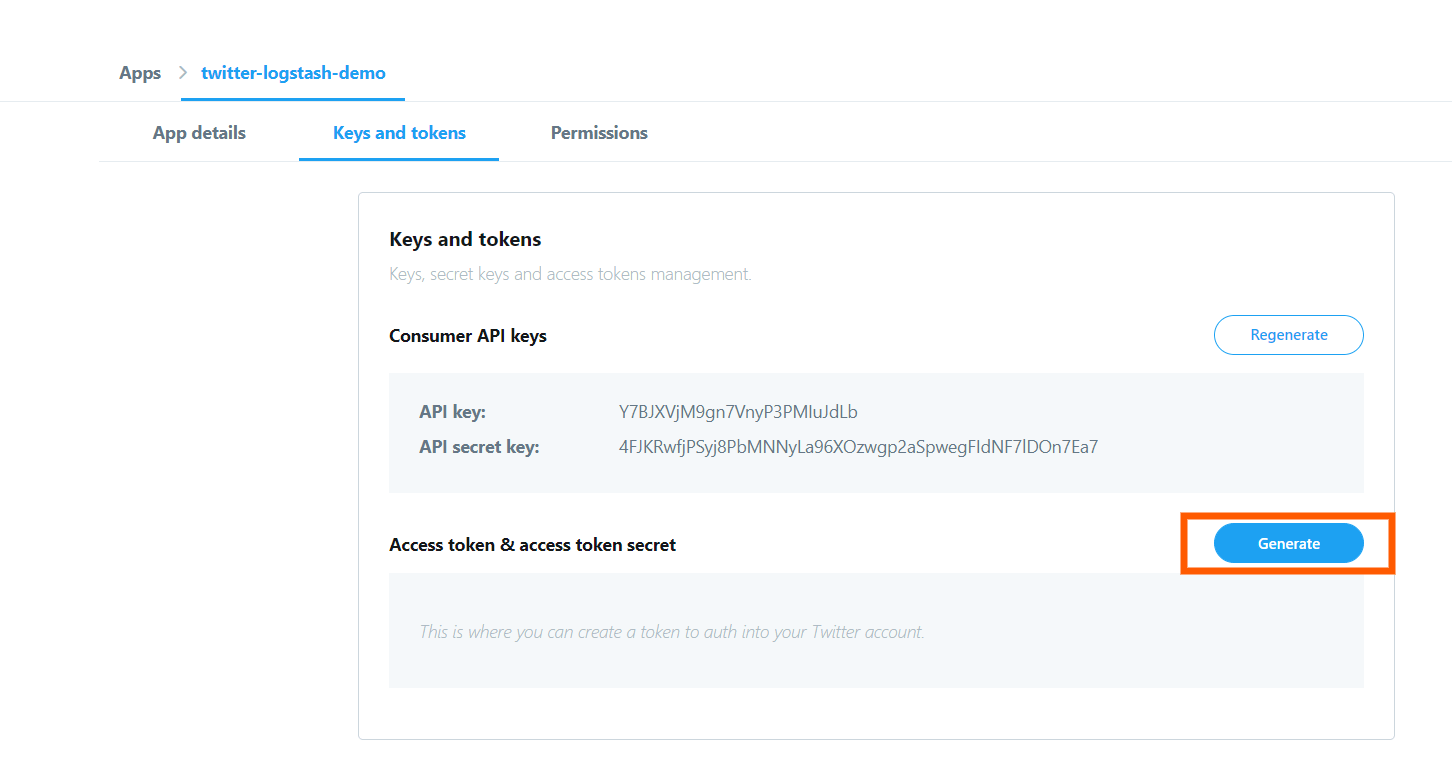
From this screen copy the “api key” and “api secret key” values to a notepad or so.
In the screen, press the “generate” button and the “access token” and “access token secret” will be generated for you like this:
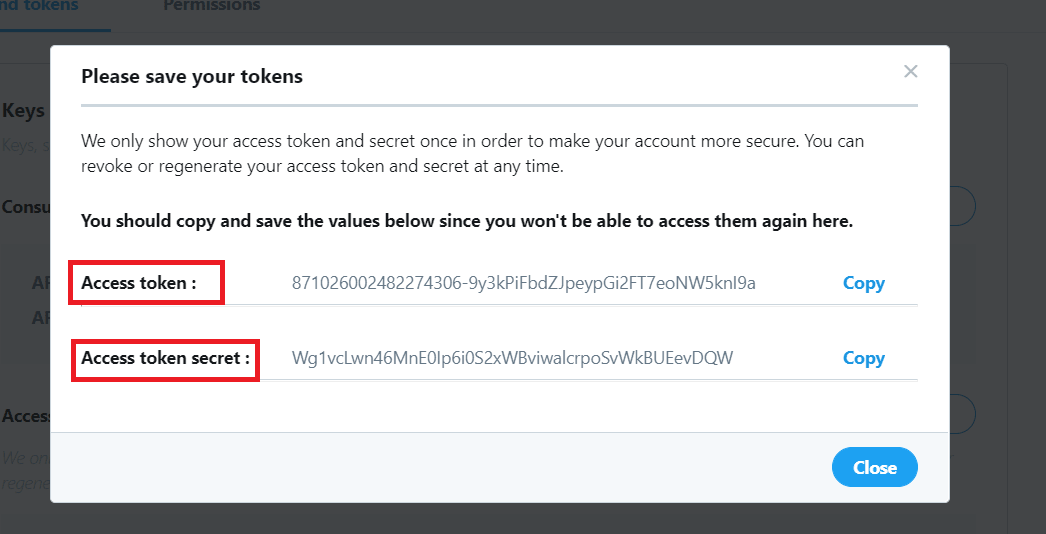
Now copy this information and keep them along with the “api key” and “api secret key” which you copied earlier in the notepad.
Now the information collected in the notepad will have the following details

Now we have the necessary information to proceed to use the Twitter plugin for Logstash.
Let’s look directly at the configuration file of this setup in this link:
https://raw.githubusercontent.com/2arunpmohan/logstash-input-plugins/master/twitter/twitter.conf
The configuration would look like this

Now enter the value of
“api key” which we copied to the notepad to that of the “consumer_key”
“api key secret” to that of the “consumer_secret”
“Access token” to that of the “oauth_token”
“Access token secret” to that of the “oauth_token_secret”
You can enter any string values in the “keywords” section which will get you the tweets which contains those strings. Here I have given “covid”, “corona” as the strings. This will give tweets which contain either “covid” OR “corona” in their body.
The “full_tweet” value is set to true to get the full information about the tweet as given by the Twitter
Let’s run Logstash with this configuration file using the command:
sudo /usr/share/logstash/bin/logstash -f /etc/logstash/conf.d/logstash-input-plugins/twitter/twitter.conf
Give some time for Logstash to run. After it has started running, wait for some time and then hit CTRL+C to quit the Logstash screen and to stop it.
Let’s inspect a single document from the index which we created now by typing in the request:
curl -XGET "https://127.0.0.1:9200/twitter/_search?pretty=true" -H 'Content-Type: application/json' -d'{ "size": 1}'
You can see that the document in the result looks like this:
{
  "took" : 0,
  "timed_out" : false,
  "_shards" : {
    "total" : 1,
    "successful" : 1,
    "skipped" : 0,
    "failed" : 0
  },
  "hits" : {
    "total" : {
      "value" : 115,
      "relation" : "eq"
    },
    "max_score" : 1.0,
    "hits" : [
      {
        "_index" : "twitter",
        "_type" : "_doc",
        "_id" : "OZNS-XIBngqXVfHUK0_d",
        "_score" : 1.0,
        "_source" : {
          "quote_count" : 0,
          "reply_count" : 0,
          "lang" : "en",
          "@version" : "1",
          "retweeted" : false,
          "coordinates" : null,
          "text" : "RT @beatbyanalisa: My biggest fear about contracting COVID is not getting sick, it's me unknowingly passing it along to someone else... And...",
          "in_reply_to_screen_name" : null,
          "is_quote_status" : false,
          "geo" : null,
          "favorite_count" : 0,
          "favorited" : false,
          "created_at" : "Sun Jun 28 05:06:43 +0000 2020",
          "retweeted_status" : {
            "quote_count" : 6,
            "reply_count" : 8,
            "lang" : "en",
            "retweeted" : false,
            "coordinates" : null,
            "text" : "My biggest fear about contracting COVID is not getting sick, it's me unknowingly passing it along to someone else..... https://t.co/Hh3mMNUewS",
            "in_reply_to_screen_name" : null,
            "is_quote_status" : false,
            "geo" : null,
            "extended_tweet" : {
              "full_text" : "My biggest fear about contracting COVID is not getting sick, it's me unknowingly passing it along to someone else... And then that someone may not be able to handle it as well as I may be able to. That's what scares me the most.",
              "display_text_range" : [
                0,
                228
              ],
              "entities" : {
                "hashtags" : [ ],
                "symbols" : [ ],
                "user_mentions" : [ ],
                "urls" : [ ]
              }
            },
            "favorite_count" : 87,
            "favorited" : false,
            "created_at" : "Sun Jun 28 01:06:16 +0000 2020",
            "truncated" : true,
            "retweet_count" : 46,
            "in_reply_to_status_id_str" : null,
            "in_reply_to_user_id" : null,
            "place" : null,
            "id" : 1277045619723558914,
            "filter_level" : "low",
            "user" : {
              "followers_count" : 1386,
              "friends_count" : 1032,
              "translator_type" : "none",
              "profile_background_color" : "000000",
              "profile_image_url" : "https://pbs.twimg.com/profile_images/1247544253015867394/wNFFsE6l_normal.jpg",
              "default_profile" : false,
              "lang" : null,
              "profile_background_image_url" : "https://abs.twimg.com/images/themes/theme9/bg.gif",
              "screen_name" : "beatbyanalisa",
              "profile_background_image_url_https" : "https://abs.twimg.com/images/themes/theme9/bg.gif",
              "geo_enabled" : true,
              "utc_offset" : null,
              "name" : """""",
              "listed_count" : 24,
              "profile_link_color" : "F76BB5",
              "statuses_count" : 70995,
              "profile_text_color" : "241006",
              "profile_banner_url" : "https://pbs.twimg.com/profile_banners/66204811/1581039038",
              "following" : null,
              "created_at" : "Sun Aug 16 22:09:45 +0000 2009",
              "time_zone" : null,
              "notifications" : null,
              "contributors_enabled" : false,
              "verified" : false,
              "id" : 66204811,
              "favourites_count" : 4986,
              "is_translator" : false,
              "profile_background_tile" : false,
              "profile_sidebar_fill_color" : "C79C68",
              "profile_sidebar_border_color" : "FFFFFF",
              "protected" : false,
              "description" : """• freelance mua • cheese connoisseur • catfish • IG:BeatByAnalisa • DM or email [email protected] for appt or PR inquiries! ✨""",
              "id_str" : "66204811",
              "default_profile_image" : false,
              "profile_use_background_image" : true,
              "location" : "San Antonio, TX",
              "follow_request_sent" : null,
              "url" : "https://www.instagram.com/beatbyanalisa/?hl=en",
              "profile_image_url_https" : "https://pbs.twimg.com/profile_images/1247544253015867394/wNFFsE6l_normal.jpg"
            },
            "in_reply_to_status_id" : null,
            "in_reply_to_user_id_str" : null,
            "source" : """
""",
            "id_str" : "1277045619723558914",
            "contributors" : null,
            "entities" : {
              "hashtags" : [ ],
              "symbols" : [ ],
              "user_mentions" : [ ],
              "urls" : [
                {
                  "display_url" : "twitter.com/i/web/status/1...",
                  "indices" : [
                    117,
                    140
                  ],
                  "url" : "https://t.co/Hh3mMNUewS",
                  "expanded_url" : "https://twitter.com/i/web/status/1277045619723558914"
                }
              ]
            }
          },
          "truncated" : false,
          "retweet_count" : 0,
          "@timestamp" : "2020-06-28T05:06:43.000Z",
          "in_reply_to_status_id_str" : null,
          "in_reply_to_user_id" : null,
          "place" : null,
          "id" : 1277106130813140993,
          "filter_level" : "low",
          "user" : {
            "followers_count" : 239,
            "friends_count" : 235,
            "translator_type" : "none",
            "profile_background_color" : "F5F8FA",
            "profile_image_url" : "https://pbs.twimg.com/profile_images/1276215312912957440/HBjApFTt_normal.jpg",
            "default_profile" : true,
            "lang" : null,
            "profile_background_image_url" : "",
            "screen_name" : "briannaaamariie",
            "profile_background_image_url_https" : "",
            "geo_enabled" : true,
            "utc_offset" : null,
            "name" : """""",
            "listed_count" : 0,
            "profile_link_color" : "1DA1F2",
            "statuses_count" : 555,
            "profile_text_color" : "333333",
            "profile_banner_url" : "https://pbs.twimg.com/profile_banners/1269087963373342723/1592204564",
            "following" : null,
            "created_at" : "Sat Jun 06 02:09:13 +0000 2020",
            "time_zone" : null,
            "notifications" : null,
            "contributors_enabled" : false,
            "verified" : false,
            "id" : 1269087963373342723,
            "favourites_count" : 1856,
            "is_translator" : false,
            "profile_background_tile" : false,
            "profile_sidebar_fill_color" : "DDEEF6",
            "profile_sidebar_border_color" : "C0DEED",
            "protected" : false,
            "description" : """, ,  ,   , """,
            "id_str" : "1269087963373342723",
            "default_profile_image" : false,
            "profile_use_background_image" : true,
            "location" : "San Antonio, TX",
            "follow_request_sent" : null,
            "url" : "https://instagram.com/briannaaamarieeee",
            "profile_image_url_https" : "https://pbs.twimg.com/profile_images/1276215312912957440/HBjApFTt_normal.jpg"
          },
          "timestamp_ms" : "1593320803727",
          "in_reply_to_status_id" : null,
          "in_reply_to_user_id_str" : null,
          "source" : """
""",
          "id_str" : "1277106130813140993",
          "contributors" : null,
          "entities" : {
            "hashtags" : [ ],
            "symbols" : [ ],
            "user_mentions" : [
              {
                "name" : """""",
                "id" : 66204811,
                "id_str" : "66204811",
                "indices" : [
                  3,
                  17
                ],
                "screen_name" : "beatbyanalisa"
              }
            ],
            "urls" : [ ]
          }
        }
      }
    ]
  }
}
As you can see there is a lot of information per tweet. It would be interesting to collect tweets on the topic you are interested and do some analytics on them.
Cleaning up
Now let’s clean up the indices we have created in this data. You can keep them if you want.
curl -XDELETE heartbeat
curl -XDELETE generator
curl -XDELETE dlq-sample-data
curl -XDELETE dlq-01
curl -XDELETE http-poller-api
curl -XDELETE http-poller-es-health
curl -XDELETE twitter
Conclusion
In this post, we have seen some of the most common and helpful input plugins out there. There are many more input plugins in Logstash’s arsenal, but most of them follow similar patterns of the ones we have seen.


