Introducing the Coralogix CLI: Headless Observability for Every Agent.
Advanced Security: Marking AWS WAF’s Homework

The same security scenarios are checked thoroughly. Privilege escalation, SQL injection, Port scanning and so on. These checks form the bedrock of defensive security, but as solutions become more complex, so too must our capability to detect complex scenarios.
Let’s explore a very complex use case, that ties together multiple Coralogix features, and showcases the power of Coralogix, not just in detecting the simple stuff, but in tracking the most complex scenarios in modern security.
The Use Case
AWS WAF is an extremely powerful platform, with rapid propagation of rules and blazing fast response times. It also offers excellent telemetry, with log documents that describe exactly what it is doing and why. AWS WAF regularly performs actions to prevent malicious behaviour, and it produces a log document that looks a little like this:
{"terminatingRuleId":"Default_Action","responseCodeSent":null,"terminatingRuleType":"REGULAR","ruleGroupList":[...],"terminatingRuleName":"AWSManagedReconnaissanceList","action":"BLOCK","httpRequest":{...}}However, how do we know that AWS WAF has blocked traffic successfully? There are many evasion strategies that modern hackers employ. So, that is our task. To validate that if AWS WAF has “blocked” traffic, it stays blocked!
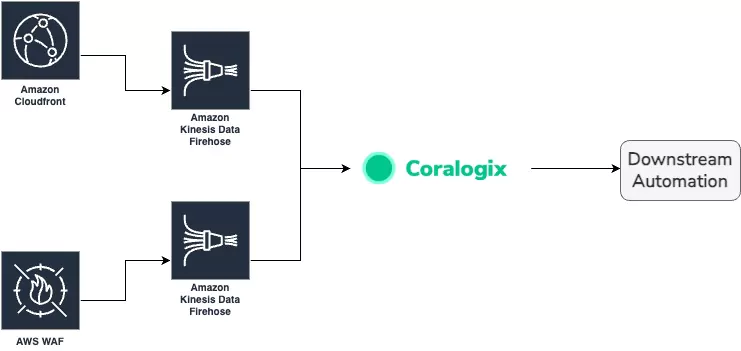
Our Architecture
We’re going to leverage AWS resources integrated into Coralogix. The key components are:
- AWS WAF ACL logs via Firehose
- Cloudfront logs via Firehose
These components feed into a Coralogix account in the following way:
Integration
Step one was to connect the services to Coralogix. This is made very easy by our Integration flow, which natively supports Firehose. In fact, Coralogix has our very own endpoint, right there in the AWS platform.
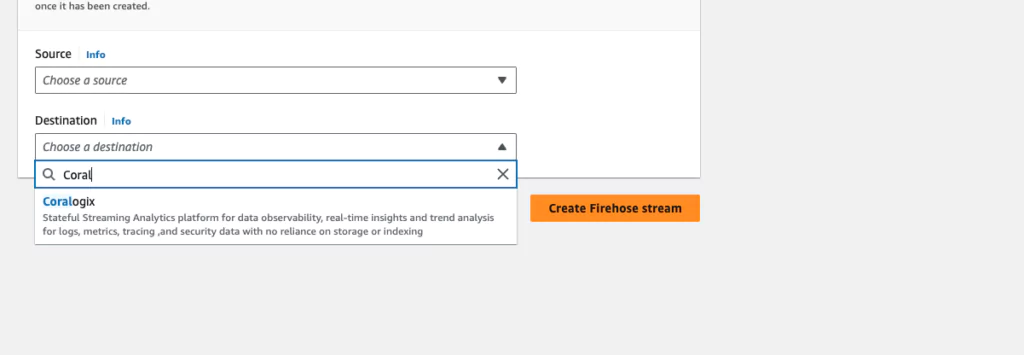
Integrating Coralogix into these services took a few minutes, and logs were flowing into the platform instantly. I reviewed the logs in LiveTail first, to make sure everything looked okay.
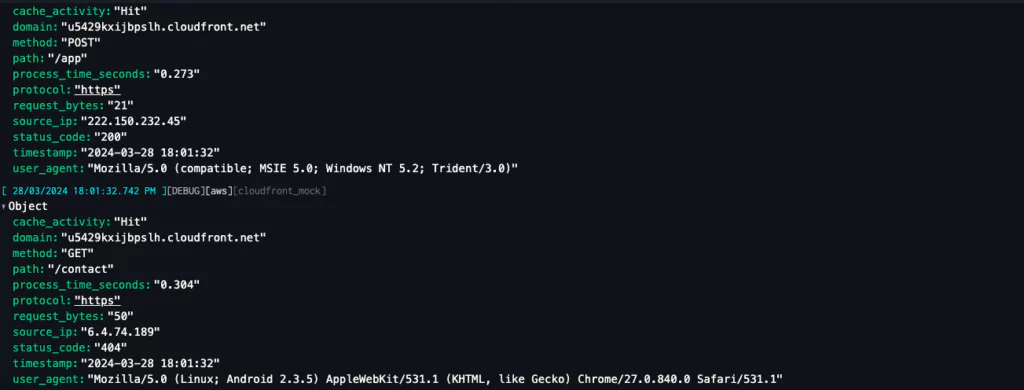
You may notice that these logs don’t look like typical WAF logs. That’s because I deployed a Coralogix Extension and instantly the raw logs into a queryable, easily analysed JSON document.
Enriching the Data
Now the data is in Coralogix, it’s time to add some extra details. There are a few key enrichments we’ll deploy:
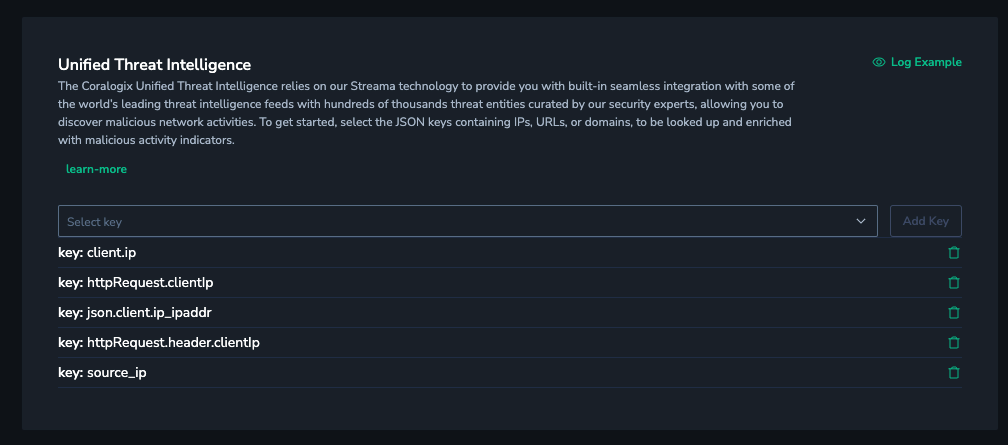
- Unified Threat Intelligence – Any IP address or domain can be automatically searched against dozens of well known threat databases, to find out if this record has been flagged as suspicious by thousands of contributors.
- GeoIP – IP Addresses can also be decorated with continent, country, city, region, latitude and longitude.
It’s worth noting that, thanks to Coralogix’s simple pricing model, these features do not cost anything extra. In Coralogix, you pay only for data volume. Nothing else.
Analysis
Once we have the data, there are some key pieces of information that are consistent across both Cloudfront and WAF logs:
- The Client IP address
- The Path the user was attempting to visit
This presents a good opportunity for joining these two disparate datasets together, and there are a few different ways we can do that.
Defining a Flow Alert
Coralogix Flow Alerts enable customers to join together multiple single alerts into a single, cohesive story. For our use case, we’re going to leverage a combination of Coralogix alerting features:
- Dynamic alerting learns the normal profile of your data, and can notify when something is out of the ordinary.
- Standard alerting, that can count the number of log documents match a given query.
- Grouping, to ensure the whole alert only triggers on the values we’re interested in.
Flow alerts can be built via the UI, meaning you don’t need any coding knowledge, but they can also be deployed via our APIs.
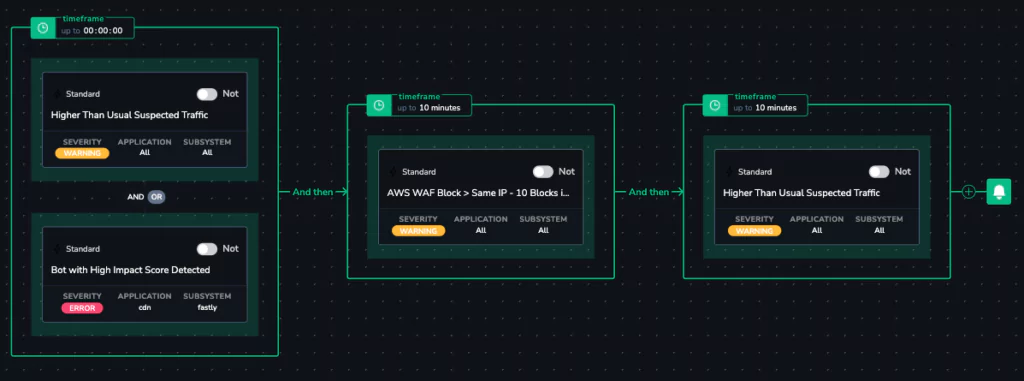
The flow is simple. Suspected traffic is noticed by the system. This can be in the form of suspicious IPs or a bot with a particularly high score. Then, within 10 minutes, AWS WAF indicates that it has issued a series of blocks, to prevent this traffic from continuing. However, within 10 minutes, higher than usual traffic is still detected.
The power of this alarm is that it does not rely on proxy values or adjacent variables. It directly measures the desired outcome. This is the power of Coralogix Flow Alerts.
But how do we know which IP Address?
Thanks to Coralogix grouping functionality, Flow alerts can be grouped on a single key that is available in all the component alerts. In this case, client IP address:
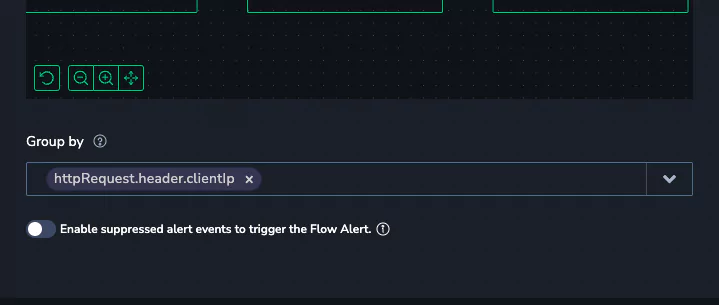
Now, the flow alert will track the activity of a client IP address, across multiple systems, data sources and even alarms.
Building Custom Metrics
Flow Alerts are powerful, but it’s always good to tackle a problem from multiple angles, to ensure good coverage. Coralogix leverages recording rules, which enable customers to combine multiple metrics into a more complex value. But wait, where did the metrics come from?
Events2Metrics – Distilling WAF Logs into their Key Details
Coralogix Events2Metrics are a highly flexible feature in the platform, that converts logs and spans into metrics. Metrics are much more cost effective to retain for a long time, and query performance is typically higher. There are two key metrics we need to build from the logs we have.
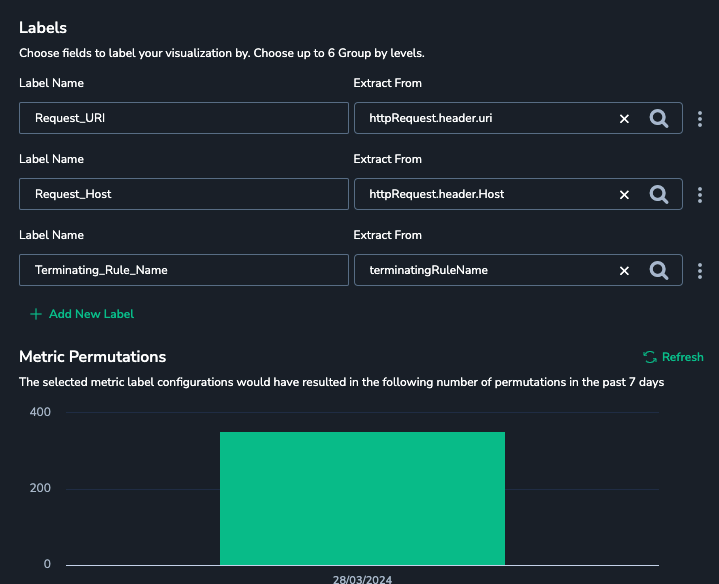
Blocked WAF Traffic
Converting the WAF logs into a document is as easy as selecting the logs, and defining which labels we would like:
Cloudfront Traffic
Another simple metric to define, derived from the cloudfront logs we integrated in step 1.
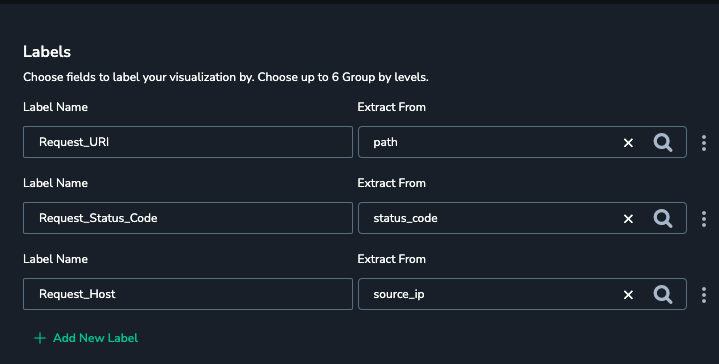
Note: There are some common labels across these metrics. This is important!
Now that we have our metrics, we can correlate them to capture our events, in a new metric called waf_traffic_subverting_acl_rules. This metric is generated by looking at Cloudfront traffic and comparing the IP address and path to WAF block events. When there is a match, the traffic is tracked and the metric is updated.
The Result
Visualizing the metrics in a dashboard is the best way to show off this capability.
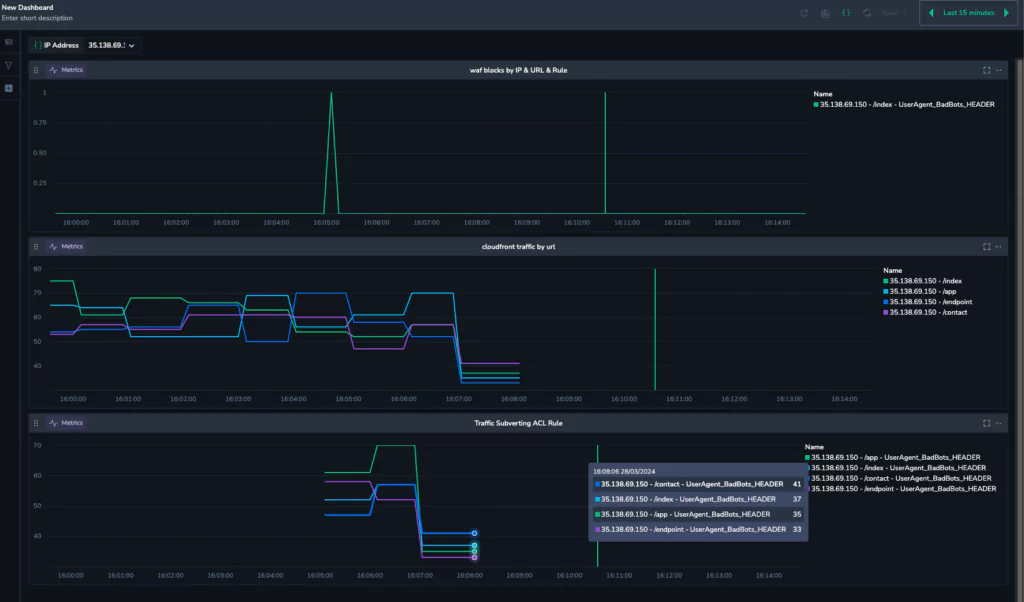
The first graph indicates WAF block activity. We can see at 16:05, AWS WAF has blocked the IP 35.138.69.150. The graph in the middle is the cloudfront traffic for 35.138.69.150, and we can see that even though the block event has happened, the traffic has continued, and this is where our new metric kicks in.
We can see that at 16:05, our new metric kicks in, and immediately begins recording the traffic. This is a metric of traffic that should be blocked. This represents a whole new level of safety, and shows the power of the Coralogix platform.
Consider yourself secure
Coralogix couples beautifully with AWS technology, and this is just another example where the power, scalability and performance of AWS is enhanced by the sophistication of the Coralogix platform.
To find out more, you can check out our Academy, which will give breakdowns of these use cases and much more. Better yet, you can play with the platform yourself, with a free trial!