Introducing the Coralogix CLI: Headless Observability for Every Agent.
AWS CloudWatch Alarms: A Tutorial


Amazon Web Service’s CloudWatch is a service that allows you to monitor and manage deployed applications and resources within your AWS account and region. It contains tools that help you process and use logs from various AWS services to understand, troubleshoot, and optimize deployed services. This article will show you how to get an email when your Lambda logs over a certain number of events.
Setup
To follow this tutorial, you need to set up an AWS account. I have created a Lambda function that logs a random number between 0 and 200 to simulate tracking the number of users subscribing to my system. I used serverless to deploy this lambda function to my AWS account. The Lambda function is triggered by a CloudWatch rule periodically to simulate the number of users subscribed each minute.
CloudWatch Metrics
Tracked AWS service events called Metrics can trigger alarms when the metric exceeds some preset threshold. Many AWS services produce metrics automatically, but you can also create custom metrics to track better precisely what you need in your AWS services. See the CloudWatch User Guide for a list of automatically created metrics.
You can create metric filters using data logged by AWS services such as Lambda. Once a Lambda logs into CloudWatch, you can create a filter based on the data patterns seen for that function. CloudWatch takes the filter and converts data into numerical metrics that can trigger alarms. This article will show you how to create a metric on your logged data to track logged errors.
Step-by-Step: Create a Metric Filter
Let’s walk through how to set up a custom metric filter using CloudWatch logs from a Lambda function. To follow these steps, you must set up a lambda that sends logs to CloudWatch.
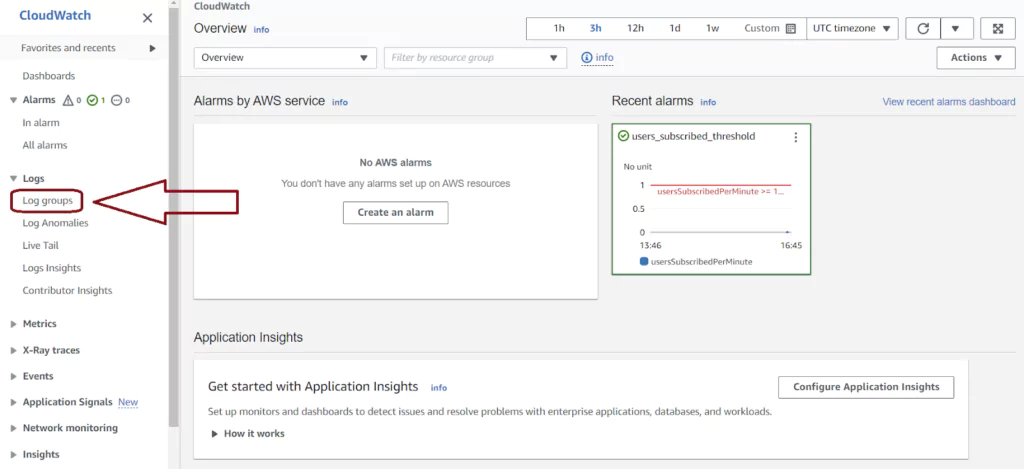
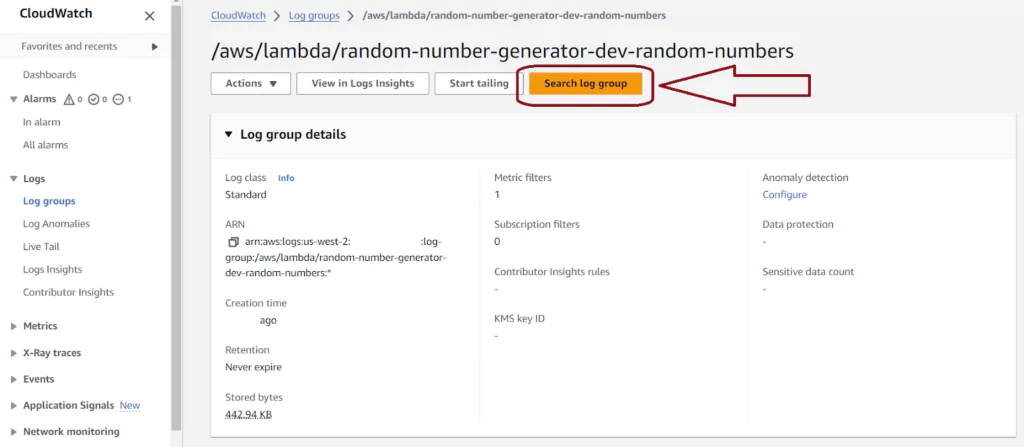
Navigate to the CloudWatch console in AWS. You can find your logs by selecting Log groups from the left vertical menu. The Log groups page has one entry for each Lambda function, ECS function, and any other service instance logging to CloudWatch. Labels in the Log group name indicate the AWS service and instance logging. Click on the Log group name to see the CloudWatch logs from that instance.
The Log streams page for Lambdas shows each Lambda instance. Lambda reuses instances over time, and multiple instances may run in parallel. To see the logs for any instance, click on the blue Log stream name labeled for the first run date. For a time-series view of logs from all Lambda instances, click the orange Search log group button.
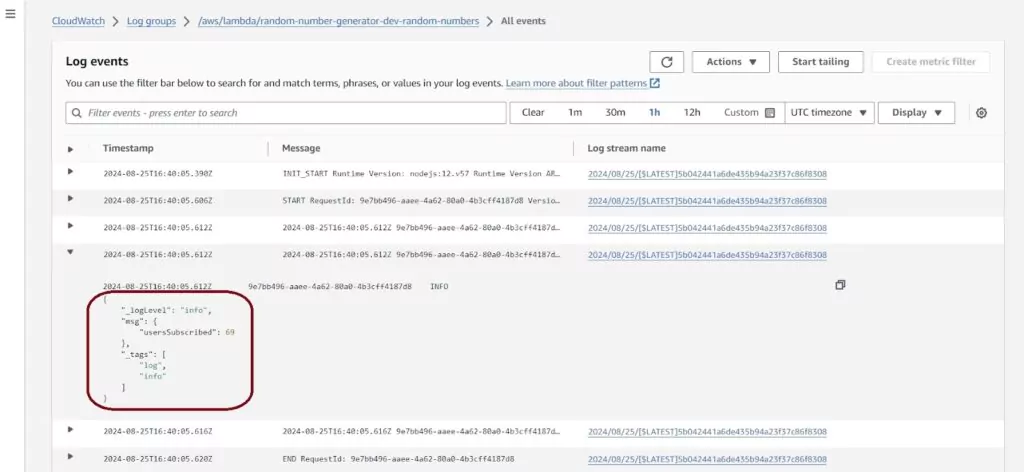
The next Log events page has a list of all the logs present for all time ordered from oldest to most recent. You can keep scrolling down to load more logs if you have more records than will fit on the page. You can also time-filter the CloudWatch logs using the top horizontal menu. Filters can be relative or fixed. Here I have logs that I will use for my metric: keeping track of the usersSubscribed value.
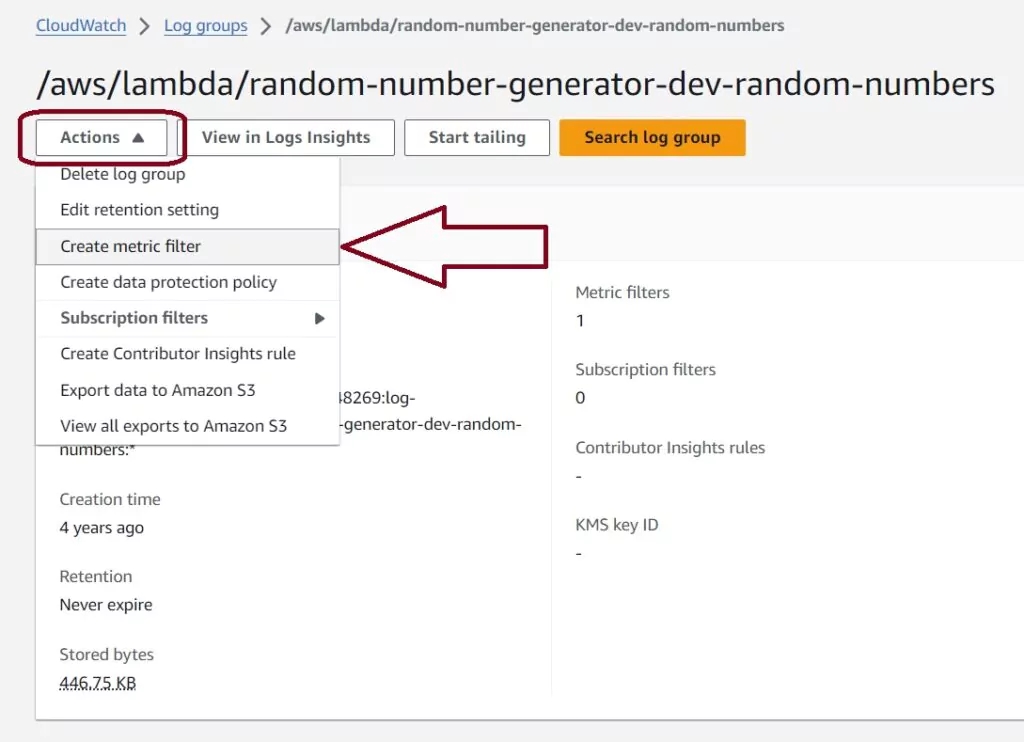
To create a metric filter, you can go back to the main log page for this Lambda and select actions and Create Metric Filter. This will lead to a page that allows us to create a new filter. Another option is to type the filter into the search bar in the Log events page.
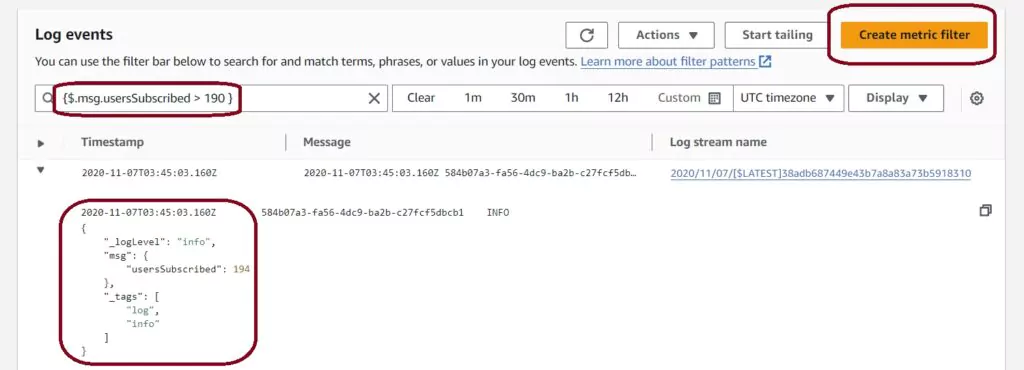
Now we want to make a useful search for our logs. Find details on the syntax used on the AWS Filter and Pattern Syntax page. I will create a metric filter based on the random number generated; I only show logs where usersSubscribed are more than 190. The filter configuration that does this for my log looks like this:
{$.msg.usersSubscribed > 190}
Once the filter is preset, the Create Metric Filter button turns orange, allowing us to create our metric filter. The search can be applied on this page as well so we can ensure the filter is working for the expected events.
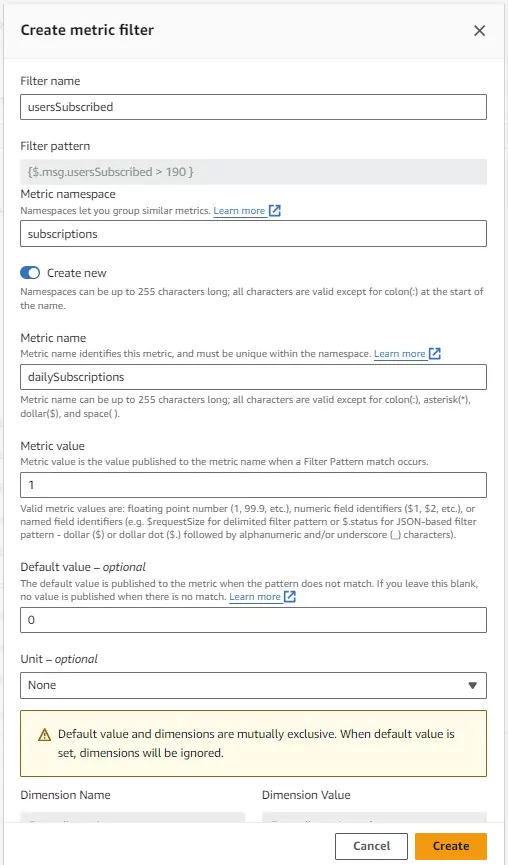
After pressing the Create Metric Filter button, a pop-up will appear, allowing the setup of the metric filter configuration. The filter expression is automatically transcribed. I have selected the filter name, metric name, and metric namespace. The metric namespace allows isolation of logs from one another so that aggregations don’t accidentally include invalid data.
When the filter returns a valid log, the metric value specified here logs into the metric. In this case I chose to show a value of 1 when my usersSubscribed value is greater than 190 and show 0 otherwise.
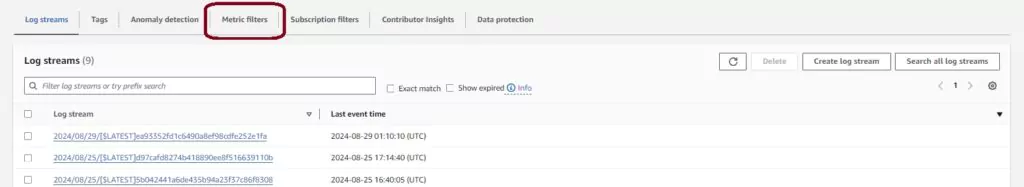
After creating the metric filter, you can view and edit its configuration in the Metric Filters tab in the CloudWatch logs.
CloudWatch Alarms
Once you have created or chosen your metric, you can create an alarm from it. You can set up alarms using AWS CloudFormation, the AWS CLI, or the AWS console. Alarms can subsequently produce an AWS EC2 action, execute an AWS Auto Scaling Action, or send a notification to an AWS SNS topic.
Below are the steps to create an alarm that will send an email when the metric detects a value higher than my limit. When the alarm is triggered, it will send the owner an email about the issue.
Step-by-Step: Create a CloudWatch Alarm
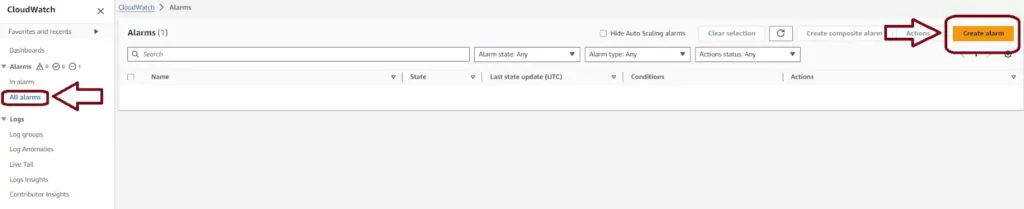
Login to your AWS account and navigate to the AWS CloudWatch console. On this page, you choose the Alarms menu item from the left-hand menu, then press the orange Create Alarm button in the navigation pane.
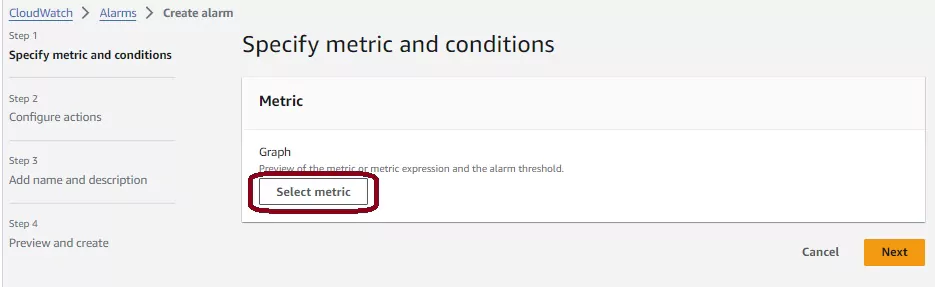
Next, AWS will take you to a page with a simple step-by-step process for creating your alarm after pressing the Create alarm button. There are four steps to complete.
First, you need to select which metric should trigger the alarm. Press the white Select metric button to configure this.
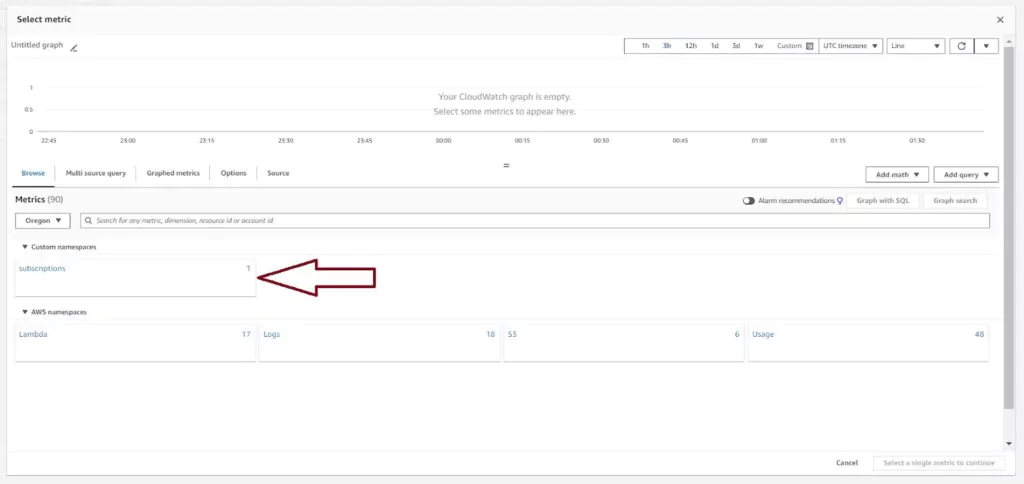
The Select metric page has all options available for alarms present including default metrics created by AWS. For Lambdas, this includes metrics like throttle rates, errors, and invocation counts. Most AWS services have some default metrics available here.
Since I have created a custom metric filter in the previous section, I will select that metric to use for the alarm. Custom metrics are listed under the custom namespace we created in the CloudWatch Metrics section. Click on subscriptions and then on Metrics with no dimensions to find the previously created filter named usersSubscribed per minute.
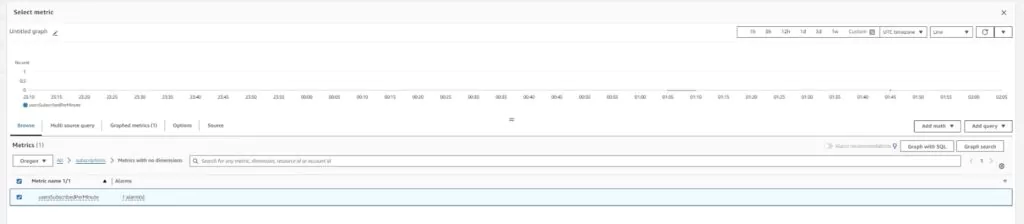
The setup of the Graphed metric defaults to showing the average of the metric value over 5 minute periods. The metric is logging a 1 when the number of users subscribed is more the 190 and is logging 0 when the number of users subscribed is less. The graph shows the metric’s output for a configurable period to show the metric’s logging behavior. With the graph set up to support my wanted alarm, press Select metric.
The next page, titled Specify metric and conditions, sets up the metric’s configuration and the Conditions to trigger the alarm. In this case, the average is not useful for the alarm, so it uses the Maximum statistic. There are many other statistics to choose from in the drop down menu. Also, since I expect to receive data each minute on this statistic, I changed the Period to 1 Minute. In the Conditions section, we choose whether to use Static or Anomaly detection triggers. Static triggers will cause an alarm by comparing the metric data to some value. Anomaly detection triggers use CloudWatch machine learning algorithms to analyze metrics and trigger an alarm when it sees behavior outside of the norm.
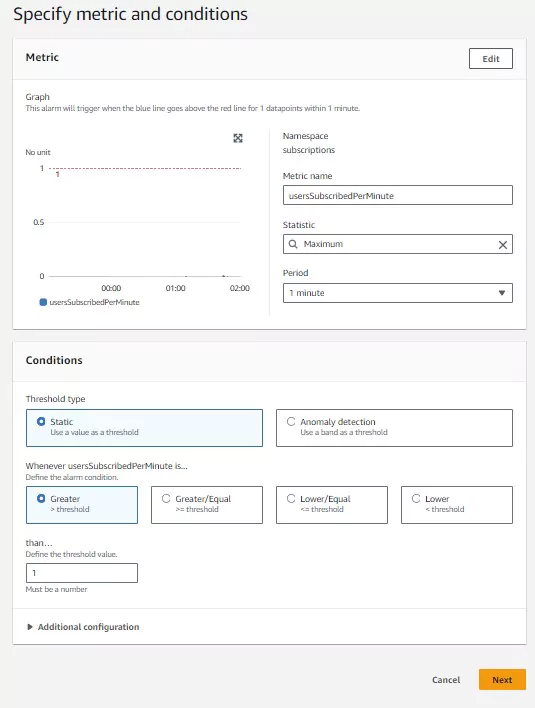
This alarm will trigger on static conditions whenever more than 190 users subscribe within 1 minute. Since my metric logs a value of 1 in that event, I set my static condition to trigger when the usersSubscriptionPerMinute metric is greater than or equal to 1. Once the configuration is complete, click next.
Next, we will configure the actions the alarm will take once it is triggered. There are five different action options and each is discussed below.
Once I create all the actions I want to occur, I complete the alarm’s creation by pressing the orange Create alarm button.
1. Send a Notification Action Using an SNS Topic
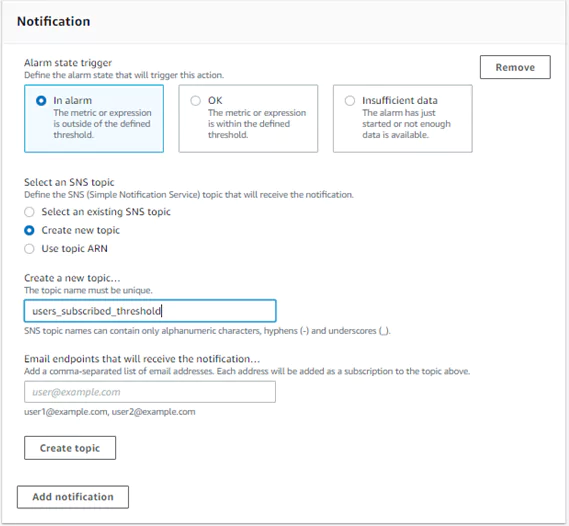
To configure a notification action, we first need to choose when actions should occur. The action could occur when the metric is in an alarm state, when the metric is not is an alarm state, or when the alarm has insufficient data to determine the alarm state.
I have chosen to have my alarm state trigger an action when the metric is in an alarm state. The action will proceed whenever more than 190 users have subscribed at a time.
If you do not already have an SNS topic setup, you can create one from this page. You need to name your topic and insert an email address to use when alarm actions are triggered.
View the new SNS topic on the Amazon SNS page under the topics section. The name should appear as specified. Click on the topic to view more details and edit the topic.
Editing the topic allows you to add or change the email addresses used in the SNS topic. SNS will list the email addresses as unconfirmed until the email’s owner follows the confirmation link sent to that email. If the alarm is triggered, unconfirmed emails will not receive the notification.
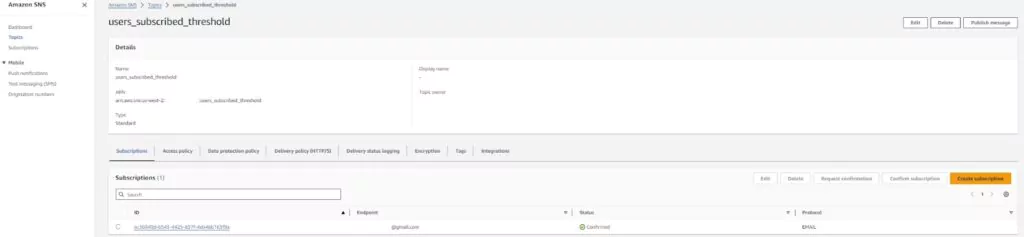
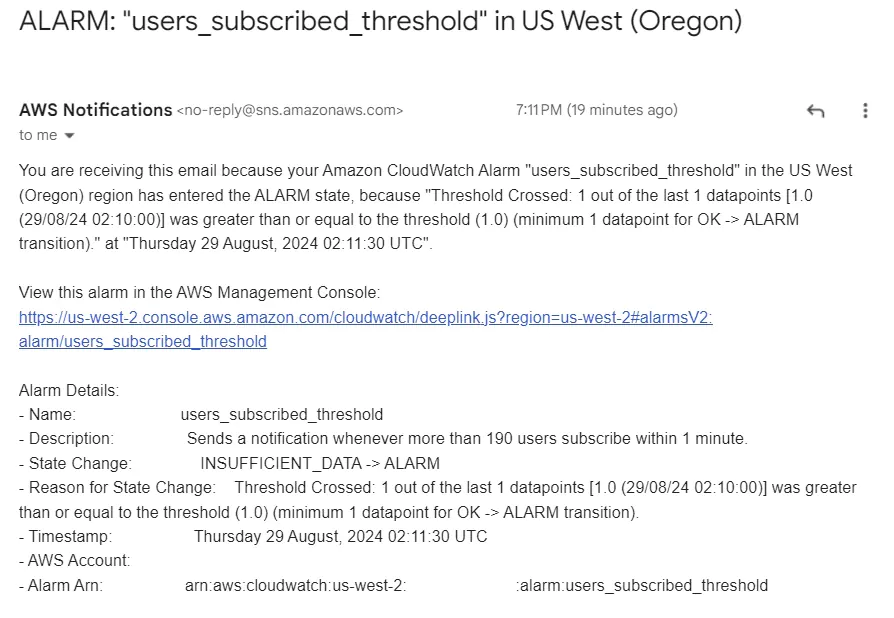
When an alarm is triggered, confirmed emails will receive an email notifying them of the event(s). The email contains crucial information that the user may want to take action on.
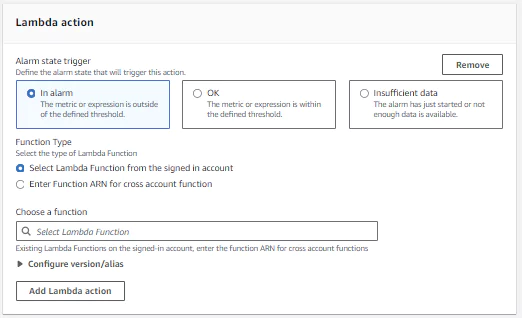
2. Lambda action
To configure a Lambda action, first determine which state should trigger the Lambda. Next determine which Lambda should be triggered. The input to the Lambda will contain event data and can be used in the Lambda logic.
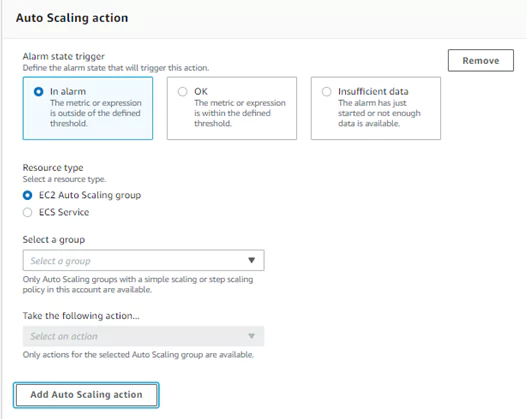
3. Auto Scaling action
To configure an auto-scaling action, first determine when the alarm state should trigger the action. These are the same options as provided in sending an SNS notification (above). Next, choose which resource type to scale between an EC2 Auto Scaling group and an ECS service. You must configure the ECS and EC2 instances separately before you can use them in an alarm. In each case, the alarm will trigger more EC2 instances within the set group or start more ECS tasks, respectively, to run.
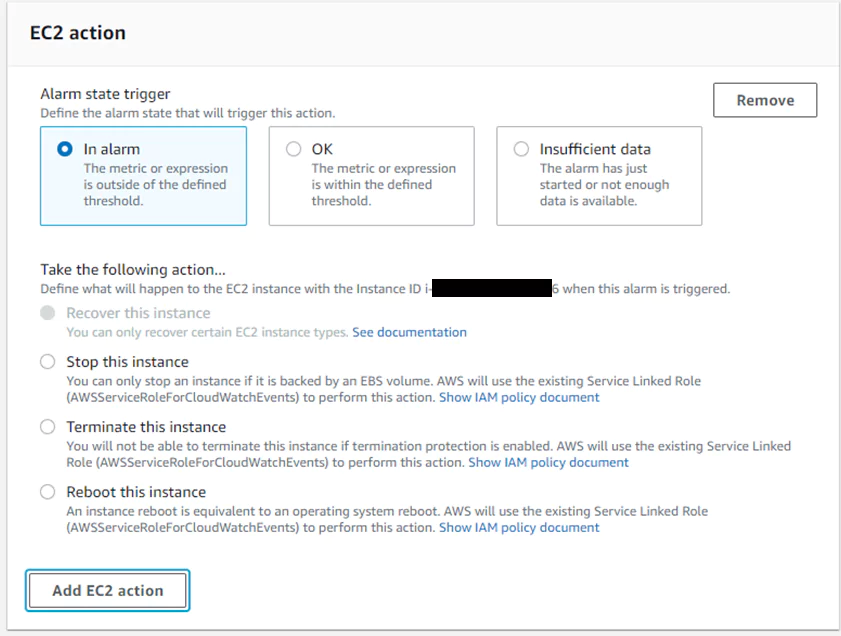
4. Take an EC2 Action
Use alarms to terminate, to reboot, or to recover EC2 instances. Since a lambda triggers this alarm, I will not use this option here. If the metric used in the alarm is anything other than an EC2 per-instance metric, this option is not available. If you have that metric configured, the menu will appear as in the image below to select which action is required.
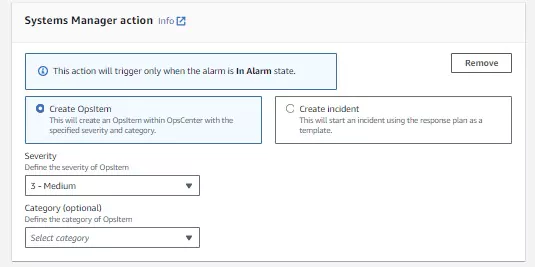
5. Systems Manager action
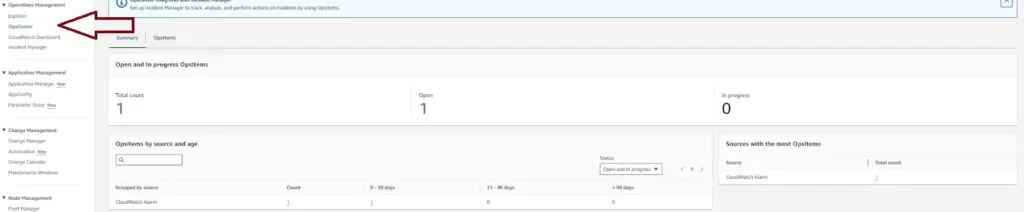
There are two options within Systems manager actions: create and OpsItem or create an incident.
OpsItem actions create event logs for sys-ops data. If the metric used for the CloudWatch alarm is tracking cost or performance, this action will log an event when those values reach a certain level. I will trigger a Cost event log with this configuration when the cost’s severity with this configuration is only considered medium. This will allow me to intervene before my price is beyond my budget.
Creating an incident will trigger a pre-made response plan. These plans are created in the Incident Manager service in AWS first and then can be linked to actions required for certain metrics.
OpsItem Logs are found on the Systems Manager page of the AWS console. Click on OpsCenter in the left vertical menu to see the list of configured alarms.