AWS Lambda Telemetry API: Enhanced Observability with Coralogix AWS Lambda Telemetry Exporter

AWS recently introduced a new Lambda Telemetry API giving users the ability to collect logs, metrics, and traces for analysis in AWS services like Cloudwatch or a third-party observability platform like Coralogix. It allows for a simplified and holistic collection of AWS observability data by providing Lambda extensions access to additional events and information related to the Lambda platform.
Leveraging the release of the AWS Lambda Telemetry API, we have built a newly optimized Lambda extension called Coralogix AWS Lambda Telemetry Exporter to further streamline the collection of logs, metrics, and traces for monitoring, alerting, and correlation in the Coralogix platform.
This post will discuss the benefits of using the new AWS Lambda Telemetry API and cover use cases for leveraging your telemetry data to get you started.
Benefits of New AWS Telemetry API
Prior to the launch of AWS Lambda Telemetry API, Coralogix built an AWS Lambda Extension which collects logs using the AWS Lambda Logs API.
With the launch of AWS’s Lambda Telemetry API, we are now able to support simplified instrumentation for logs, platform traces, and platform metrics with enhanced observability for your Lambda execution environment lifecycle. The Telemetry API provides deeper insights into your Lambda environment with support for new platform metrics and traces.
Getting Started with Coralogix AWS Lambda Telemetry Exporter
The Coralogix AWS Lambda Telemetry Exporter is now available as an open beta. You can deploy it from the AWS Serverless Application Repository.
If you have previously used the Coralogix AWS Lambda Extension the deployment process is very similar. You can use the Coralogix AWS Lambda Telemetry Exporter as a richer replacement for the Coralogix AWS Lambda Extension. You will need to adjust the configuration!
For more information about the Coralogix AWS Lambda Telemetry Exporter visit our documentation.
Enhanced Observability Use Case
Unlike its predecessor, Coralogix AWS Lambda Telemetry Exporter augments logs from Lambda functions with a span ID, making it easier to analyze related logs and traces in the Coralogix platform.
Observing Lambda Latency
A major benefit of the AWS Lambda Telemetry API is that it provides additional information about the initialization of the AWS Lambda execution environment and other valuable performance indicators. We can collect that information with the Coralogix AWS Lambda Telemetry Exporter and use Coralogix tracing features to better understand latency of Lambda functions.
Example: Cold start of Java Lambda
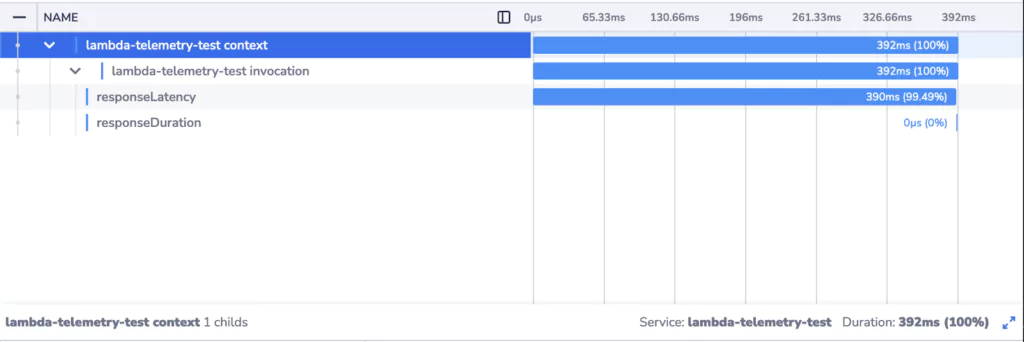
Let’s review an example of a Lambda function written in Java. Typical response times of that function vary between 300ms and 1500ms. We can get a better understanding of what’s happening by looking at the traces.
Trace of a warm start Lambda function invocation:

Trace of a cold start Lambda function invocation:

We can clearly see that when a new Lambda instance is initialized, the response times are much higher. There’s an additional element in the trace corresponding to initialization of the Lambda execution environment. The effect of waiting for the initialization to complete is compounded by the fact that the invocation is itself slower.
Knowing that this is a fresh Lambda instance helps us understand why. The first invocation of the function involves initialization of the function code and dependencies. Platforms utilizing Just-In-Time compilation (Java/JVM being an example of such a platform) in particular will experience longer durations for the first invocation.
Visibility into the initialization process provided by Telemetry API enables you to be better prepared to deal with cold start invocations of your Lambda functions and more quickly detect and address abnormal latency and performance issues.
To get started, visit our documentation.


