The new standard of observability is here. Discover Olly, the industry’s first
How Cloudflare Logs Provide Traffic, Performance, and Security Insights with Coralogix

Cloudflare secures and ensures the reliability of your external-facing resources such as websites, APIs, and applications. It protects your internal resources such as behind-the-firewall applications, teams, and devices. This post will show you how Coralogix can provide analytics and insights for your Cloudflare log data – including traffic, performance, and security insights.
To get all Cloudflare dashboards and alerts, follow the steps described below or contact our support on our website/in-app chat. We reply in under 2 minutes!
Cloudflare Logs
Cloudflare provides detailed logs of your HTTP requests. Use these logs to debug or to identify configuration adjustments that can improve performance and security. You can leverage your rich Cloudflare log data through Coralogix’s User-defined Alerts and Data Dashboards to instantly discover trends and patterns within any given metric of your application-clients ecosystem, spot potential security threats, and get a real-time notification on any event that you might want to observe. Eventually, getting better Cloudflare monitoring experience and capabilities from your data, with minimum effort.
To start shipping your Cloudflare logs to Coralogix, follow this simple tutorial.
Cloudflare Dashboards
Once you’ve started shipping your Cloudflare logs to Coralogix, you can immediately extract insights and set up dashboards to visualize your data.
All Cloudflare logs are JSON logs. Based on a field or many fields, you may define your visualization(s) and gather them in a dashboard(s). The options are practically limitless and you may create any visualization you can think of as long as your logs contain that data you want to visualize. For more information, visit our Kibana tutorial.
There are nine out-of-the-box dashboards that are ready to use. You may import them with the following steps:
- Download the cloudflare_export.ndjson.zip file and save it locally.
- Unzip the file.
- Open cloudflare_export.ndjson with a text editor and replace all occurrences of *:index_pattern_newlogs* with your default pattern, for example: *:1111_newlogs*. By default, the index_pattern will be your company ID.
- Save the file.
- Login to Coralogix and click the Kibana button.
- Choose Management -> Saved Objects
- Click the Import button.
- Click the Import text in the section below Please select a file to import.
- Choose the cloudflare_export.ndjson file.
- Click the Import button at the bottom.
Notes:
- Some visualization may not be available if you didn’t specify them during Cloudflare Push Log Service configuration.
- If you want to be able to use visualizations where the country name field is used then you need to enable Geo Enrichment on the ClientIP key. Click here for more information or ping us on the chat to enable it for you
- If your application name is other than Cloudflare then you need to adjust the saved search filter “Saved Search – Cloudflare”.
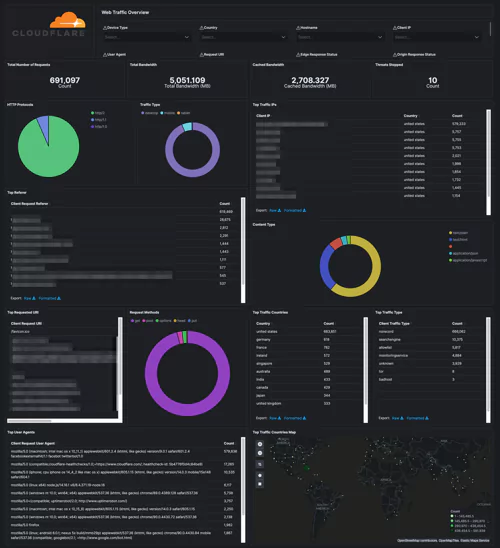
Cloudflare – Snapshot
This is the main dashboard where you can take a look at your traffic. There are statistics about the total number of requests, bandwidth, cached bandwidth, threats, HTTP protocols, traffic types, and much more general information.
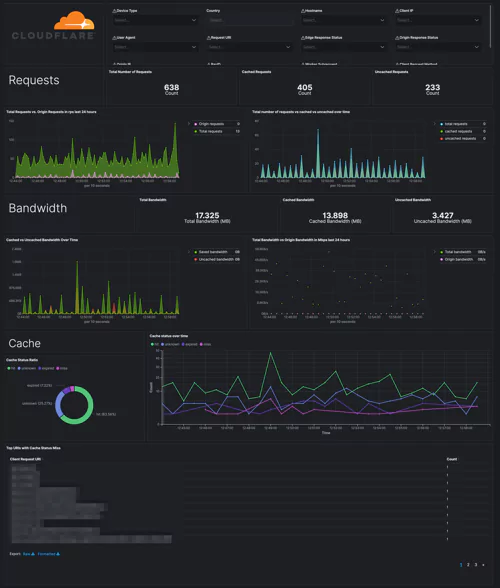
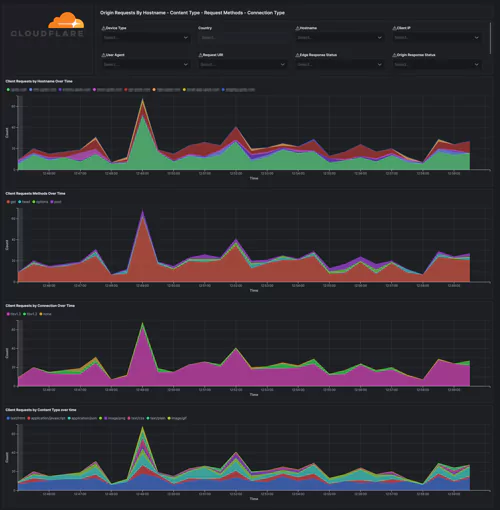
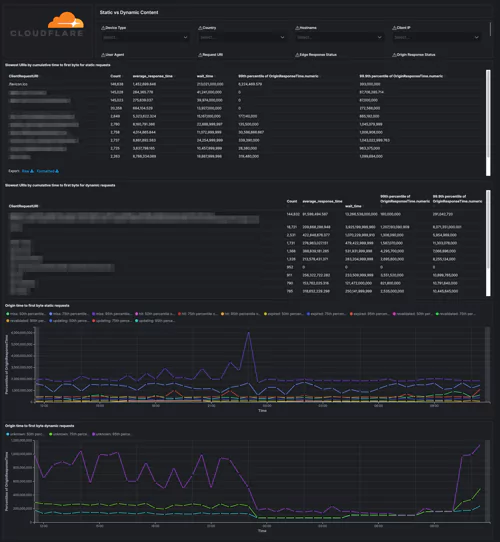
Cloudflare – Performance (Requests, Bandwidth, Cache), Cloudflare – Performance (Hostname, Content Type, Request Methods, Connection Type), Cloudflare – Performance (Static vs. Dynamic Content)
Monitor the performance – get details on the traffic. Identify and address performance issues and caching misconfigurations. Get your most popular hostnames, most requested content types, request methods, connection type, and your static and dynamic content, including the slowest URLs.
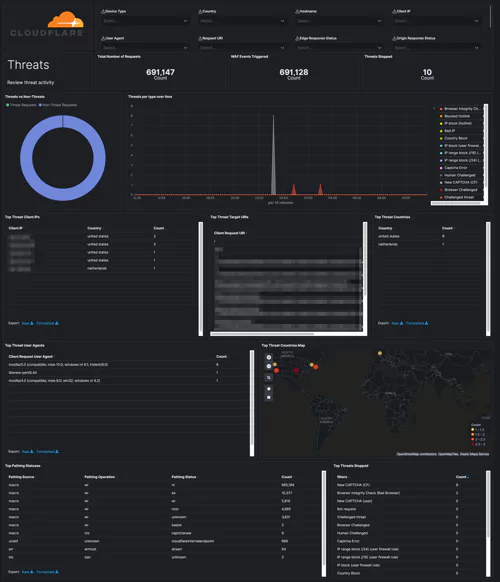
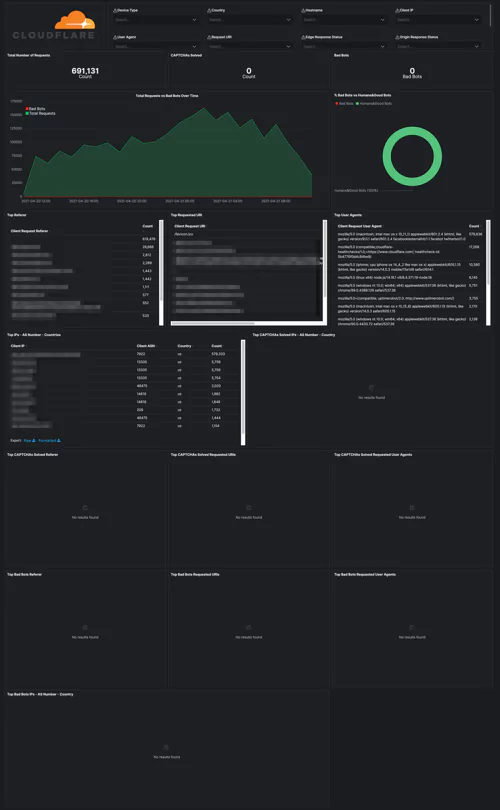
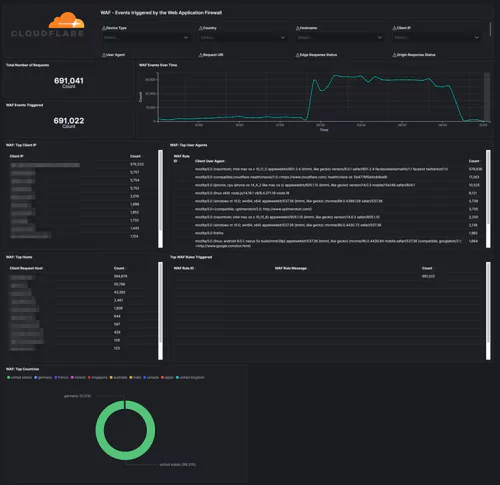
Cloudflare – Security (Overview), Cloudflare – Security (WAF), Cloudflare – Security (Rate Limiting), Cloudflare – Security (Bot Management)
Security dashboards let you track threats to your website/applications over time and per type/country. Web Application Firewall events will help you tune the firewall and prevent false positives. Rate Limiting protects against denial-of-service attacks, brute-force login attempts, and other types of abusive behavior targeting the application layer.
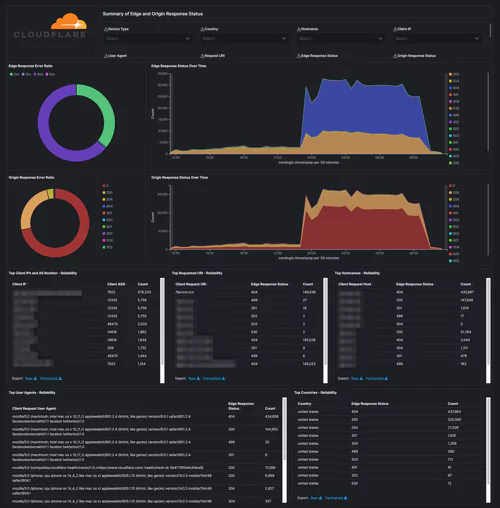
Cloudflare – Reliability
Get insights into the availability of your websites and applications. Metrics include origin response error ratio, origin response status over time, percentage of 3xx/4xx/5xx errors over time, and more.
Alerts
The user-defined alerts in Coralogix enable you to obtain real-time insights based on the criteria of your own choosing. Well-defined alerts will allow you and your team to be notified about changes in your website/applications. Here are some examples of alerts we created using Cloudflare HTTP Requests data.
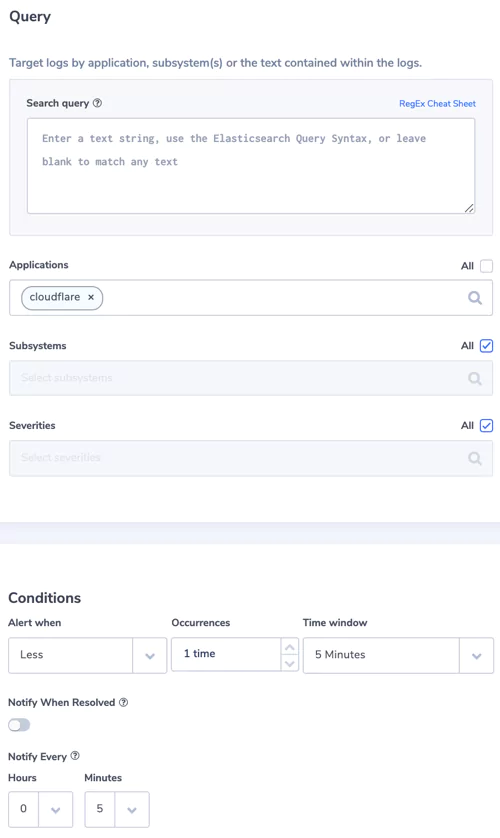
1. No logs from Cloudflare
When Cloudflare stops sending logs for some reason, it is important for us to be notified.
Alert Filter: set a filter on the application name that represents your Cloudflare logs. In my case, we named it cloudflare.
Alert Condition: less than 1 time in 5 minutes
2. Bad Bots
Be notified about a high volume of bot requests
Alert Filter:
– Search Query: EdgePathingSrc.keyword:”filterBasedFirewall” AND EdgePathingStatus.keyword:”captchaNew”
– Applications: cloudflare
Alert Condition: more than 3 times in 5 minutes
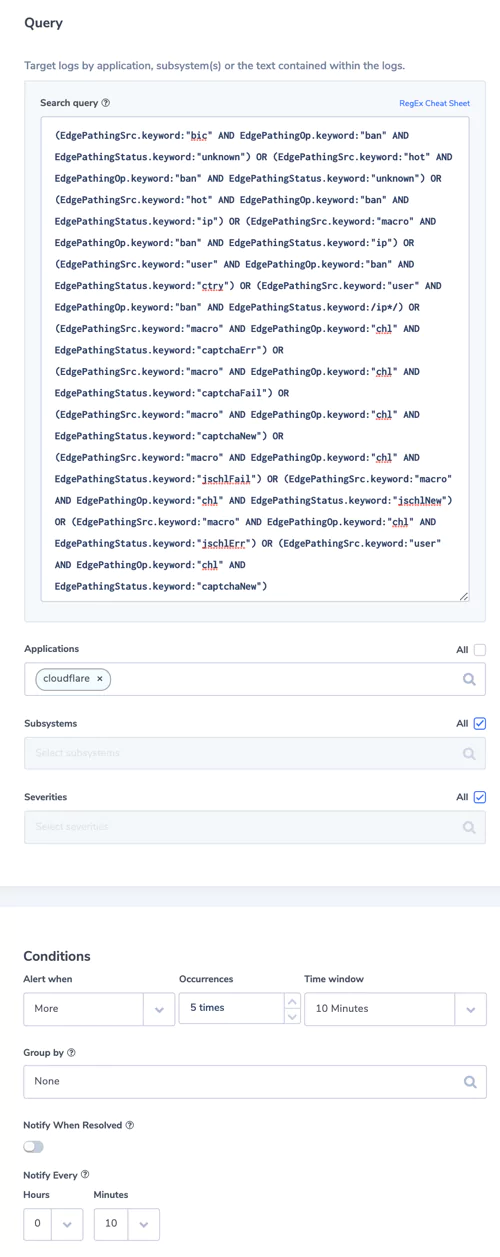
3. Threats Stopped
Be notified about the threats which were stopped.
Alert Filter:
– Search Query: (EdgePathingSrc.keyword:”bic” AND EdgePathingOp.keyword:”ban” AND EdgePathingStatus.keyword:”unknown”) OR (EdgePathingSrc.keyword:”hot” AND EdgePathingOp.keyword:”ban” AND EdgePathingStatus.keyword:”unknown”) OR (EdgePathingSrc.keyword:”hot” AND EdgePathingOp.keyword:”ban” AND EdgePathingStatus.keyword:”ip”) OR (EdgePathingSrc.keyword:”macro” AND EdgePathingOp.keyword:”ban” AND EdgePathingStatus.keyword:”ip”) OR (EdgePathingSrc.keyword:”user” AND EdgePathingOp.keyword:”ban” AND EdgePathingStatus.keyword:”ctry”) OR (EdgePathingSrc.keyword:”user” AND EdgePathingOp.keyword:”ban” AND EdgePathingStatus.keyword:/ip*/) OR (EdgePathingSrc.keyword:”macro” AND EdgePathingOp.keyword:”chl” AND EdgePathingStatus.keyword:”captchaErr”) OR (EdgePathingSrc.keyword:”macro” AND EdgePathingOp.keyword:”chl” AND EdgePathingStatus.keyword:”captchaFail”) OR (EdgePathingSrc.keyword:”macro” AND EdgePathingOp.keyword:”chl” AND EdgePathingStatus.keyword:”captchaNew”) OR (EdgePathingSrc.keyword:”macro” AND EdgePathingOp.keyword:”chl” AND EdgePathingStatus.keyword:”jschlFail”) OR (EdgePathingSrc.keyword:”macro” AND EdgePathingOp.keyword:”chl” AND EdgePathingStatus.keyword:”jschlNew”) OR (EdgePathingSrc.keyword:”macro” AND EdgePathingOp.keyword:”chl” AND EdgePathingStatus.keyword:”jschlErr”) OR (EdgePathingSrc.keyword:”user” AND EdgePathingOp.keyword:”chl” AND EdgePathingStatus.keyword:”captchaNew”)
– Applications: cloudflare
Alert Condition: more than 5 times in 10 minutes
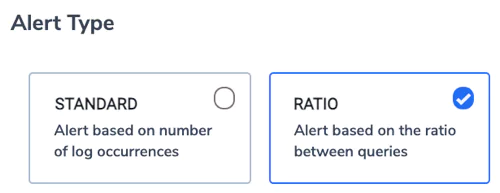
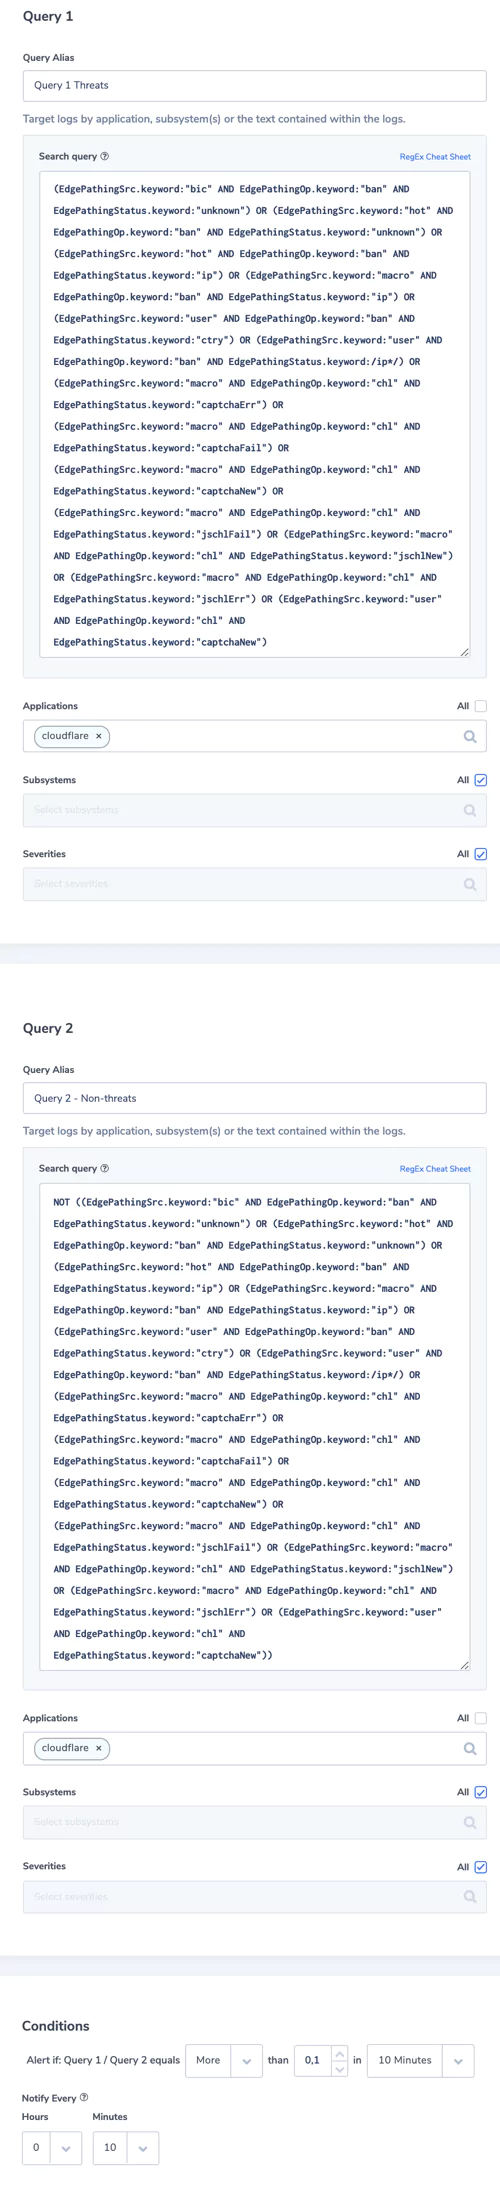
4. Threats vs Non-Threats ratio
Be notified if there are more than 10% of threats comparing to non-threats requests
Alert type: Ratio
Alert Filter:
– Search Query 1: (EdgePathingSrc.keyword:”bic” AND EdgePathingOp.keyword:”ban” AND EdgePathingStatus.keyword:”unknown”) OR (EdgePathingSrc.keyword:”hot” AND EdgePathingOp.keyword:”ban” AND EdgePathingStatus.keyword:”unknown”) OR (EdgePathingSrc.keyword:”hot” AND EdgePathingOp.keyword:”ban” AND EdgePathingStatus.keyword:”ip”) OR (EdgePathingSrc.keyword:”macro” AND EdgePathingOp.keyword:”ban” AND EdgePathingStatus.keyword:”ip”) OR (EdgePathingSrc.keyword:”user” AND EdgePathingOp.keyword:”ban” AND EdgePathingStatus.keyword:”ctry”) OR (EdgePathingSrc.keyword:”user” AND EdgePathingOp.keyword:”ban” AND EdgePathingStatus.keyword:/ip*/) OR (EdgePathingSrc.keyword:”macro” AND EdgePathingOp.keyword:”chl” AND EdgePathingStatus.keyword:”captchaErr”) OR (EdgePathingSrc.keyword:”macro” AND EdgePathingOp.keyword:”chl” AND EdgePathingStatus.keyword:”captchaFail”) OR (EdgePathingSrc.keyword:”macro” AND EdgePathingOp.keyword:”chl” AND EdgePathingStatus.keyword:”captchaNew”) OR (EdgePathingSrc.keyword:”macro” AND EdgePathingOp.keyword:”chl” AND EdgePathingStatus.keyword:”jschlFail”) OR (EdgePathingSrc.keyword:”macro” AND EdgePathingOp.keyword:”chl” AND EdgePathingStatus.keyword:”jschlNew”) OR (EdgePathingSrc.keyword:”macro” AND EdgePathingOp.keyword:”chl” AND EdgePathingStatus.keyword:”jschlErr”) OR (EdgePathingSrc.keyword:”user” AND EdgePathingOp.keyword:”chl” AND EdgePathingStatus.keyword:”captchaNew”)
-Search Query 2: NOT ((EdgePathingSrc.keyword:”bic” AND EdgePathingOp.keyword:”ban” AND EdgePathingStatus.keyword:”unknown”) OR (EdgePathingSrc.keyword:”hot” AND EdgePathingOp.keyword:”ban” AND EdgePathingStatus.keyword:”unknown”) OR (EdgePathingSrc.keyword:”hot” AND EdgePathingOp.keyword:”ban” AND EdgePathingStatus.keyword:”ip”) OR (EdgePathingSrc.keyword:”macro” AND EdgePathingOp.keyword:”ban” AND EdgePathingStatus.keyword:”ip”) OR (EdgePathingSrc.keyword:”user” AND EdgePathingOp.keyword:”ban” AND EdgePathingStatus.keyword:”ctry”) OR (EdgePathingSrc.keyword:”user” AND EdgePathingOp.keyword:”ban” AND EdgePathingStatus.keyword:/ip*/) OR (EdgePathingSrc.keyword:”macro” AND EdgePathingOp.keyword:”chl” AND EdgePathingStatus.keyword:”captchaErr”) OR (EdgePathingSrc.keyword:”macro” AND EdgePathingOp.keyword:”chl” AND EdgePathingStatus.keyword:”captchaFail”) OR (EdgePathingSrc.keyword:”macro” AND EdgePathingOp.keyword:”chl” AND EdgePathingStatus.keyword:”captchaNew”) OR (EdgePathingSrc.keyword:”macro” AND EdgePathingOp.keyword:”chl” AND EdgePathingStatus.keyword:”jschlFail”) OR (EdgePathingSrc.keyword:”macro” AND EdgePathingOp.keyword:”chl” AND EdgePathingStatus.keyword:”jschlNew”) OR (EdgePathingSrc.keyword:”macro” AND EdgePathingOp.keyword:”chl” AND EdgePathingStatus.keyword:”jschlErr”) OR (EdgePathingSrc.keyword:”user” AND EdgePathingOp.keyword:”chl” AND EdgePathingStatus.keyword:”captchaNew”))
– Applications: cloudflare
Alert Condition: Alert if Query 1 / Query 2 equals more than 0.1 in 10 minutes
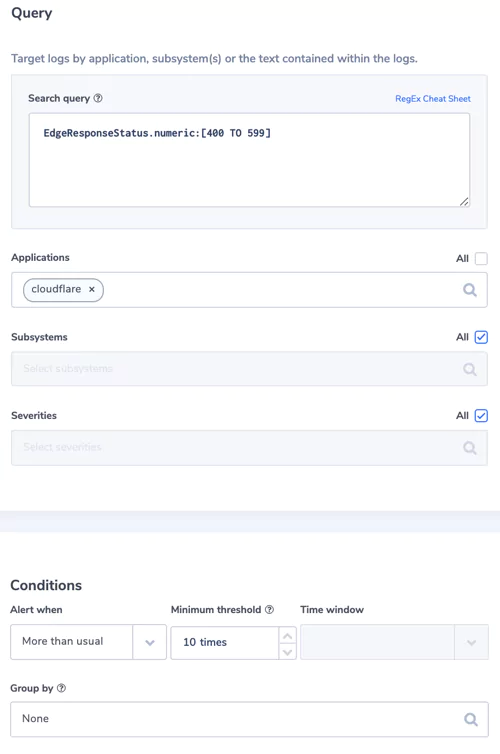
5. EdgeResponseStatus: more 4xx or 5xx than usually
EdgeResponseStatus field provides the HTTP status code returned by Cloudflare to the client
Alert Filter:
– Search Query: EdgeResponseStatus.numeric:[400 TO 599]
– Applications: cloudflare
Alert Condition: more than usual with threshold 10 times
6. OriginResponseStatus more 4xx and 5xx than usually
OriginResponseStatus field is the HTTP status returned by the origin server
Alert Filter:
– Search Query: OriginResponseStatus.numeric:[400 TO 599]
– Applications: cloudflare
Alert Condition: more than usual with threshold 10 times
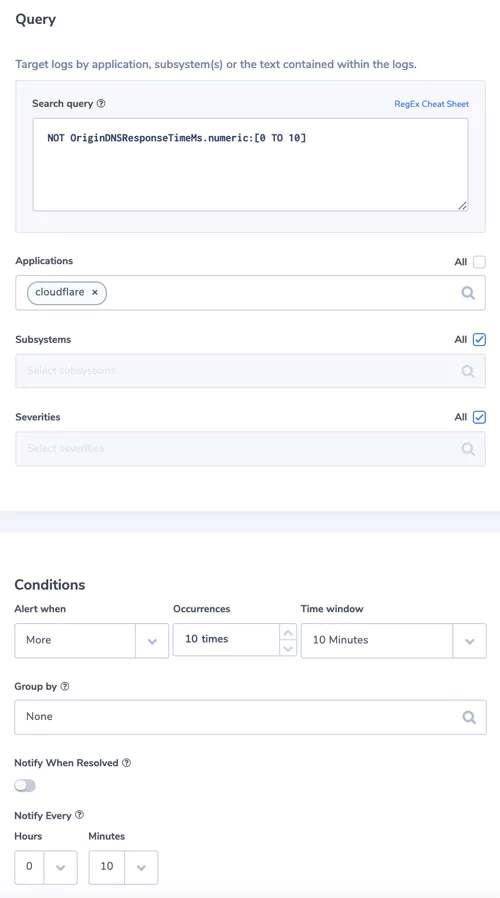
7. Longer DNS response time
Time taken to receive a DNS response for an origin name. Usually 0, but maybe longer if a CNAME record is used.
Alert Filter:
– Search Query: NOT OriginDNSResponseTimeMs.numeric:[0 TO 10]
– Applications: cloudflare
Alert Condition: more than 10 times in 10 minutes