AWS re:Invent 2024: Discover the latest & greatest from Coralogix

As we gear up for AWS re:Invent this December, we’re excited to share some of the latest innovations that make our platform stand out. Coralogix continues to evolve with powerful new capabilities designed to simplify observability, improve performance monitoring, and deliver actionable insights across your systems. From advanced visualization tools to AI-powered troubleshooting, these updates reflect our commitment to empowering teams with smarter, faster ways to solve complex challenges.
We’ll be showcasing all these features and more at Booth #728, but here’s your first look at what’s new and how it can transform your observability strategy.
Work smarter with AI-driven observability for all
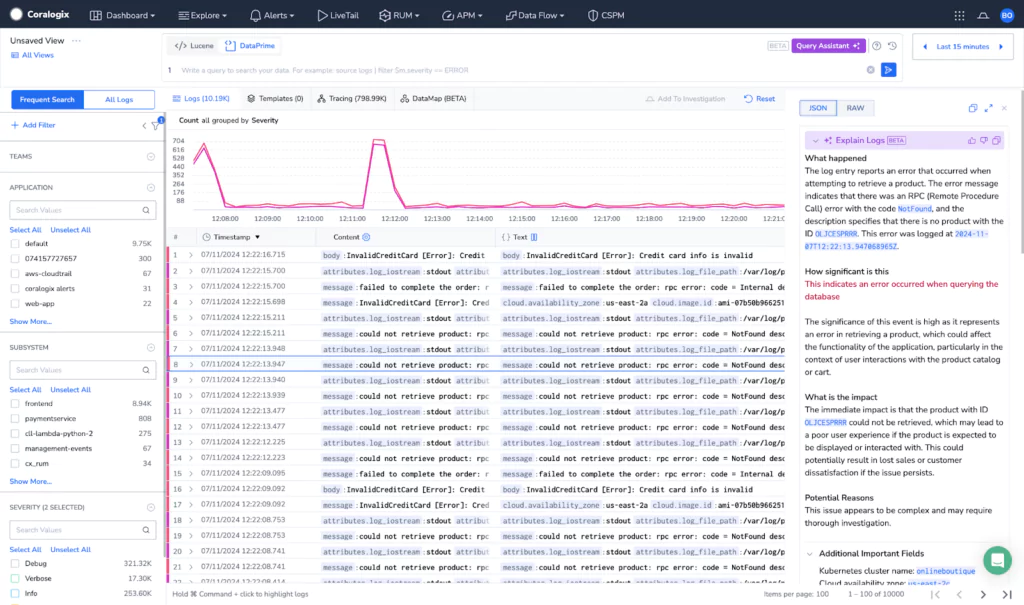
Cora AI streamlines your workflows by making data analysis and troubleshooting faster and easier.
- Query your data with natural language using the Query Assistant, which transforms everyday language into powerful DataPrime queries.
- Understand logs effortlessly with Log Explanations, which provides clear summaries of log context, system behavior, and potential issues. (In Beta for select customers).
- Coming soon: Access Coralogix knowledge instantly for real-time answers to your questions about the platform without context switching.
Cora AI ensures smarter, faster decisions while maintaining full data privacy, helping your team work more effectively without unnecessary complexity.
Gain granular insights with precision dashboards
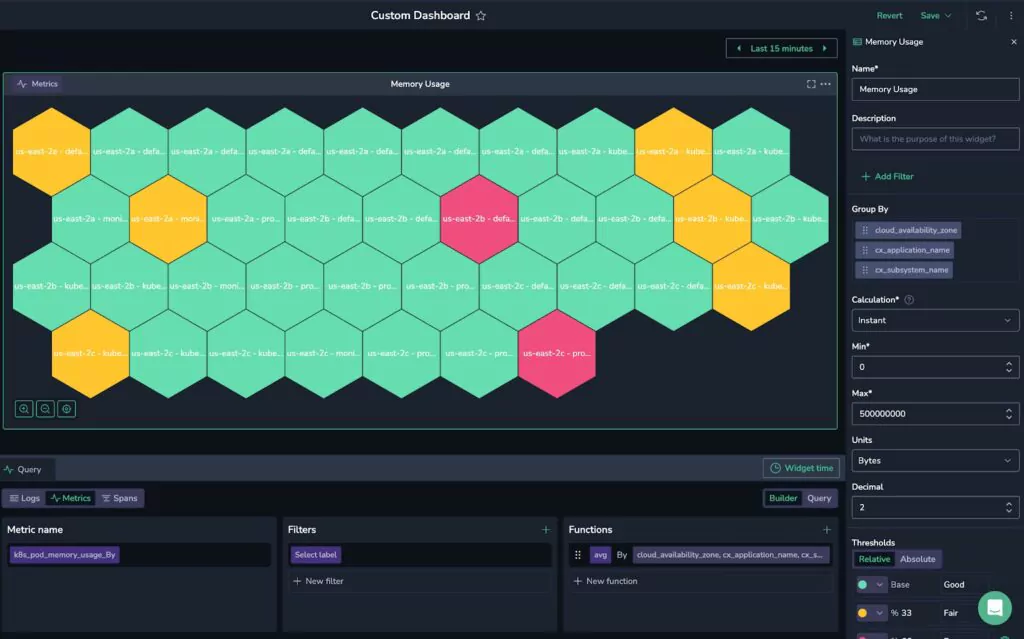
Gain complete control over your data visualization with our Custom Dashboards feature updates.
- Visualize high-cardinality data with the Multi-Gauge and Polystat widgets, making it easy to analyze thresholds and patterns.
- Query logs, metrics, and spans faster with the Query Builder, simplifying the process for more efficient analysis.
- Customize widget timeframes with Widget Time Picker, allowing individual time settings for widgets to match your specific needs.
These tools empower you to create dashboards tailored to both high-level monitoring and detailed diagnostics.
Instantly spot trends and outliers in massive data sets
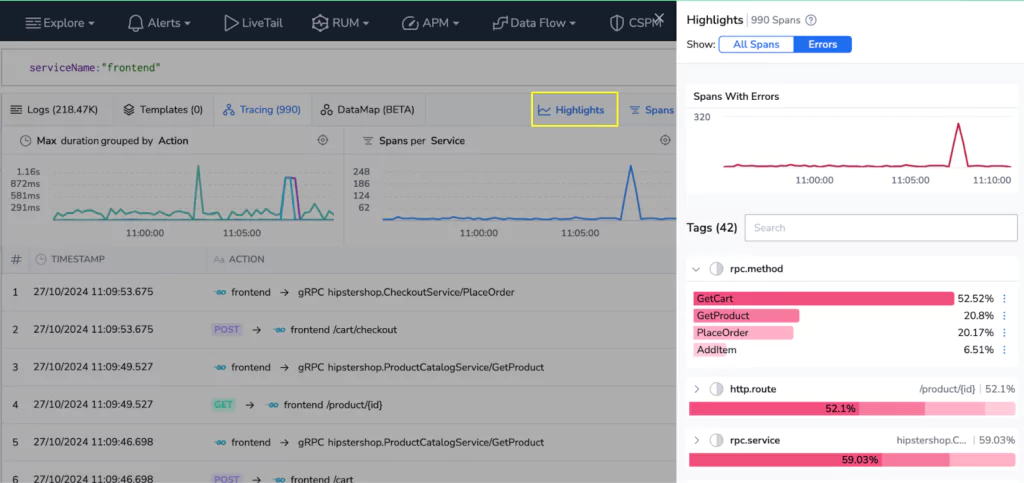
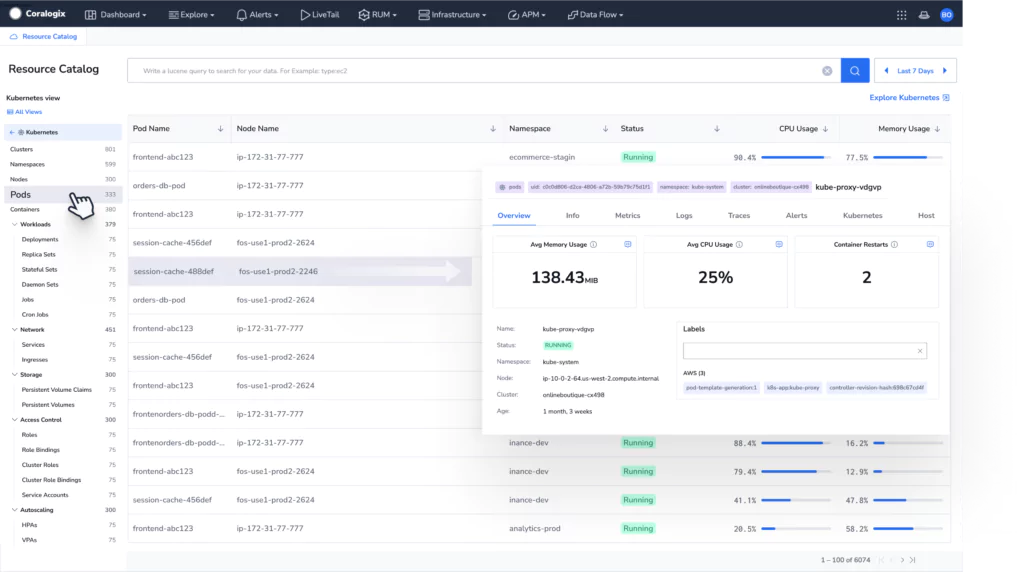
Coralogix Highlights automatically detects and visualizes key contributors and outliers to performance issues allowing you to quickly identify and resolve issues.
- Accelerate your troubleshooting by pinpointing issues, like errors or latency, concentrated within key attributes—such as user group, browser, geographic region or similar.
- Visualize relationships between data points using specific labels, for easier identification of commonalities and outliers.
Highlights makes it easier than ever for your entire team to investigate issues throughout your system, for faster debugging and incident resolution.
Contextualize application performance rapidly
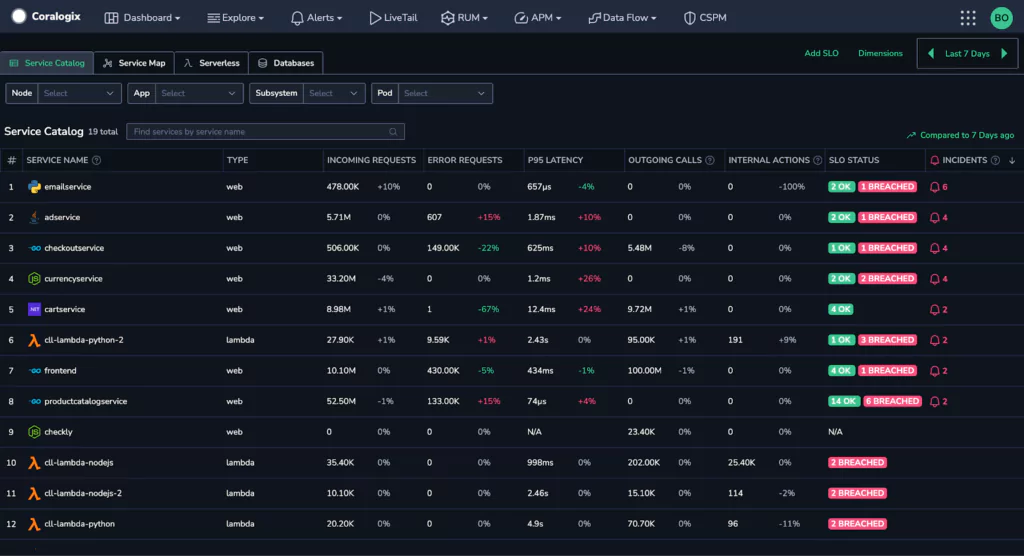
Resolve performance issues more efficiently with our latest Application Performance Monitoring (APM) features.
- Contextualize data with Comparison Mode, enabling you to easily assess the difference between real-time data with historical metrics for rapid trend and anomaly identification.
- Spot system-wide issues at a glance with the Incidents Column, offering a high-level view of active issues to help you prioritize and resolve incidents more effectively.
Whether you’re optimizing databases or services, these tools give you the power to stay ahead of performance challenges.
Connect metrics to business outcomes
Coralogix transforms technical data into actionable business intelligence, enabling you to understand how infrastructure and application performance directly impact your customers and bottom line:
- Track SLOs that reflect customer experience, ensuring your service meets expectations and drives satisfaction for specific user segments.
- Correlate logs, metrics, and traces by connecting every CPU spike, API latency, and cache miss to business outcomes. Uncover how system performance impacts customer journeys and revenue.
- Convert performance metrics into revenue insights by understanding how feature performance influences user behavior, tracking trends over time, and linking technical health directly to business growth with actionable intelligence.
These capabilities allow you to move from monitoring metrics to measuring meaning, ensuring that every system alert, data point, and performance trend aligns with your business success.
Visualize how microservices interact & identify bottlenecks
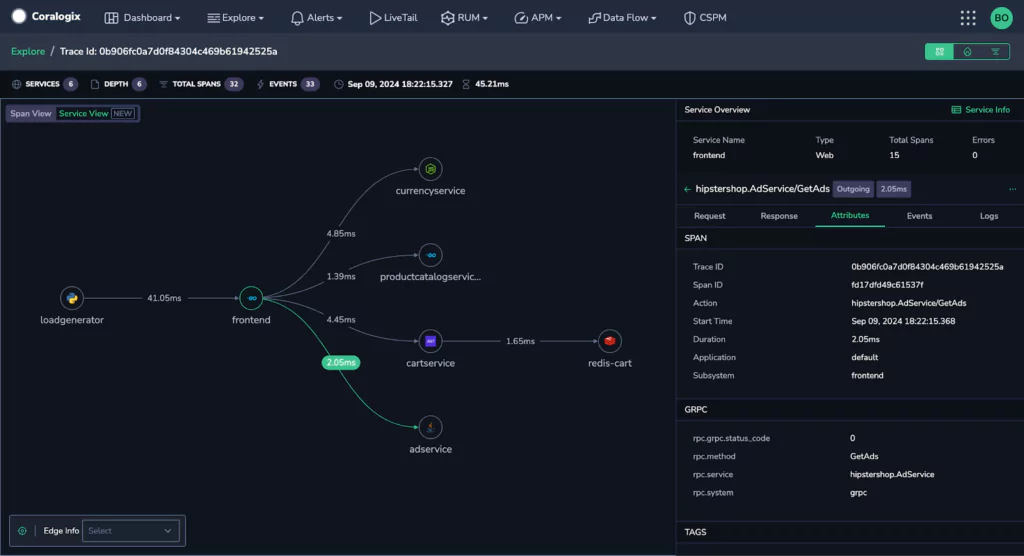
The new Service Node Graph provides a clear view of service interactions within a trace, making it easier to understand microservices and spot bottlenecks.
- Visualize large traces by grouping spans under their corresponding services, simplifying complex traces into a clear, concise overview of how each service contributes to the request.
- Follow logical request flows with grouped requests and responses, reducing the need to switch between client and server spans to understand the trace.
- Gain clarity for databases and messaging buses, with improved visibility into the role of services like Kafka, RabbitMQ, and SQS within your traces.
With the Service Node Graph, the platform now offers four ways to visualize a trace, giving you the tools to analyze and troubleshoot with precision.
Customize RUM for business-critical insights
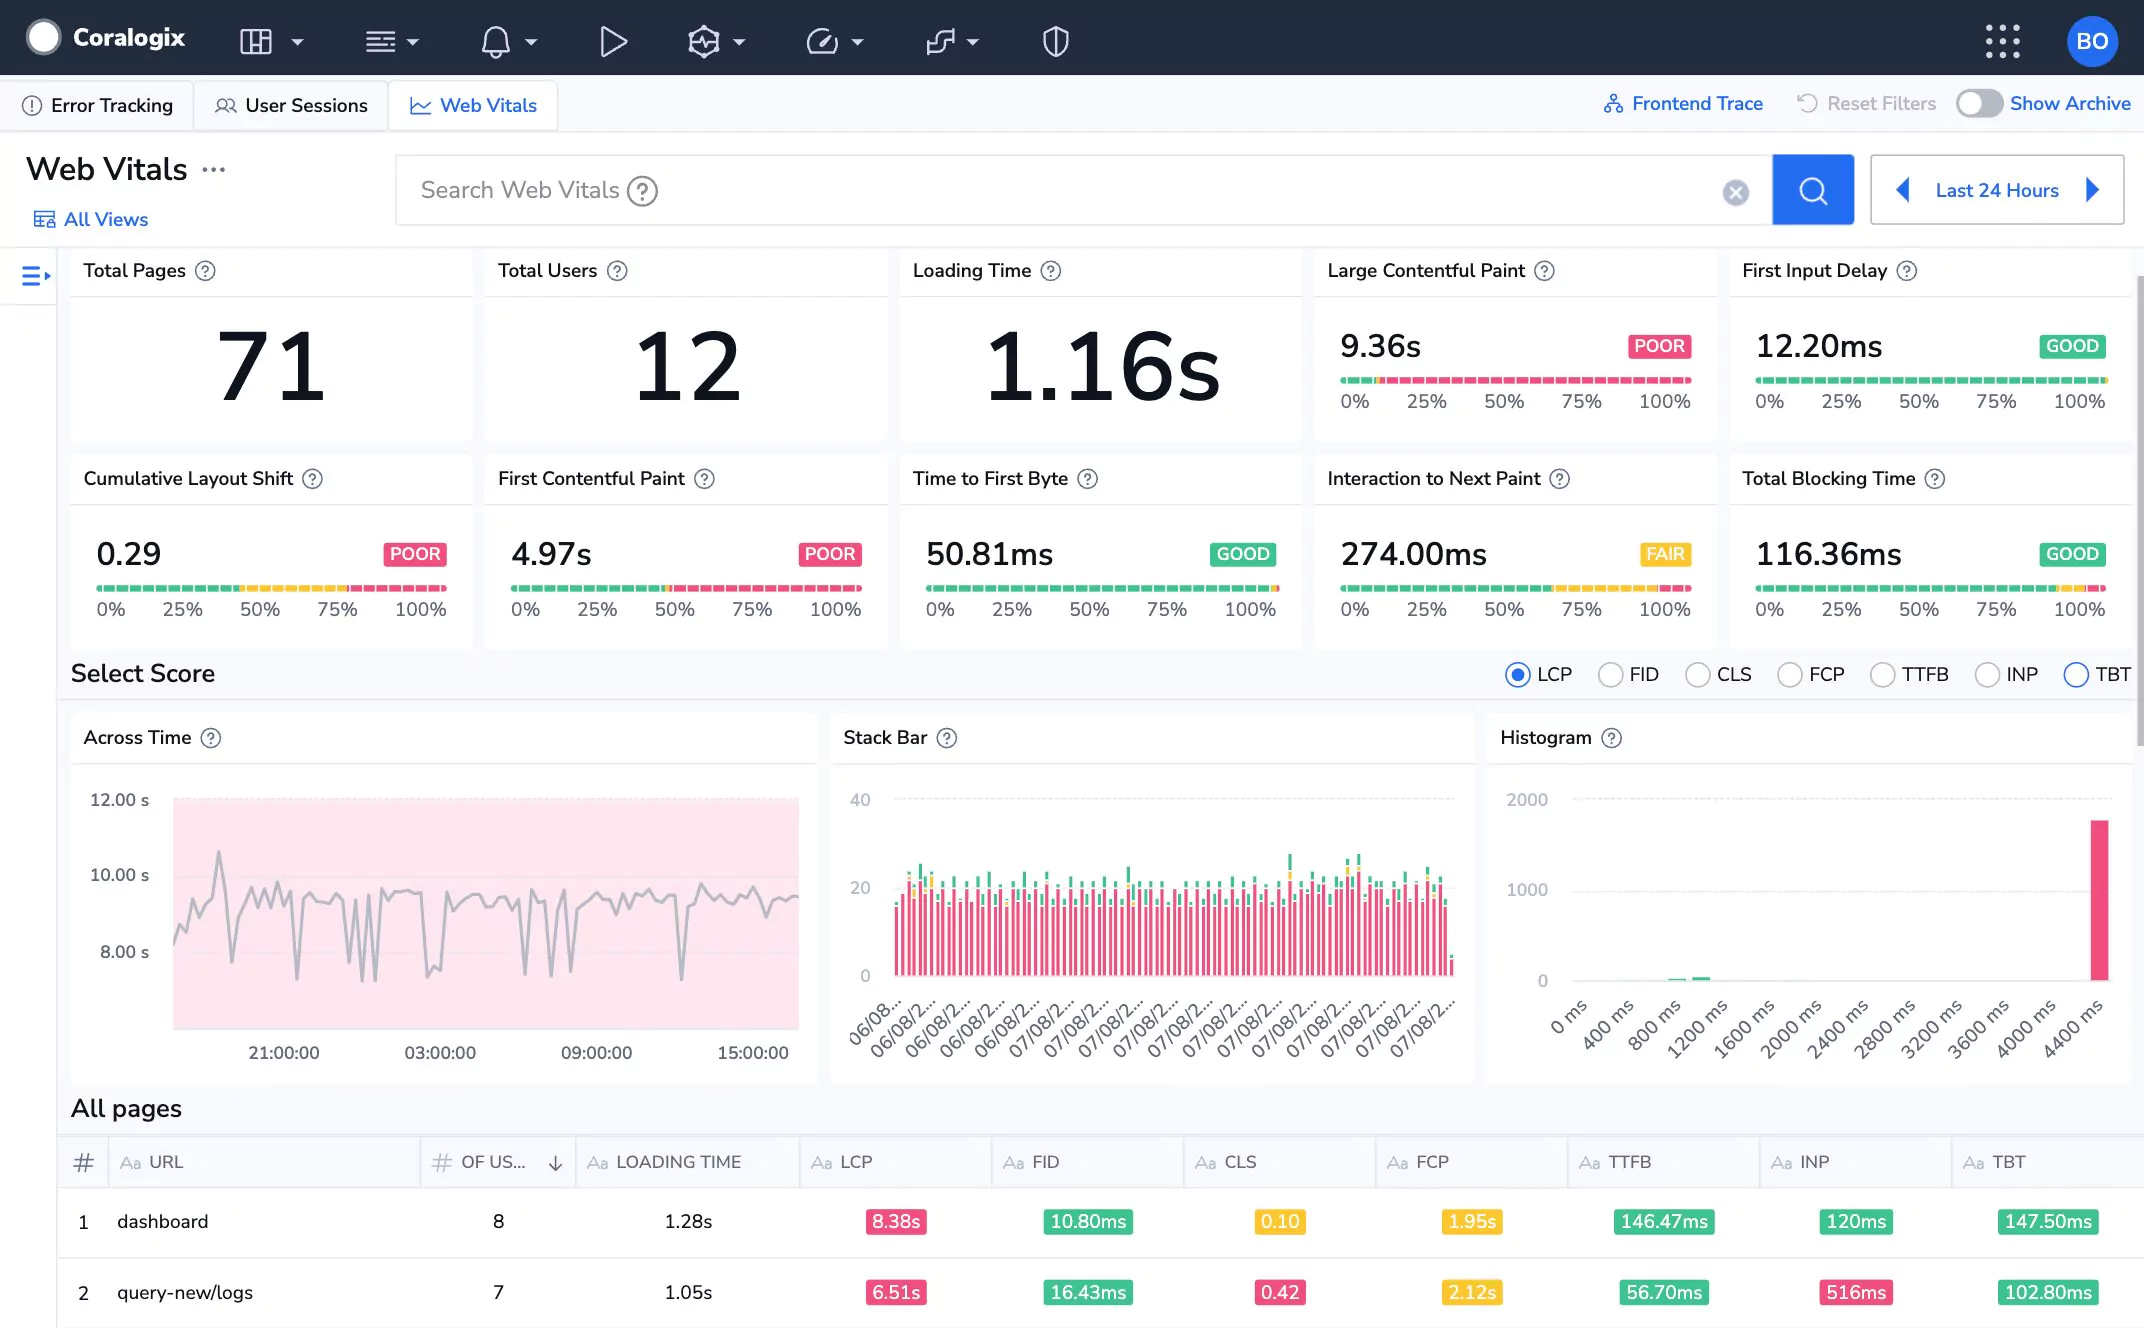
Billions of dollars are lost every year due to poor user experiences. That’s why our newest Real User Monitoring (RUM) capabilities make it easier to understand and optimize user behavior across your applications, to keep your users satisfied and prevent costly mistakes.
- Track key performance metrics with Custom Measurements, allowing you to monitor what matters most—like load times and user interactions—for deeper insights into your users’ experiences.
- Optimize load events with Customized Timing, focusing on critical web load events to ensure a smooth, responsive experience for every user.
- Resolve issues across devices with Mobile RUM for iOS and Android, as well as a new SDK for tvOS, enabling quick identification and resolution of performance issues, no matter the device or network.
No more blind spots—just actionable, customizable insights across all of your devices.
Discover what’s next in observability
This is just the beginning. With hundreds of features launched this year alone, countless more in the pipeline, frequent updates, new SDKs, and advanced integrations, we’re dedicated to keeping you ahead in observability innovation. Visit us at Booth #728 to see these features in action, chat with our team, and learn how we can help transform your observability strategy.
Don’t wait—schedule a demo today and get ready to experience observability and security that actually scale with you. See you in Vegas!