DORA Metrics for $0.02 a day

There are many solutions on the market that are promising insight into the four key metrics. Alas, these solutions often come with a significant price tag. Coralogix doesn’t charge per feature, per user, per host or per query. We charge by GB. And that, coupled with some incredible analytics and indexless observability, makes for some incredible insights that cost almost nothing.
At a high level
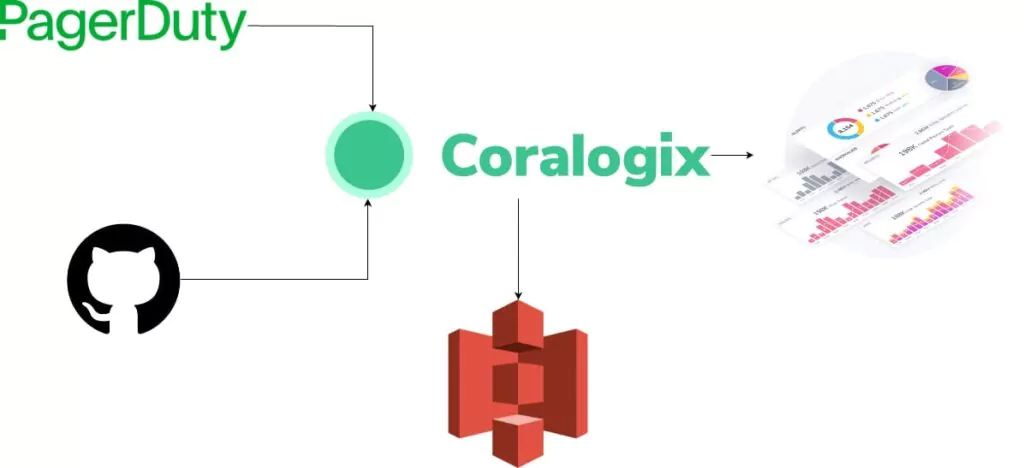
This approach makes use of two very common tools. PagerDuty, for tracking incidents, and Github Actions for tracking CI/CD and Git lead times.

Success criteria
- All four metrics are monitored to a reasonable standard.
- No data is indexed in high performance storage at any point.
Let’s start from the beginning and explore how to ingest the data into Coralogix, and then we’ll demonstrate some of the power of the DataPrime query syntax, for calculating complex metrics from your data.
Ingesting PagerDuty & Github data
Coralogix offers an integration type called Contextual Data. This data is low volume, high value, meaning customers can gain huge insights (like DORA metrics!) without a huge data footprint. To begin with, we captured data from Github.
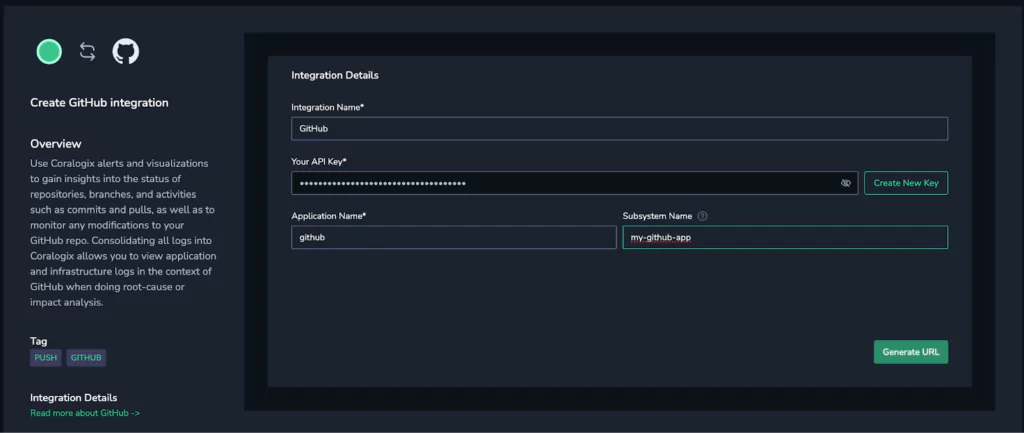
Doing this was simple. Following the documentation, we first went through the guided setup in the Coralogix application:

In a few clicks, we have a Github webhook that we can add to our desired repository. This was a few clicks in the repository, but if you have lots of Github repos, you can use the API and push the same webhook to all of them.
The process was the same for PagerDuty. Follow the docs, generate a webhook, connect it to PagerDuty and, all good.
Exploring the data
Once we had the data in the Coralogix account, it was time to see what we had. The Github data would be the source of three of our metrics, and they hinged on some important measurements:
- When the commit was first made.
- When the deployment completed.
- Whether the deployment was successful.
Crunching the Github data
It didn’t take long to find the necessary values in the Github data. They were:
- The timestamp on the log, indicating when the deploy completed.
- The commit timestamp, indicating when the commit was made.
- The conclusion field, indicating whether the deployment step succeeded or failed.
With these three values, and the insane power of DataPrime, we could generate 3 of the 4 key metrics.
Median Lead Time
Calculating the median lead time was pretty straightforward. We first work out the difference between the log ingestion time and the commit time, and we save this difference as a new field, lead_time. We then take the 50th percentile, or the median, of all of these values, using DataPrime’s aggregation function and call this new value the median_lead_time.
source logs
| filter github.workflow_run.status == 'completed'
| create lead_time from $m.timestamp - github.workflow_run.head_commit.timestamp.parseTimestamp()
| choose lead_time, $m.timestamp, github.workflow_run.head_commit.timestamp
| groupby $l.applicationname percentile(0.5, lead_time:num) as median_lead_time
| choose median_lead_time / 1000 / 1000 / 1000
Change Failure Rate
Change failure rate was very straightforward. Capture the logs indicating a completed run, and then count all of the logs with a conclusion of failure, divide that by the total amount to convert to a percentage, and hey presto. Change failure rate.
source logs
| filter github.workflow_run.status == 'completed'
| groupby github.workflow_run.status aggregate sum(if($d.github.workflow_run.conclusion == 'failure', 1, 0)) / count() * 100 as failure_percentage
| choose(failure_percentage)
Deployment frequency
This one was so easy, we just used Lucene: github.workflow_run.status: “completed”. Github provides a log when the whole deployment is finished.
NOTE: This makes the assumption that a finished Github Actions workflow is a deployment. Obviously this isn’t the case, so some filtering may be necessary to ensure it’s the right workflow that’s finishing.
MTTR from PagerDuty
Calculating the Mean Time to Recovery (MTTR) from PagerDuty was also straightforward. The webhook sends an event when an incident is resolved, and within that event is when the incident was first initiated. Very similar to lead time, we’re just finding and averaging the difference between these two values.
source logs
    | filter pagerduty.event == 'incident.resolve'
    | create time_to_recovery from pagerduty.created_on.parseTimestamp() - pagerduty.incident.created_at.parseTimestamp()
    | choose time_to_recovery
    | groupby time_to_recovery avg(time_to_recovery:num) as mttr
    | choose mttr / 1000 / 1000 / 1000
Creating actionable insights
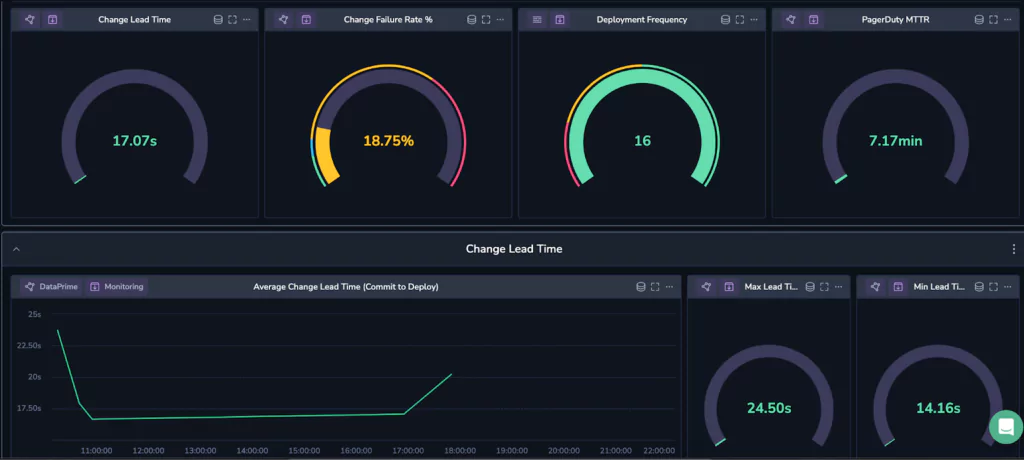
Once this analysis was complete, we could then produce some pretty amazing dashboards.

You’ll notice some are yellow, some are green, some are red. We took the thresholds for low, average, high and elite performance from the State of DevOps 2023 report, so that at a glance, this dashboard color codes your performance in each of these areas. We can see that for this data set, the only cause for concern is the change failure rate, which is sitting quite high at 18.75%.
The secret sauce
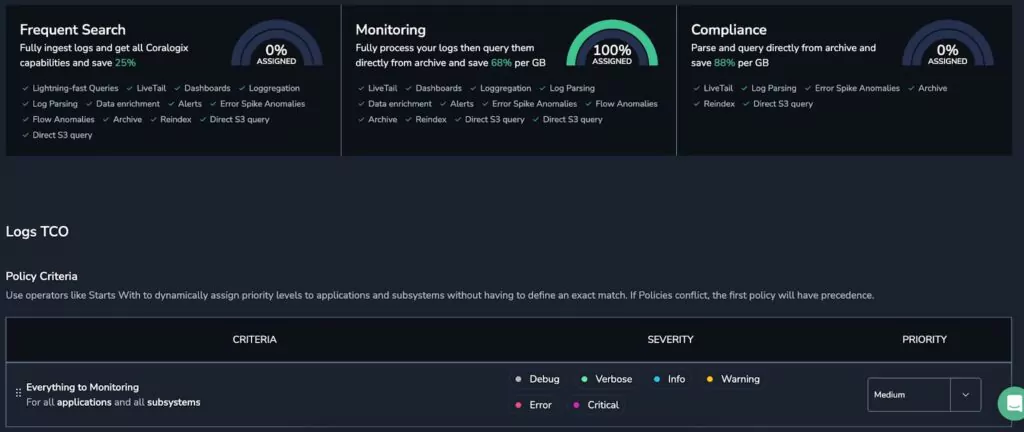
Now we’ve got the data, it’s time to optimize. You’ll notice on the above dashboard that the word Monitoring appears on each widget. This is a reference to the Coralogix TCO Optimizer, and because of how we’re using this data, and the power of Coralogix, we were able to use it to reduce costs by 70% (from $0.02/day to $0.01/day, every little helps!) and retain all data in cloud storage in your own account.

In real terms, this means no data is indexed and retained in the Coralogix system. It’s ingested, cleaned, analyzed and pushed to cloud storage in your account. No retention markup, and rock bottom costs, with constant access whenever you need. These four key metrics can be tracked for years at a very low cost.
Dora Metrics pricing with Coralogix
Now we’ve got something that works, we need to work out how much it is going to set us back. Let’s make some big estimations. If we take a customer that makes 1000 deployments a day, and experiences 100 PagerDuty incidents (a moment of silence for their SREs), then the daily data ingested is easy to calculate.
Each PagerDuty log is about 7KB, and each Github Log is about 22KB, meaning:
22KB * 1000 + 7KB * 100 =~ 20MB / Day
At the monitoring level, Coralogix allows 3GB of logs per unit, and a cost of $1.50 per unit, meaning:
3000MB / 20MB = 1/150th of a unit = $1.50 / 150 = $0.01 / Day
So your bill for Coralogix is around $0.01 a day. Now, what about your S3 Costs? Let’s assume retention of one year.
20MB / Day * 365 = 7.3GB * $0.02/GB per Month = $0.15 / Month = ~$0.01 / Day
When you combine these costs, you’re left with a grand total of $0.02 / day for one year retention of 1000 releases and 100 incidents per day, with unlimited access to your data at no additional cost.
Insights for everyone
The Coralogix pricing model is simple for a reason. Observability does not need to be complex, mercurial, unpredictable or expensive, and features like the four key DORA Metrics should never be cost prohibitive. If you’re ready to freely explore your data, produce insights that would be impossible anywhere else, never worry about an overage again and enjoy zero vendor lock-in, then check out Coralogix today.


