What’s Missing From Almost Every Alerting Solution in 2022?


Alerting has been a fundamental part of operations strategy for the past decade. An entire industry is built around delivering valuable, actionable alerts to engineers and customers as quickly as possible. We will explore what’s missing from your alerts and how Coralogix Flow Alerts solve a fundamental problem in the observability industry.
What does everyone want from their alerts?
When engineers build their alerts, they focus on making them as useful as possible, but how do we define useful? While this is a complicated question, we can break the utility of an alert into a few easy points:
- Actionable: The information that the alert gives you is usable, and tells you everything you need to know to respond to the situation, with minimal work on your part to piece together what is going on.
- Accurate: Your alerts trigger in the correct situation, and they contain correct information.
- Timely: Your alerts tell you, as soon as possible, the information you need, when you need it.
For many engineers, achieving these three qualities is a never-ending battle. Engineers are constantly chasing after the smallest, valuable set of alerts we can possibly have to minimize noise and maximize uptime.
However, one key feature is missing from almost every alerting provider, and it goes right to the heart of observability in 2022.
The biggest blocker to the next stage of alerting
If we host our own solution, perhaps with an ELK stack and Prometheus, as is so common in the industry, we are left with some natural alerting options. Alertmanager integrates nicely with Prometheus, and Kibana comes with its own alerting functionality, so you have everything you need, right? Not quite.
Your observability data has been siloed into two specific datastores: Elasticsearch and Prometheus. As soon as you do this, you introduce an architectural complication.
How would you write an alert around your logs AND your metrics?
Despite how simple this sounds, this is something that is not supported by the vast majority of SaaS observability providers or open-source tooling. Metrics, logs, and traces are treated as separate pillars, filtering down into our alerting strategies.
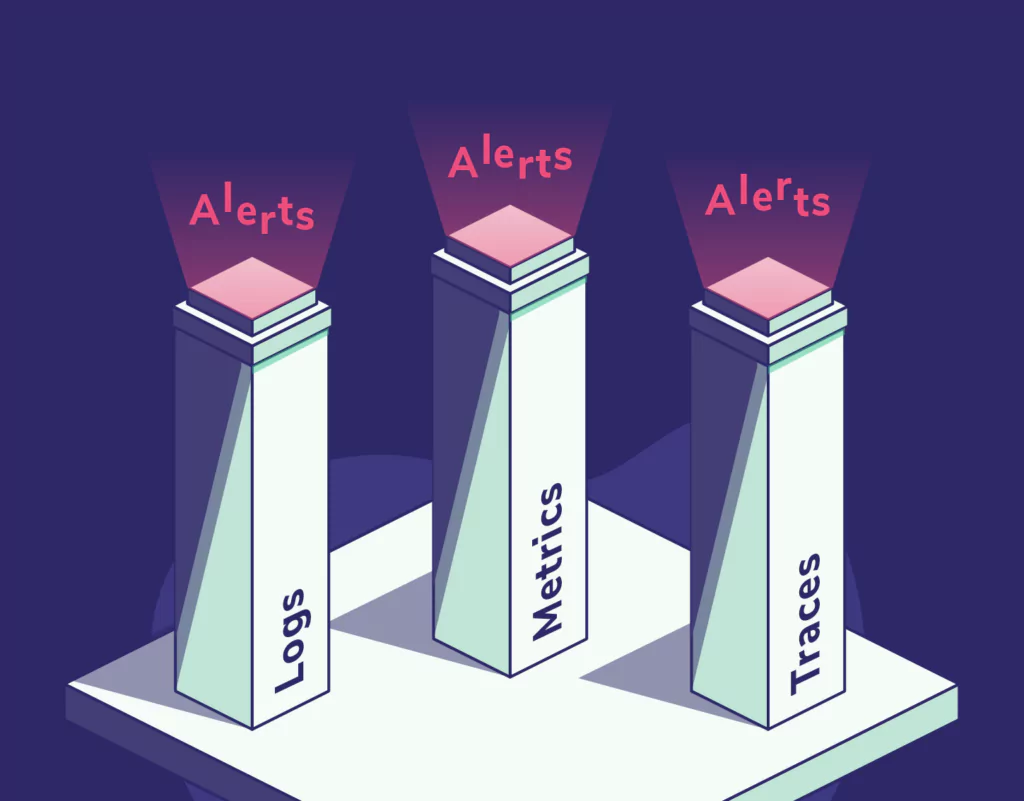
It isn’t clear how this came about, but you only need to look at the troubleshooting practices of any engineer to work out that it’s suboptimal. As soon as a metric alert fires, the engineer looks at the logs to verify. As soon as a log alert fires, the engineer looks at the metrics to better understand. It’s clear that all of this data is used for the same purpose, but we silo it off into separate storage solutions and, in doing so, make our life more difficult.
So what can we do?
The answer is twofold. Firstly, we need to bring all of our observability data into a single place, to build a single pane of glass for our system. Aside from alerting, this makes monitoring and general querying more straightforward. It removes the complex learning curve associated with many open-source tools, which speeds up the time it takes for engineers to become familiar with their chosen approach to observability. However, getting data into one place isn’t enough. Your chosen platform needs to support holistic alerting. And there is only one provider on the market – Coralogix.
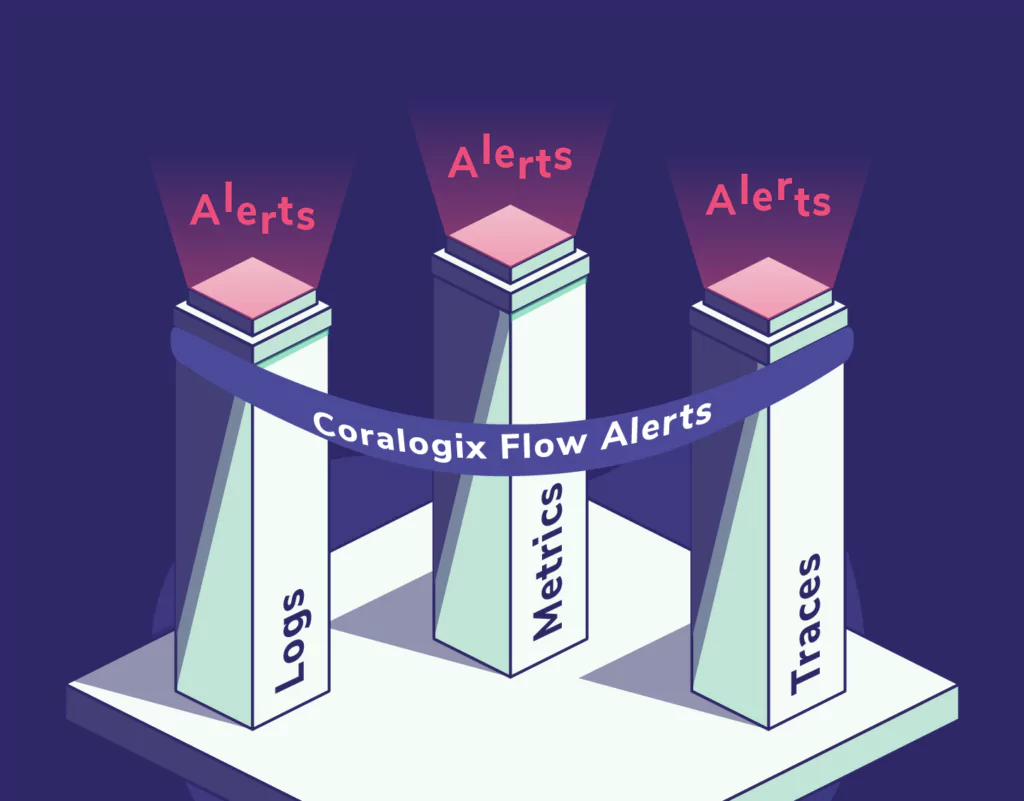
Flow alerts cross the barrier between logs, metrics, and traces
There are many SaaS observability providers out there that will consume your logs, metrics, and traces, but none of them can tie all of this data together into a single, cohesive alert that completely describes an outage, making use of your logs, metrics, and traces in the same alert.
Flow alerts enable you to view your entire system globally without being constrained to a single data type. This brings some key benefits that directly address the great limitations in alerting:
- Accurate: With flow alerts, you can track activity across all of your observability data, enabling you to outline precisely the conditions for an incident. This reduces noise because your alerts aren’t too sensitive or based on only part of the data. They’re perfectly calibrated to the behavior of your system.
- Actionable: Flow alerts tell you everything that has happened, leading up to an incident, not just the incident itself. This gives you all of the information you need, in one place, to remedy an outage, without hunting for associated data in your logs or metrics.
- Timely: Flow alerts are processed within our Streama technology, meaning your alerts are processed and actioned in-stream, rather than waiting for expensive I/O and database operations to complete.