The new standard of observability is here. Discover Olly, the industry’s first
Hybrid Cloud Defense Grid: Bridging Wiz and Runtime Telemetry

The modern cloud security landscape is often fighting a war on two disconnected fronts. On one side, we have Cloud Security Posture Management (CSPM) platforms like Wiz, which act as the cartographers of risk—mapping terrain with high fidelity to identify open ports, unpatched vulnerabilities, and toxic permission combinations. On the other hand, we have Runtime Defense tools (SIEM, EDR, NGFW) that generate massive streams of activity logs.
The industry’s failure is that these two armies rarely speak. CSPM tools scream about potential risk (which might never be exploited), while runtime tools scream about activity (which might be benign).
This post details a technical architecture for a Hybrid Cloud Defense Grid. By fusing static asset metadata from Wiz with high-velocity runtime telemetry using Snowbit’s observability pipeline, we stop asking “Is this asset vulnerable?” and start asking “Is this vulnerable asset currently under attack?”
1. Solving Correlation at Scale
The primary obstacle to bridging static context with runtime telemetry is scale. In a traditional SIEM setup, joining a static inventory table (Wiz assets) with a high-velocity firehose (Palo Alto traffic logs) at query time is a performance nightmare.
We solved this using a Log2Metric design pattern. This architecture decouples detection from raw log storage, processing data in-stream to generate lightweight, high-fidelity signals.
The Pipeline
- Ingest: Raw telemetry (Firewall, EDR, IDP) arrives at the ingestion edge.
- Enrich: The stream is immediately tagged with Wiz context (e.g., vulnerability_level=critical).
- Convert: We discard the heavy raw text and generate a dimensional metric.
Example Transformation:
# Raw Log Input
Timestamp: 12:00
Src: 1.2.3.4
Dst: DB-01
Bytes: 5000

# Metric Output
traffic_bytes_total{dest="DB-01", vulnerability="critical"} 5000
2. High-Fidelity Detection Logic
The following alerts represent the “Kill Chain” coverage of the Hybrid Cloud Defense Grid. Crucially, we use PromQL for detection because it supports Vector Matching—allowing us to mathematically multiply the “Runtime Vector” (Traffic) by the “Context Vector” (Risk Level).
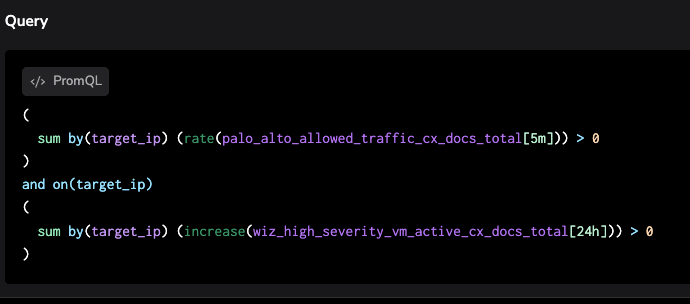
Alert 1: The Toxic Handshake (Network Exposure)
The Scenario: Attackers scanning for open ports on known vulnerable machines. A firewall “Allow” rule is pointless if the server behind it is vulnerable.
- Context (Wiz): Asset has “Critical Severity” CVEs (e.g., Log4j).
- Activity (Firewall): Action: Allow on inbound traffic from the Public Internet.
Detection Logic:
Alert 2: The Boomerang Effect (Cloud-to-OnPrem Pivot)
The Scenario: Using a compromised, low-security cloud dev server to pivot back into the corporate data center via VPN/ExpressRoute. This is the nightmare scenario where the cloud becomes a backdoor.
- Context (Wiz): Asset tagged as Environment: Dev or Risk: External_Facing.
- Activity (Windows Events): Event ID 4624 (Successful Login) on an internal Domain Controller originating from the cloud asset IP.
Alert 3: The Digital Heist (Database Exfiltration)
The Scenario: Slow-drip data exfiltration from a production database.
- Context (Wiz): Asset tagged Type: Production_DB.
- Activity (Network): Anomalous outbound traffic volume.
PromQL Query:
Code snippet
sum(rate(bytes_sent{asset_type="Prod_DB"}[5m])) > Threshold3. Conclusion: From Compliance to Active Defense
The “Visibility Gap” is not a technology problem; it is an integration problem. Compliance is checking a box that says, “We have a firewall.” Active Defense is the weaponization of that data.
By wiring these contexts together, we ensure that when the alarm rings, it is ringing for a reason. Stop drowning in noise. Start correlating context.