Logs vs Metrics: What Are They and How to Benefit From Them

In a rapidly evolving realm of IT, organizations are constantly seeking peak performance and dependability, leading them to rely on a full stack observability platform to obtain valuable system insights.
That’s why the topic of logs vs metrics is so important with both of these data sources playing a vital role, as any full-stack observability guide would tell you, serving as essential elements for efficient system monitoring and troubleshooting. But what are logs and metrics, exactly?
In this article, we’ll take a closer look at logs vs metrics, explore their differences, and see how they can work together to achieve even better results.
What are logs?
Logs serve as a detailed record of events and activities within a system. They provide a chronological narrative of what happens in the system, enabling teams to gain visibility into the inner workings of applications, servers, and networks.
Log messages can contain information about user authentication, database queries, or error messages. They can present different levels, for instance:
- Information for every action that was successful, like a server start.
- Debug for information that is useful in a development environment, but rarely in production
- Warning, which is slightly less severe than errors, signaling that something might fail in the future if no action is taken
- Error when something has gone wrong and a failure has been detected in the system.
Logs usually take the form of unstructured text with a timestamp:
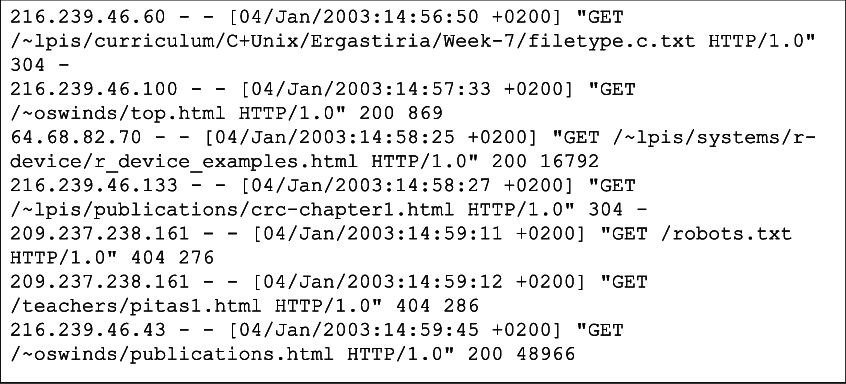
Logs offer numerous benefits. They are crucial during troubleshooting to diagnose issues and identify the root cause of problems. By analyzing logs, IT professionals and DevOps teams can gain valuable insights into system behavior and quickly resolve issues.
Logs also play a vital role in meeting regulatory requirements and ensuring system security. They offer a comprehensive audit trail, enabling organizations to track and monitor user activities, identify potential security breaches, and maintain compliance with industry standards. They also provide a wealth of performance-related information, allowing teams to monitor system behavior, track response times, identify bottlenecks, and optimize performance.
Despite their many advantages, working with logs can present certain challenges. Logs often generate massive volumes of data, making it difficult to filter through and extract the relevant information. It is also important to note that logs don’t always have the same structure and format, which means that developers need to set up specific parsing and filtering capabilities.
What are metrics?
Metrics, on the other hand, provide a more aggregated and high-level view of system performance. They offer quantifiable measurements and statistical data, providing insights into overall system health, capacity, and usage. Examples of metrics include measurements such as response time, error rate, request throughput, and CPU usage.
Metrics offer several benefits, including:
- Real-time monitoring: Metrics provide continuous monitoring capabilities, allowing teams to gain immediate insights into system performance and detect anomalies in real time. This enables proactive troubleshooting and rapid response to potential issues.
- Scalability and capacity planning: Metrics help organizations understand system capacity and scalability needs. By monitoring key metrics such as CPU utilization, memory usage, and network throughput, teams can make informed decisions about resource allocation and ensure optimal performance.
- Trend analysis: Metrics provide historical data that can be analyzed to identify patterns and trends. This information can be invaluable for capacity planning, forecasting, and identifying long-term performance trends.
While metrics offer significant advantages, they also have limitations. Metrics provide aggregated data, which means that detailed event-level information may be lost. Additionally, some complex system behaviors and edge cases may not be captured effectively through metrics alone.
Logs vs metrics: Do I need both?
The decision to use both metrics and logs depends on the specific requirements of your organization. In many cases, leveraging both logs and metrics is highly recommended, as they complement each other and provide a holistic view of system behavior. While metrics offer a high-level overview of system performance and health, logs provide the necessary context and details for in-depth analysis.
Let’s say you’re a site reliability engineer responsible for maintaining a large e-commerce platform. You have a set of metrics in place to monitor key performance indicators such as response time, error rate, and transaction throughput.
While analyzing the metrics, you notice a sudden increase in the error rate for the checkout process. The error rate metric shows a significant spike, indicating that a problem has occurred. This metric alerts you to the presence of an issue that needs investigation.
To investigate the root cause of the increased error rate, you turn to the logs associated with the checkout process. These logs contain detailed information about each step of the checkout flow, including customer interactions, API calls, and system responses.
By examining the logs during the time period of the increased error rate, you can pinpoint the specific errors and related events that contributed to the problem. You may discover that a new version of a payment gateway integration was deployed during that time, causing compatibility issues with the existing system.
The logs might reveal errors related to failed API calls, timeouts, or incorrect data formats. Armed with the insights gained from the logs, you can take appropriate actions to resolve the issue. In this example, you might roll back the problematic payment gateway integration to a previous version or collaborate with the development team to fix the compatibility issues.
After implementing the necessary changes, you can monitor both metrics and logs to ensure that the error rate returns to normal and the checkout process functions smoothly.
Using metrics and logs with Coralogix
Coralogix is a powerful observability platform that offers full-stack observability capabilities, combining metrics and logs in a unified interface. With Coralogix, IT professionals can effortlessly collect, analyze, and visualize both metrics and logs, gaining deep insights into system performance.
By integrating with Coralogix, you can benefit from its advanced log parsing and analysis features, as well as its ability to extract metrics from logs. You can aggregate and visualize logs in real-time, making it easier to spot patterns, anomalies, and potential issues.
Additionally, Coralogix allows you to define custom metrics and key performance indicators (KPIs) based on the extracted data from logs. This combination of metrics and logs enables you to gain comprehensive insights into your system’s behavior, efficiently identify the root causes of problems, and make data-driven decisions for optimizing performance and maintaining robustness in your applications.