Optimizing observability costs with a DIY framework


Observability costs are exploding as businesses strive to deliver maximum customer satisfaction with high performance and 24/7 availability.
Global annual spending on observability in 2024 is well over 2.4 billion USD and is expected to reach 4.1 billion USD by 2028. On an individual company basis, this is reflected by observability costs ranging from 10-30% of overall infrastructure spend.
These costs will undoubtedly rise with digital environments expanding and becoming ever more complex. As such, it’s imperative for cost-conscious companies to evaluate how they can best reduce this cost while maintaining overall excellence in their observability.
In this article, we will discuss why observability software is in such high demand, how to implement a DIY cost optimization approach, and the criteria for selecting an off-the-shelf option that ensures observability costs stay as low as possible.
Why is observability so damn expensive?
The most obvious cause for the growth of observability costs is that businesses must cater to today’s consumers, who expect lightning-fast, on-demand, 24/7 access to anything digital. Monitoring system health is imperative for modern companies. But alongside that, the growth of observability costs in recent years has been driven by a combination of various technological and organizational factors.
Let’s take a look at some of these:
Microservices
Microservices produce more observability data than their equivalent monolithic application. This is especially significant for trace data that shows how data flows through the application via all the intersected interfaces. The more microservices exist, the more data there is with increasingly complex interdependencies.
Ephemeral servers
In the past, a server would run for years; but now, in our cloud-centric world, the ability to spin up servers on-demand, the increased usage of spot instances, along with the very nature of microservices and containerization, make ephemeral servers quite common. This, too, drives up the complexity of infrastructure and increases data volumes.
SRE and Chaos Engineering
SREs (site reliability engineers) commonly use chaos engineering to test applications, purposely introducing failures to verify resilience. For example, SREs will destroy a server just to see how the system will respond. The resulting failures are not typically seen in normal day-to-day system behavior, so once again, observability data is increased to cover these test modes and scenarios.
Indexing and hot storage
As a result of the above, observability solutions must ingest and process enormous amounts of data so companies can understand where issues exist and ensure their application or website’s health is not compromised. However, this typically entails indexing data to speed up search and query operations and then storing it in hot storage for frequent and fast retrieval. This directly drives up observability costs, particularly because hot storage is extremely expensive.
Data volume is not the problem. Data management is.
While some observability vendors will recommend limiting data ingestion to reduce costs, this strategy can negatively impact observability with missed detections of production issues, loss of valuable data needed for root cause analysis, and increased risk of non-compliance with various regulatory requirements.
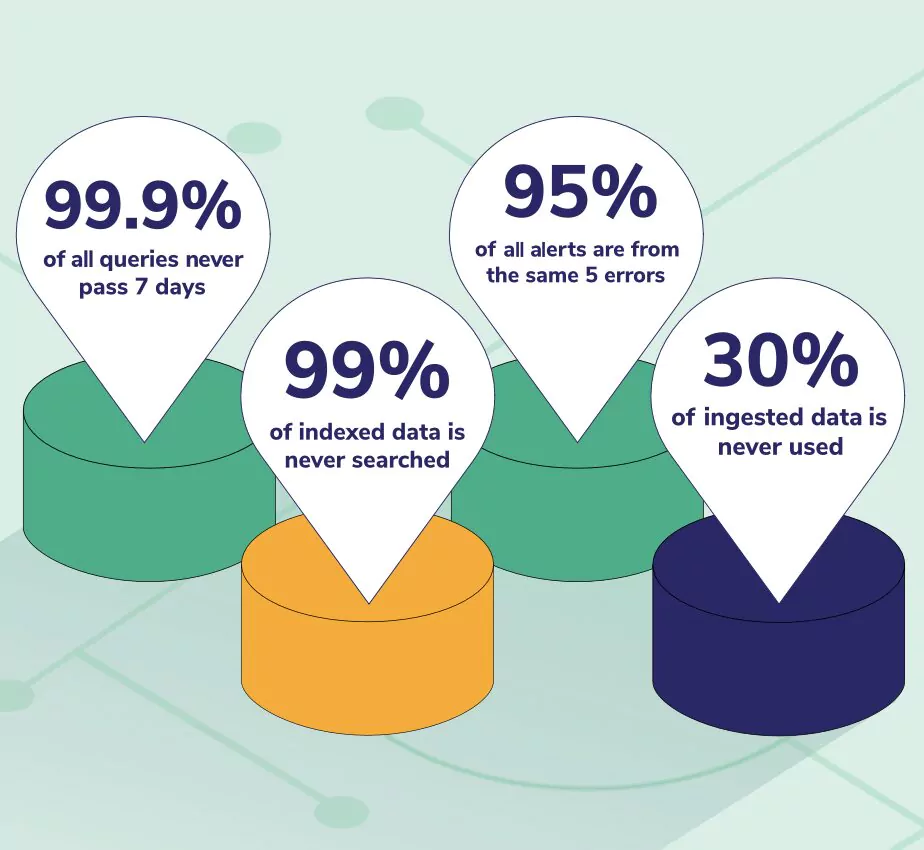
Before we discuss how you can better manage your data and associated costs, observe some eye-popping statistics we are seeing across petabytes of daily data consumption from over 1,000 companies.
Do-it-yourself observability
Taking the DIY approach may work best for many companies with experienced DevOps and SRE teams. Here is what you need to know when doing DIY observability.
Start with the right framework for DIY cost-effective observability
Given the complexity of data management, it’s easy to get lost in the details. However, to reduce your observability costs and keep them low, you just need to start with the right approach.
Reducing observability costs doesn’t need to be a big or complex consulting project. The key steps to follow:
Determine how the data is used
The first thing to do is understand how your data is used. Here are three categories you can use to get organized:
- Data you search on a daily basis.
- Data you use for dashboards and alerts but don’t frequently search.
- Data you keep for compliance purposes only.
Many open source tools will give you some level of insight into what is being searched the most. For example, if you are using Prometheus, the Prometheus Query logs can tell you which queries are running the most and, thus, which time series metrics are most important.
As you go, you may wish to expand on the above categories, as your organization undoubtedly has many different data usage scenarios. However, getting started with this basic categorization is essential as we will require it later.
Abandon the pattern of indexing all data
A typical pattern with observability solutions is to index all ingested data in a tool like OpenSearch and then, over time, move it to less expensive storage options like S3. Not all ingested data will be used in fast searches, with 30% of the data never used at all. Indexing is very expensive, so it should be limited to data that will be searched frequently.
This pattern is typical because it is easy to set up the flow. However, by defining use cases, teams can create a more intelligent data routing pattern that categorizes the data before determining what should be done with it.
Route data to the appropriate storage
Once data use cases and statistics are in place, categorizing the data becomes more straightforward. The categorizations allow teams to understand what data needs to be queried quickly, what data will never be queried at all, and everything in between. Based on the category, you may decide to route your data to be archived, stored in hot storage SSDs, or
perhaps an intermediate option like magnetic EBS.
With this flow, only highly important, frequently searched data would be indexed and stored in expensive SSDs (hot storage). On the other hand, compliance data that doesn’t add operational value can be sent directly to inexpensive archive storage. Data required for intermittent usage could be stored in magnetic EBS.
Don’t do the reindexing thing
Reindexing is done when data is already put into archive storage, but you need to re-access it. For example, regulatory data may be regularly archived, but once a year, you must access it to generate a report. This act of reindexing is very expensive even though the data is eventually deleted from hot storage. Further, operational queries are slowed down by adding this bulk data back into the index.
As an alternative to this costly and inefficient reindexing, archived data should be saved in an easy-to-access, open-source format like Parquet or CSV. By doing this, the archive can be queried directly without indexing. This shaves money off your observability bill, but more importantly, it keeps historical and operational data separate and keeps operational data queries working quickly.
Minimize data generation where possible
Stop producing some unnecessary logs, traces, and metrics. The categorization we’ve described will help to understand what data is useful and what is not.
Data needed for regulatory compliance or peace of mind should be put directly into low-cost archive storage. Most of the time, this data will not be used, but it could be queried directly from the archive as described in the previous section.
Convert logs and spans to metrics
No rule says you need to ingest data in its original form. Logs are especially expensive to store due to their size. Not all fields in the log data are helpful. If a log has limited useful fields, consider converting them into time-series metrics and drop the original log from storage. Metrics are small in comparison and are less expensive to store. DevOps teams also get the same insights because this data can still be indexed; there is just significantly less data to index, which optimizes the cost.
One exception to metrics being low-cost to store is when they are high cardinality. These metrics have a label with many distinct values, such as a metric of IP addresses where millions of users are supported. Each distinct value under a label gives a different way the data can be queried. This slows your queries, increases costs, and causes outages to last longer. Metrics
generally work better with many different time series than a single time series with a large number of high cardinality and high dimensionality.
To avoid high cardinality, teams can aggregate metrics to reduce labels, remove unnecessary labels, or generate smaller metrics with lower cardinality. These actions will help reduce costs and are critical to keep performance standards high.
Off-the-shelf observability
Sometimes the operational overhead of managing your own observability solution is too high. It can divert your team’s focus and burden them with laborious maintenance of your observability stack and its underlying infrastructure. If you are considering a managed observability solution, the following sections provide some general guidance.
What to look for in an observability vendor
When looking at SaaS observability options, cost optimization will look different depending on the provider, their architecture, and how insights are generated in their proprietary system.
Here are some tips for choosing a cost-efficient solution.
Ask the right questions about observability cost
As consumers using SaaS observability providers, there should be a way to optimize costs in each system. Whether you have already integrated with a provider or are choosing one for the first time, ensure you ask about cost optimization in a specific way. Ask them: “What tools do you offer for customers to optimize costs?”
The answer the vendor provides will shed light on what tool they have invested in and built instead of putting the cost optimization onus directly on you, the consumer. Since customers don’t have as much control over the flow when using a 3rd party solution, a typical response to cost reduction is simply to reduce data volume. As we have discussed, that is not the best
option since you can also lose insight into your software system health, and it requires significant engineering time to implement these reductions (further increasing your costs). So without actual cost optimization tools built into their offering, the provider likely does not want you to optimize your costs and, as such, should be avoided.
Understand the observability vendor’s pricing model
This might take more effort, but reading the fine print is critical. If a vendor has many bundled services that force you to buy features you don’t need, per-host pricing that doesn’t differentiate on host size, or lots of different and non-standardized fees for each and every feature, you should be thinking twice about them.
Look for a vendor that provides straightforward, clear pricing for observability so you can easily estimate costs and avoid costly overages.