The new standard of observability is here. Discover Olly, the industry’s first
For many companies, success depends on efficient build, test and delivery processes resulting in higher quality CI/CD solutions. However, development and deployment environments can become complex very quickly, even for small and medium companies.
A contributing factor to this complexity is the high adoption rate of microservices. This is where modern CI/CD solutions like CircleCI come in to provide greater visibility. In this post, we’ll walk through the Coralogix-CircleCI integration and how it provides data and alerts to allow CircleCI users to get even more value from their investment.
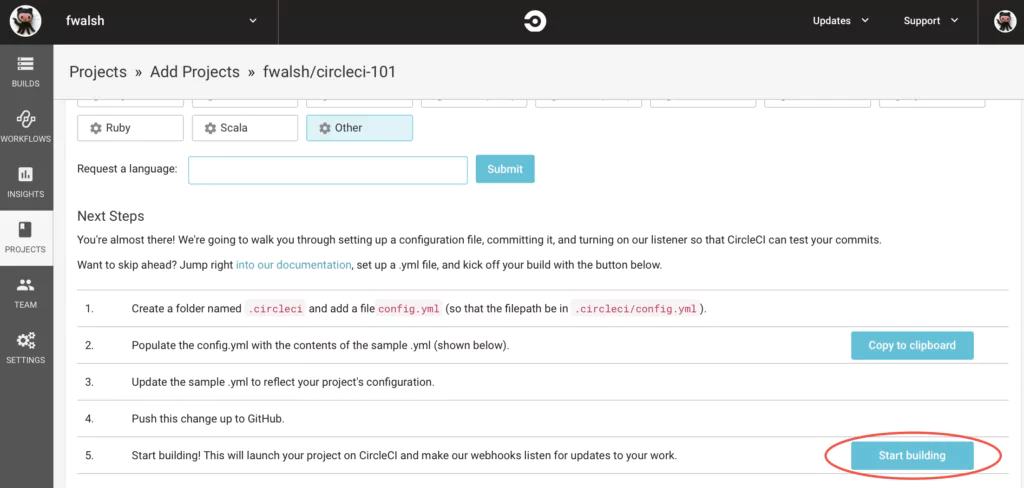
See this post for how to set up the integration.
Once completed, the integration ships CircleCI logs to Coralogix. Coralogix leverages our product capabilities and ML algorithms providing users with deep insight and proactive management capabilities. It allows them to continuously adjust, optimize and improve their CI processes. To borrow from CI/CD vocabulary, it becomes a CM[CI/CD], or a Continuously Managed CI/CD, process.
In addition, using the CircleCI Orb will automatically tag each new version you deploy allowing you to enjoy our ML Auto Version Benchmarks.
The rest of this document provides examples of visualizations and alerts that will help implement this continuous management of your CircleCI implementation.
Visualizations
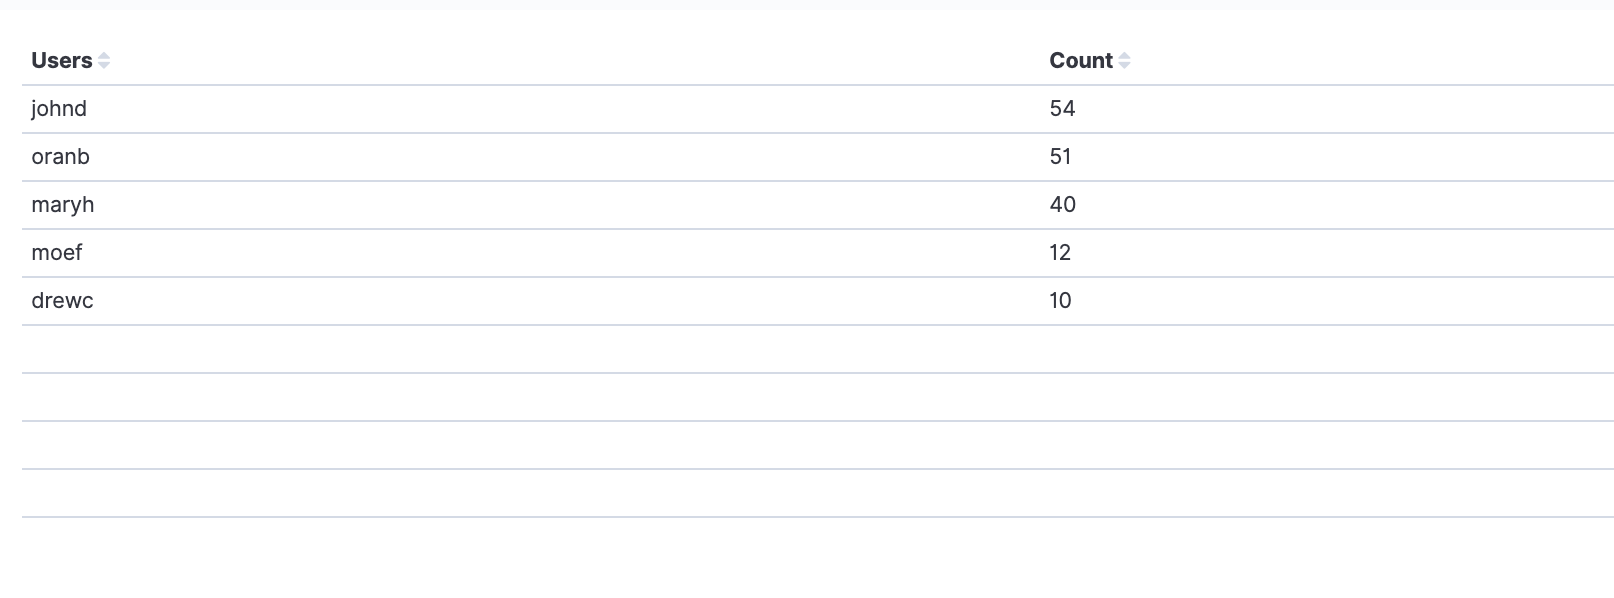
Top committers
This table shows the top committers per day. The time frame can be adjusted based on specific customer profiles. It uses the ‘user.name’ field to identify the user.
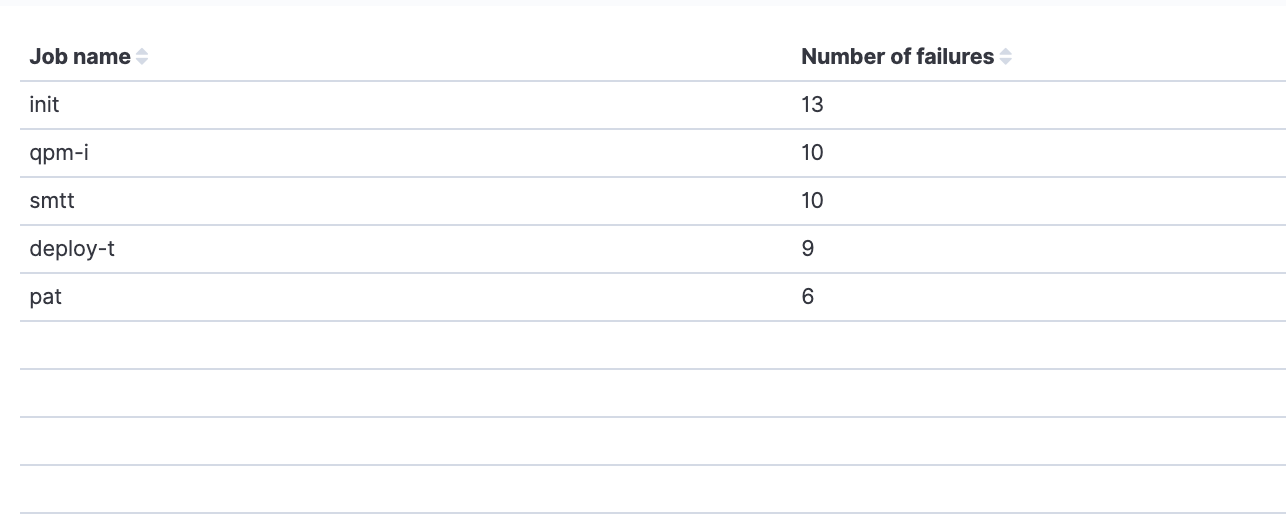
Jobs with most failures
This visualization uses the ‘status’ and ‘workflows.job_name’ fields. It shows the jobs that had the most failures per time frame specified by the customer profile.
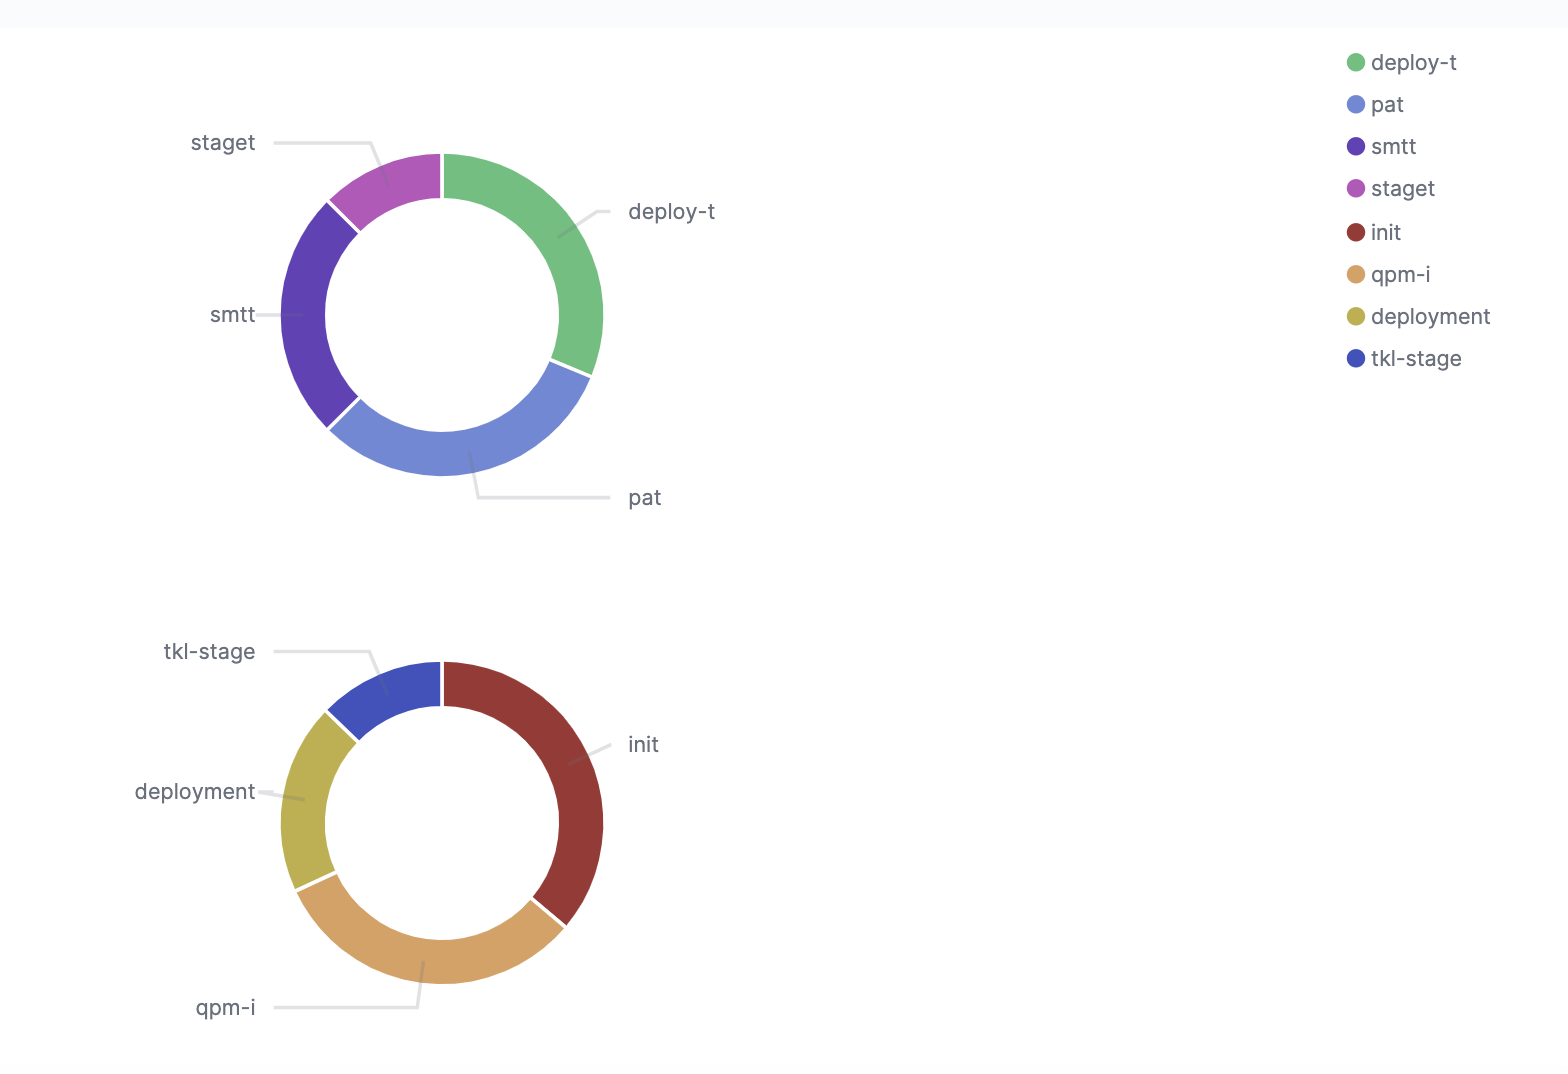
Class distribution
Class usage relates to memory and resource allocation. This visualization uses the field ‘picard.resource_class.class’, part of the log’s picard object. Its optional values are ‘small’, ‘medium’, and ‘large’. The second field used is ‘workflows.workflow_name’ that holds the workflow name. Although classes are set by configuration and do not change dynamically, they are tightly related to your credit charges. It will be good to have this monitored to identify if a developer unexpectedly runs a new build that will impact your quota.
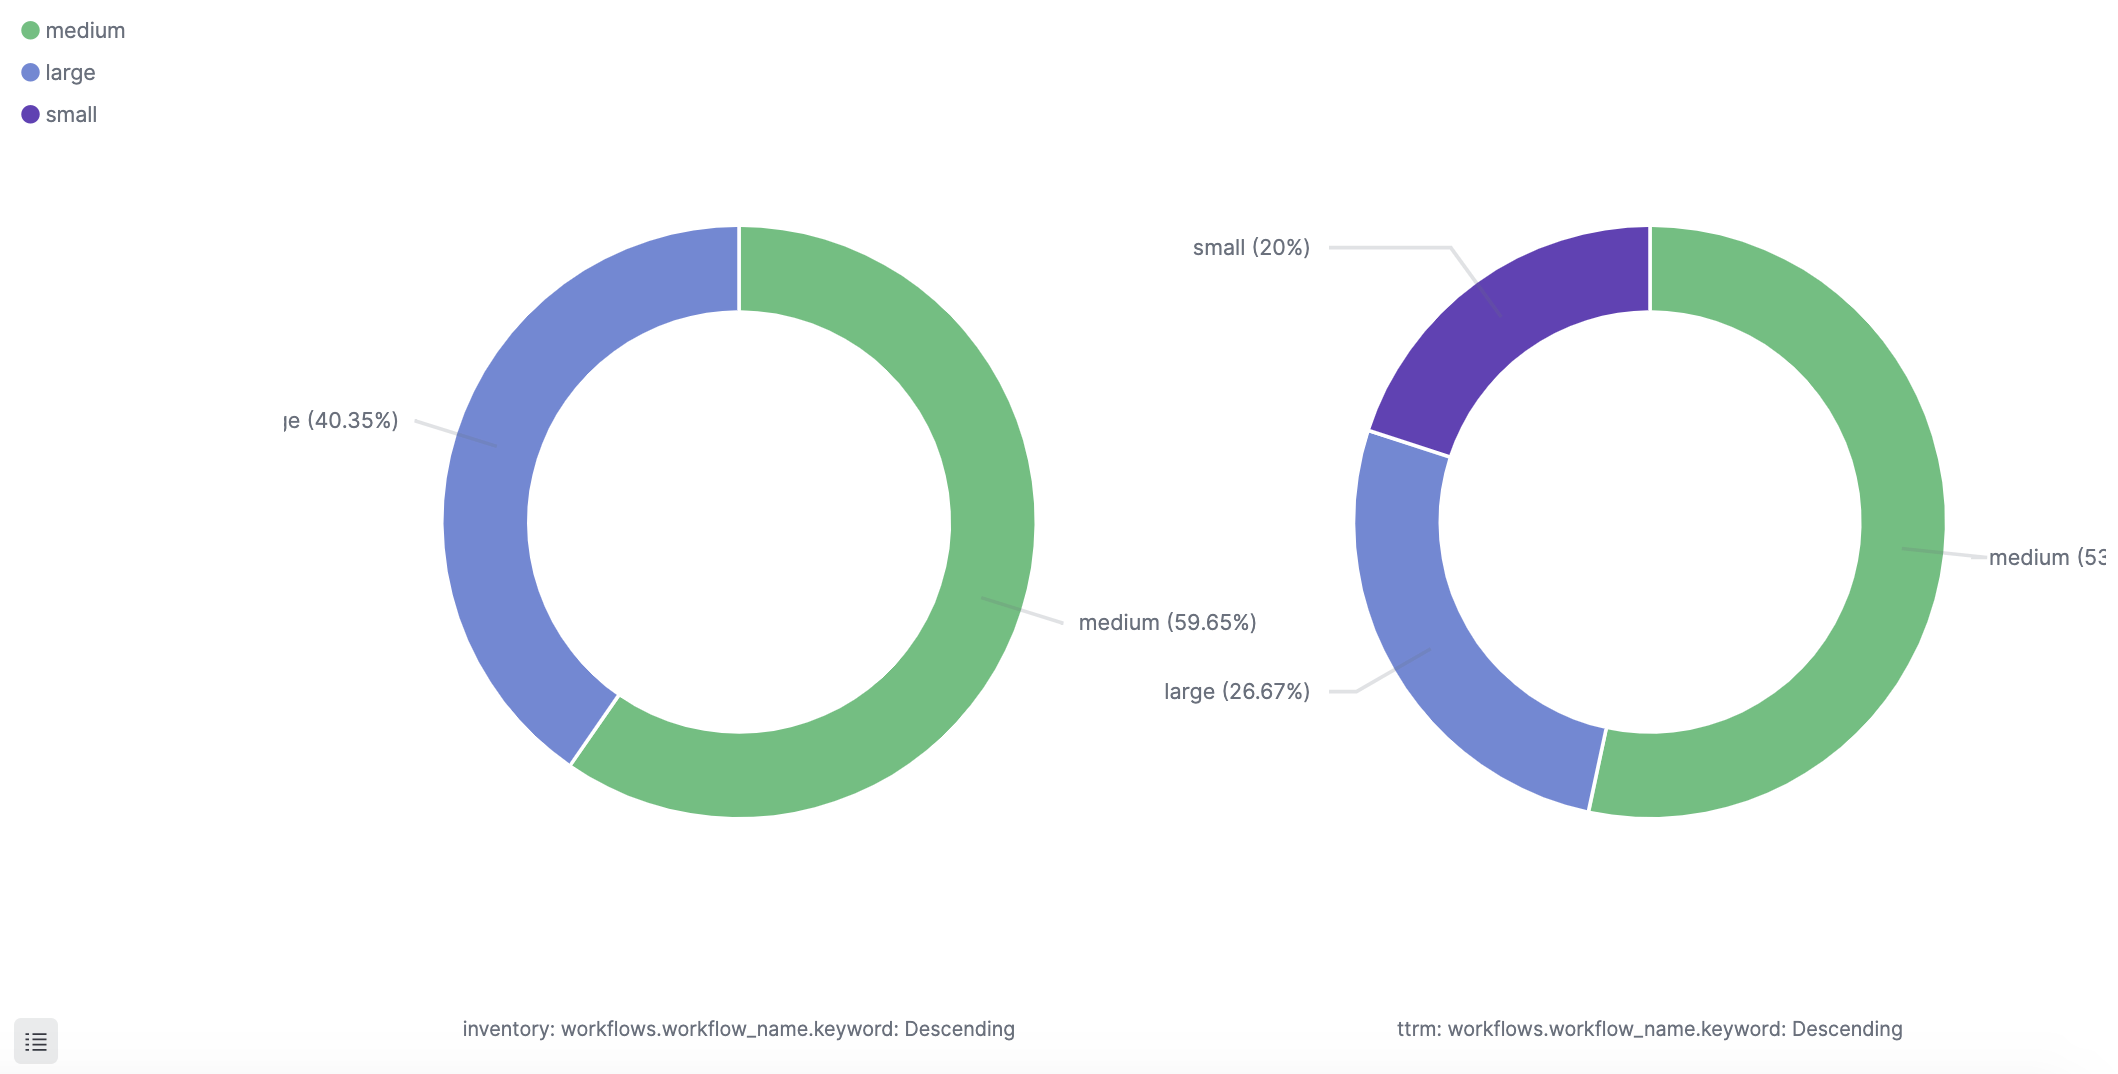
For the same reasons mentioned above, it could be beneficial to see a view of the class distribution per executors like the following example:

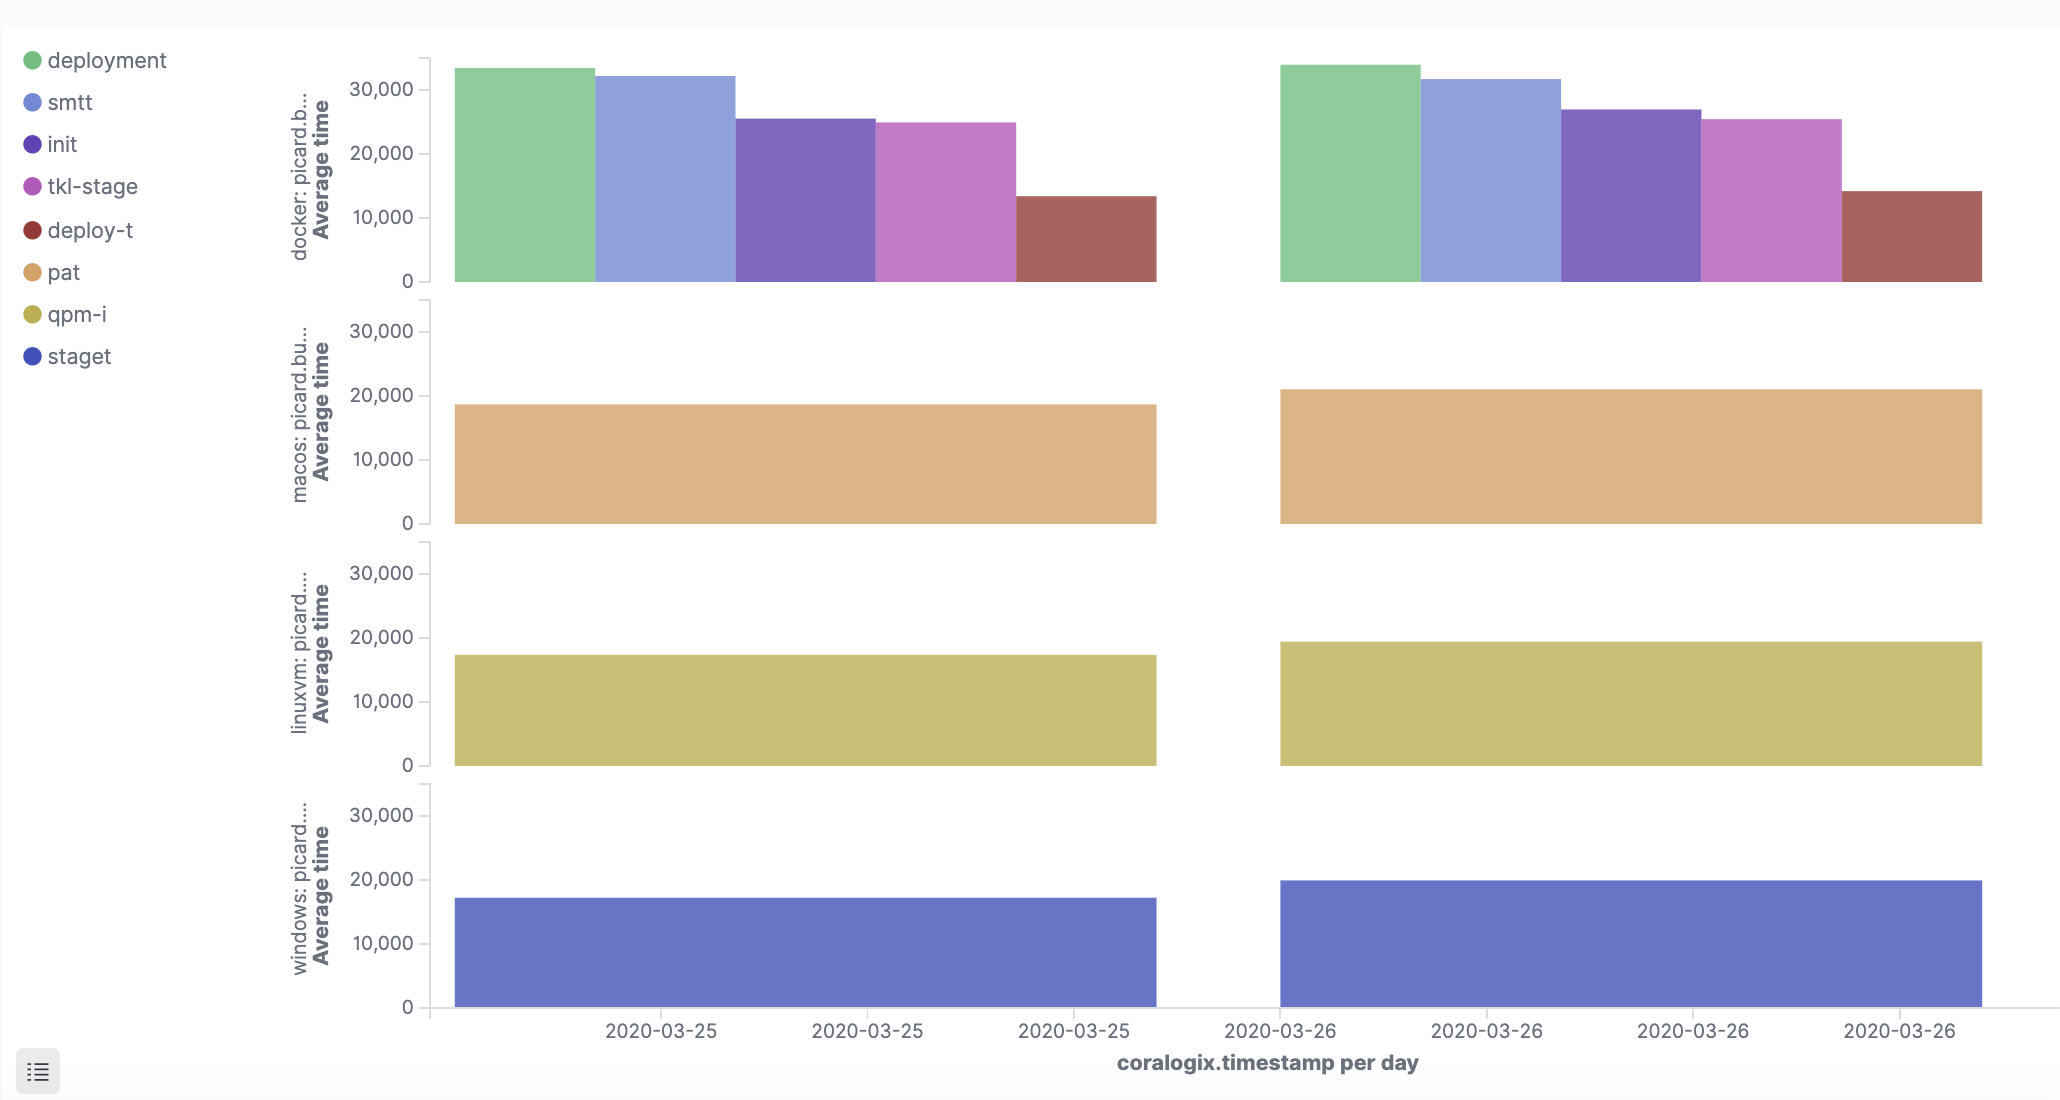
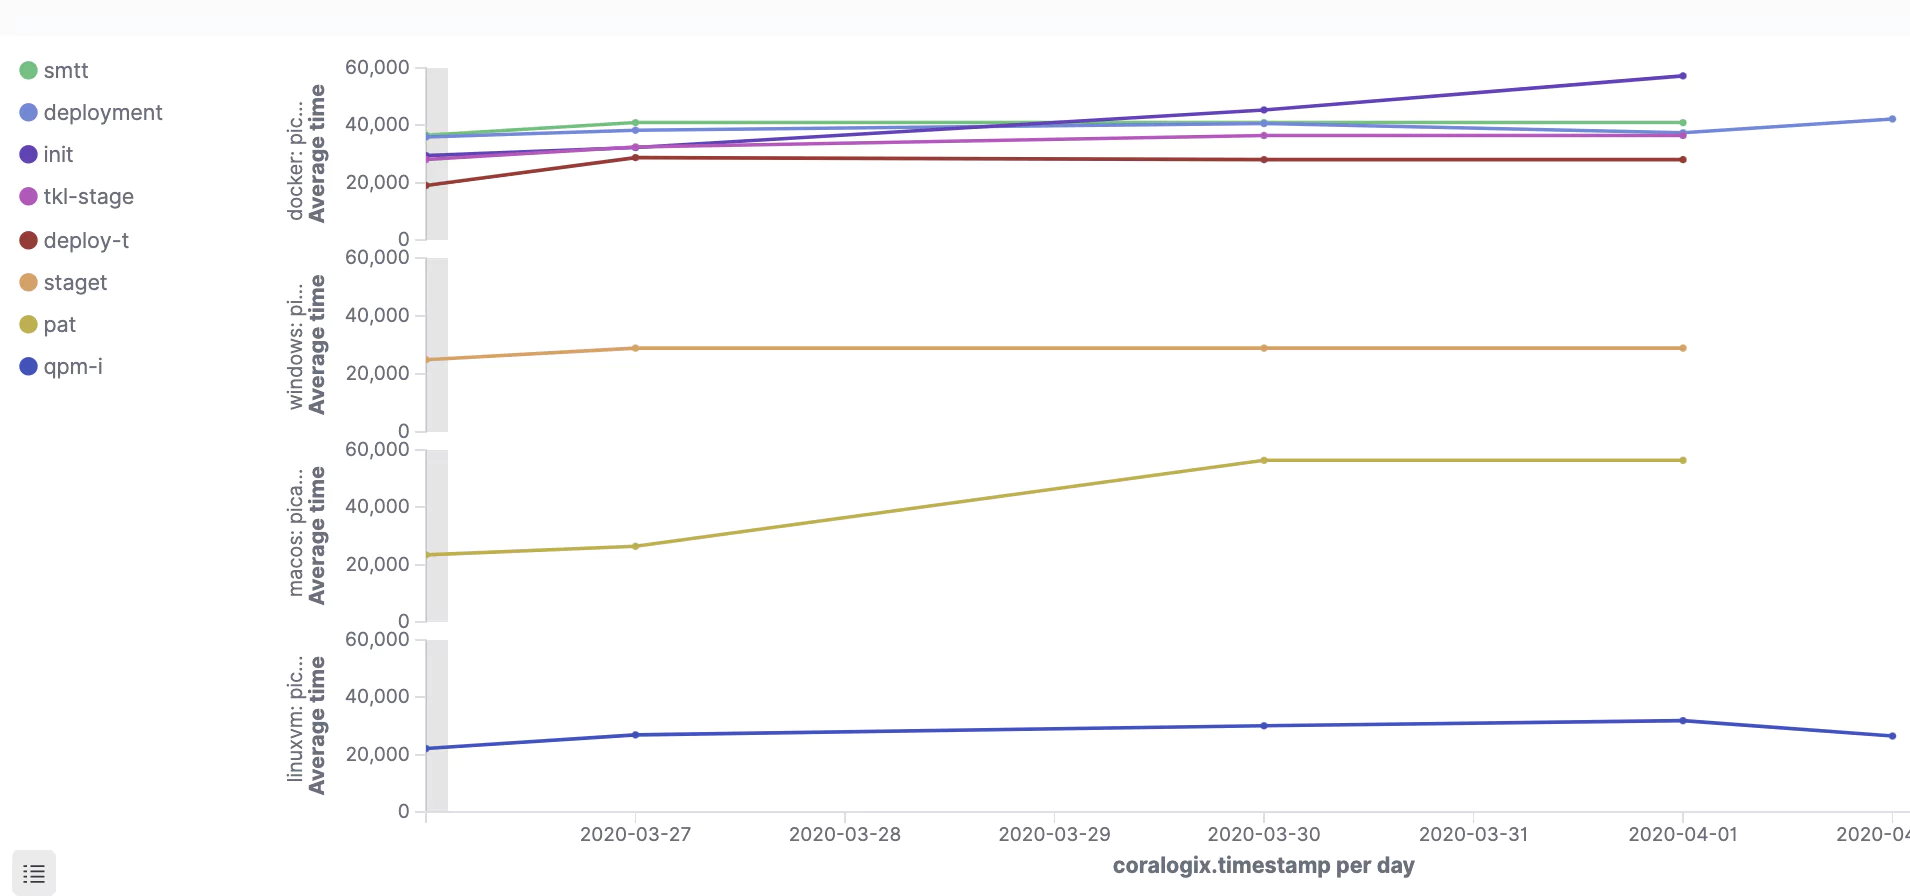
Average job runtime
The following visualizations help identify trends in job execution time, per build environment, and per executor. They give different perspectives on the average job runtime.
The first one gives an executor perspective for each job environment. It uses the ‘picard.build_agent.executor’ and the ‘build_time_millis’ to calculate the average per environment and per day (in this example day is the aggregation unit).
Depending on your needs, you can change the time frame for calculating the averages. It is important to note that the visualization should calculate the average time of successful job runs based on the filter ‘status:success’.
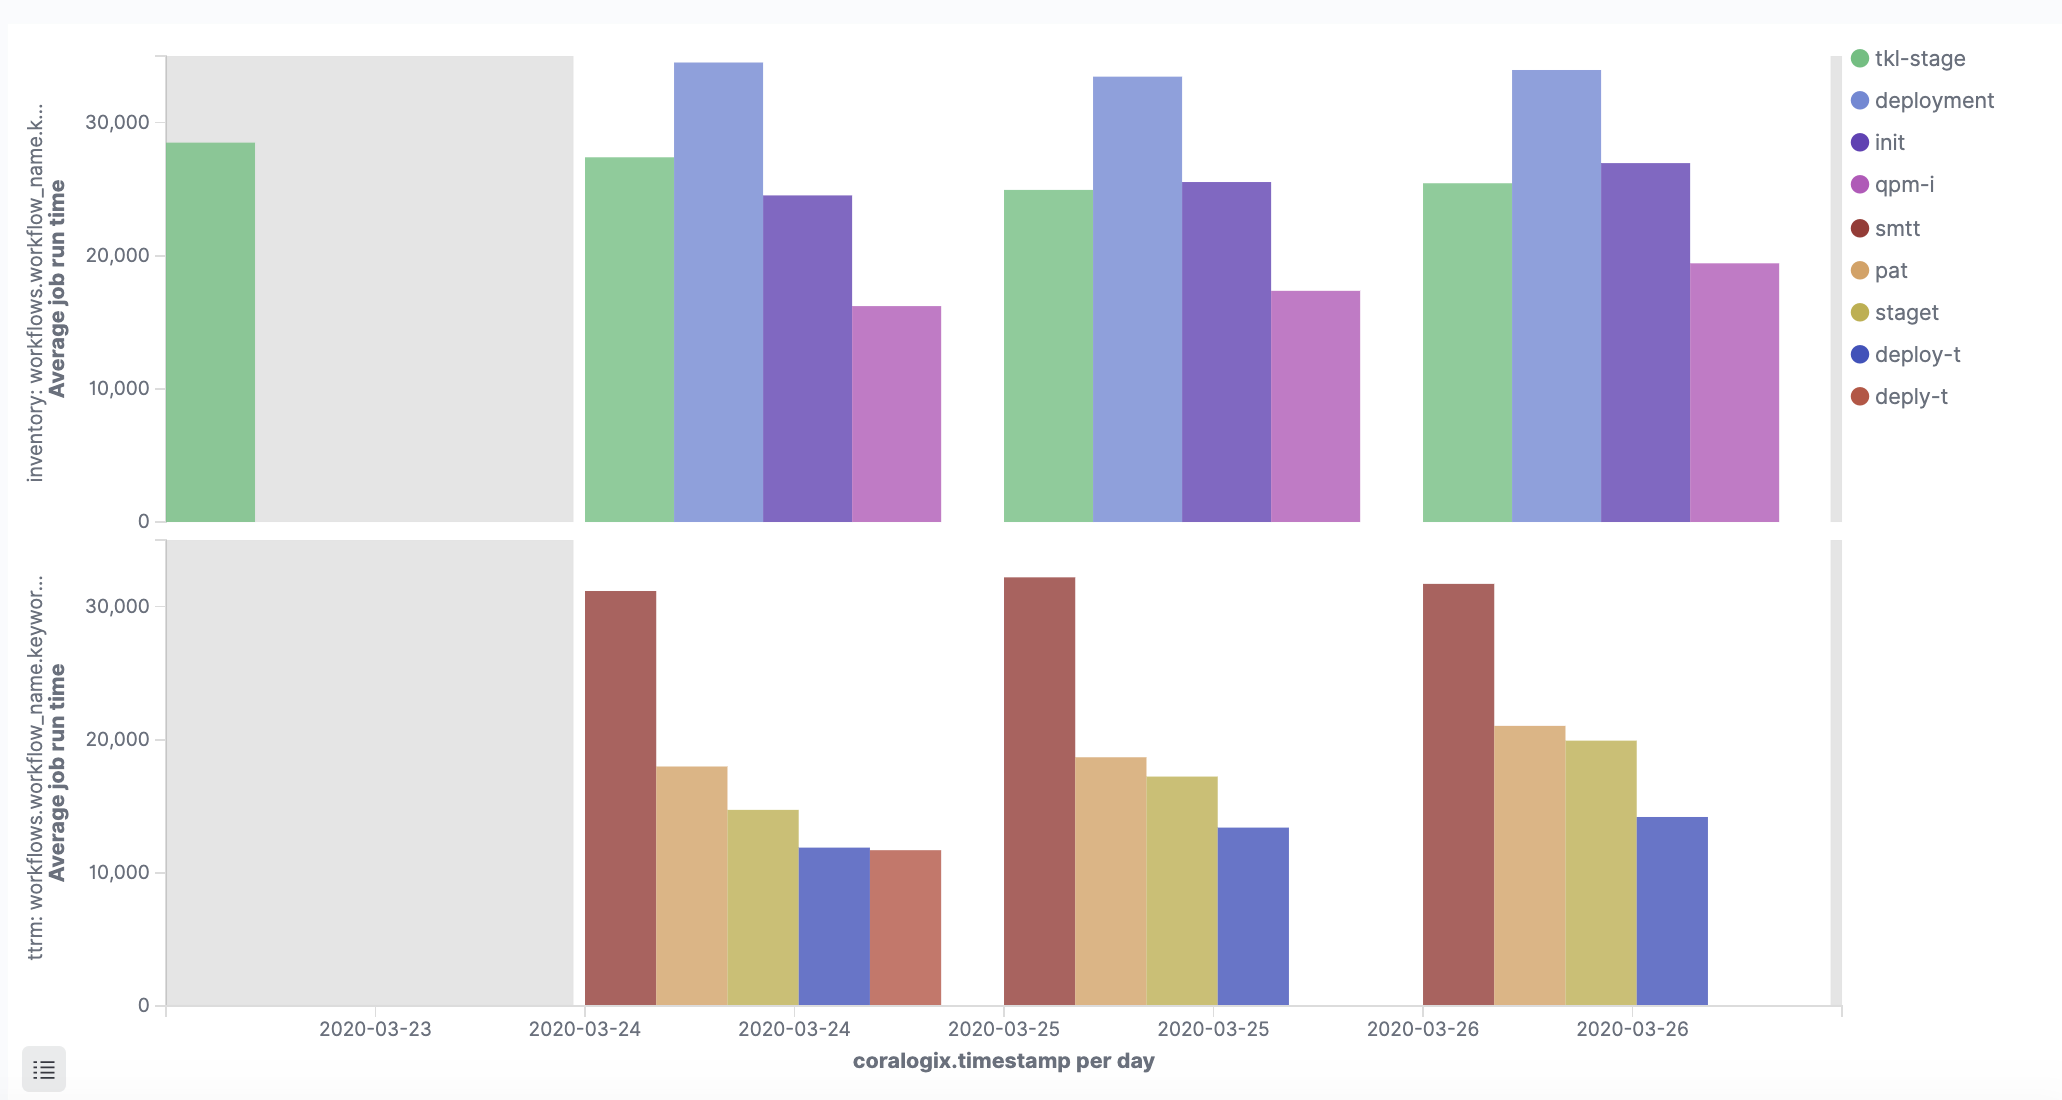
In a very similar way, this visualization shows the average job runtime per workflow, using the ‘workflows.workflow_name’ field:
This visualization shows the average job runtime for each job:
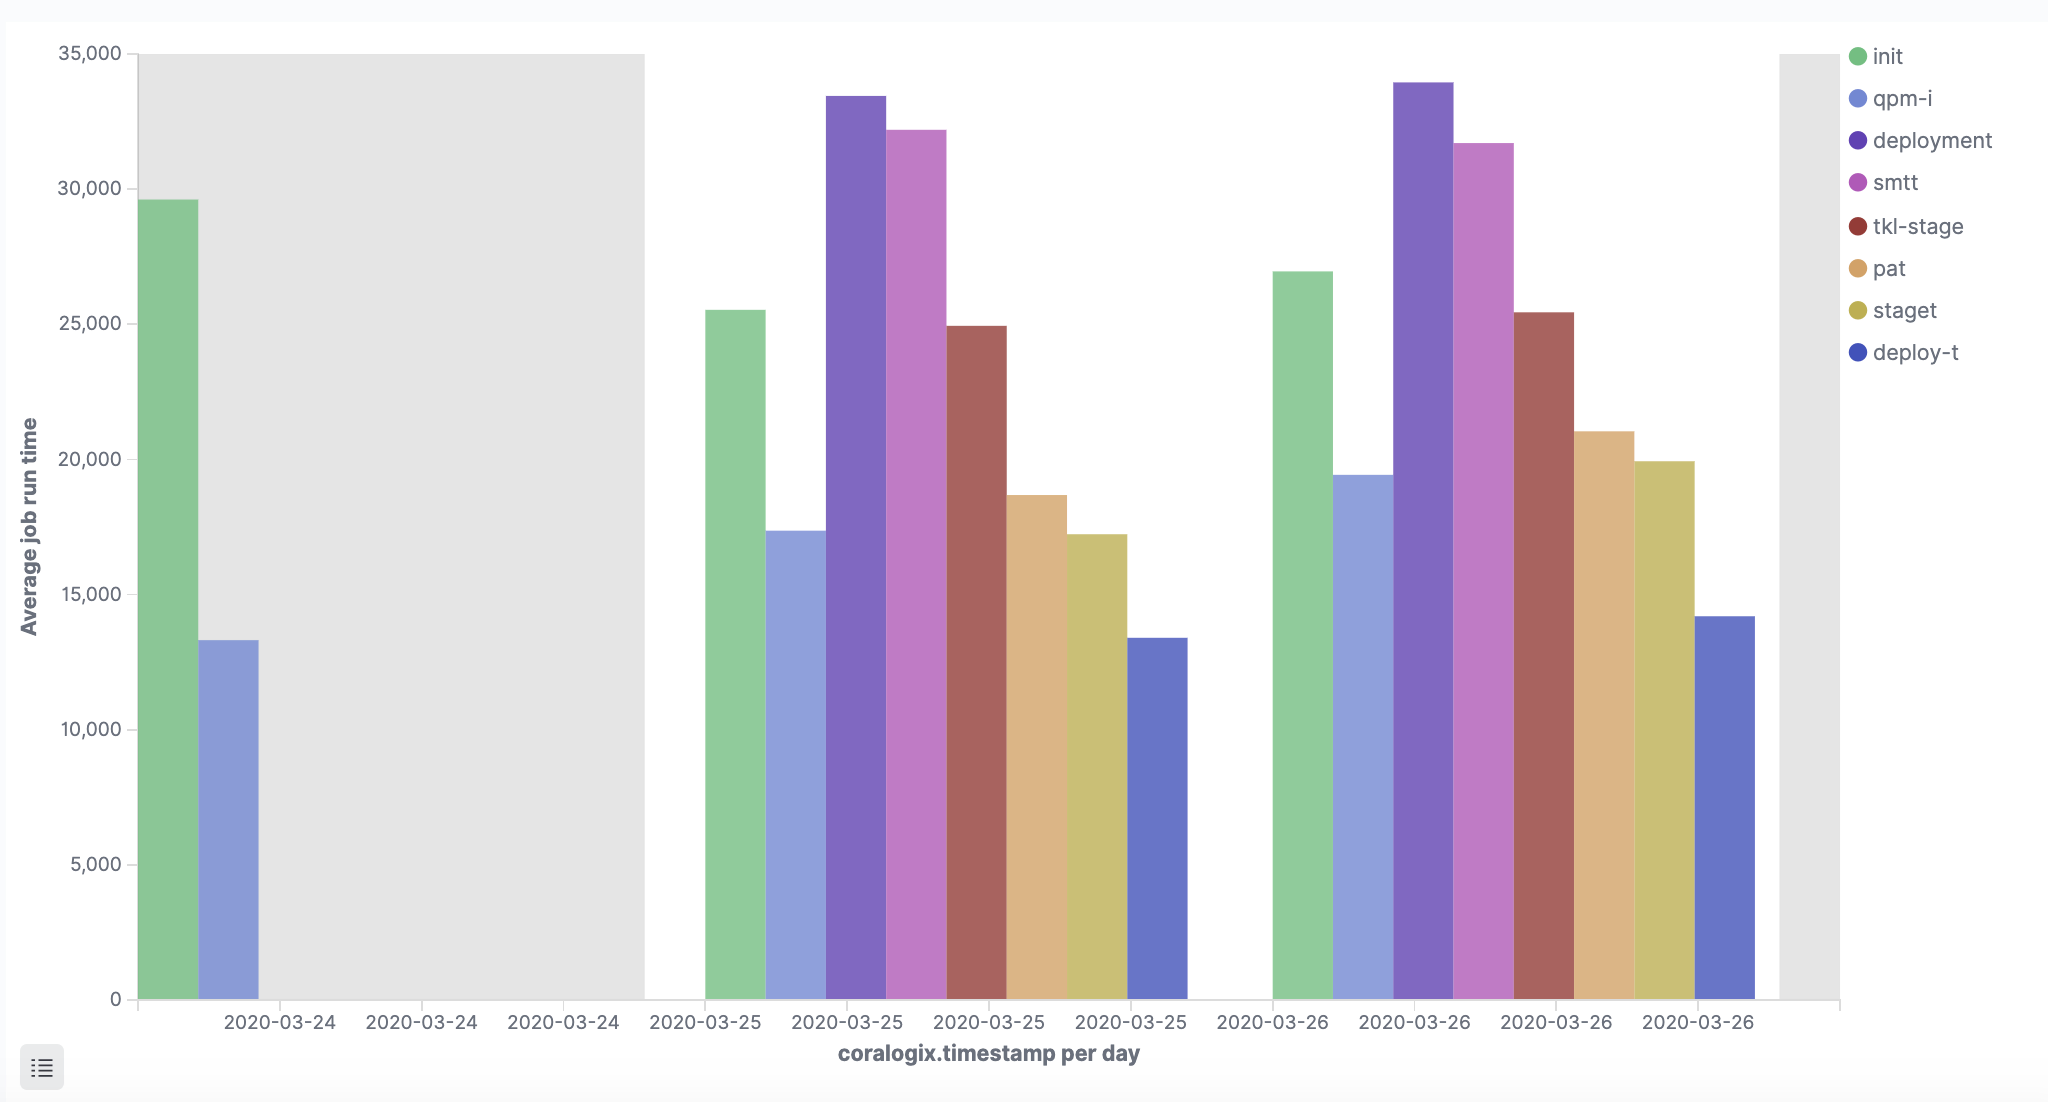
Depending on preference these visualizations can be configured to show a line graph. This is applicable to companies with higher frequency runs:
Job runs distribution per workflow
This visualization gives information about the number of runs for each workflow’s job. It can alert the analyst or engineer to situations where a job has more than the usual number of runs due to failures or frequent builds:
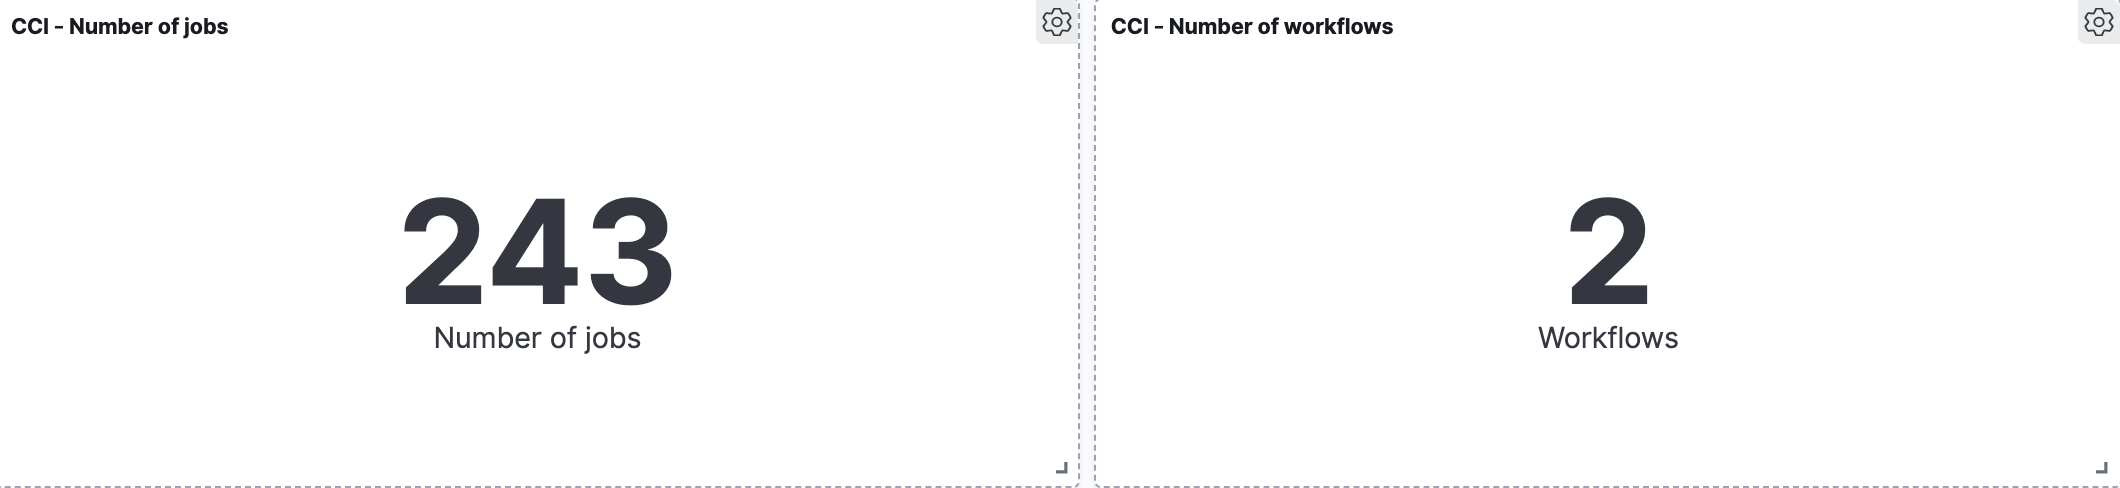
Number of workflows
These two are quite simple. Again, it is the user specific circumstances that will determine the time range for data aggregation.
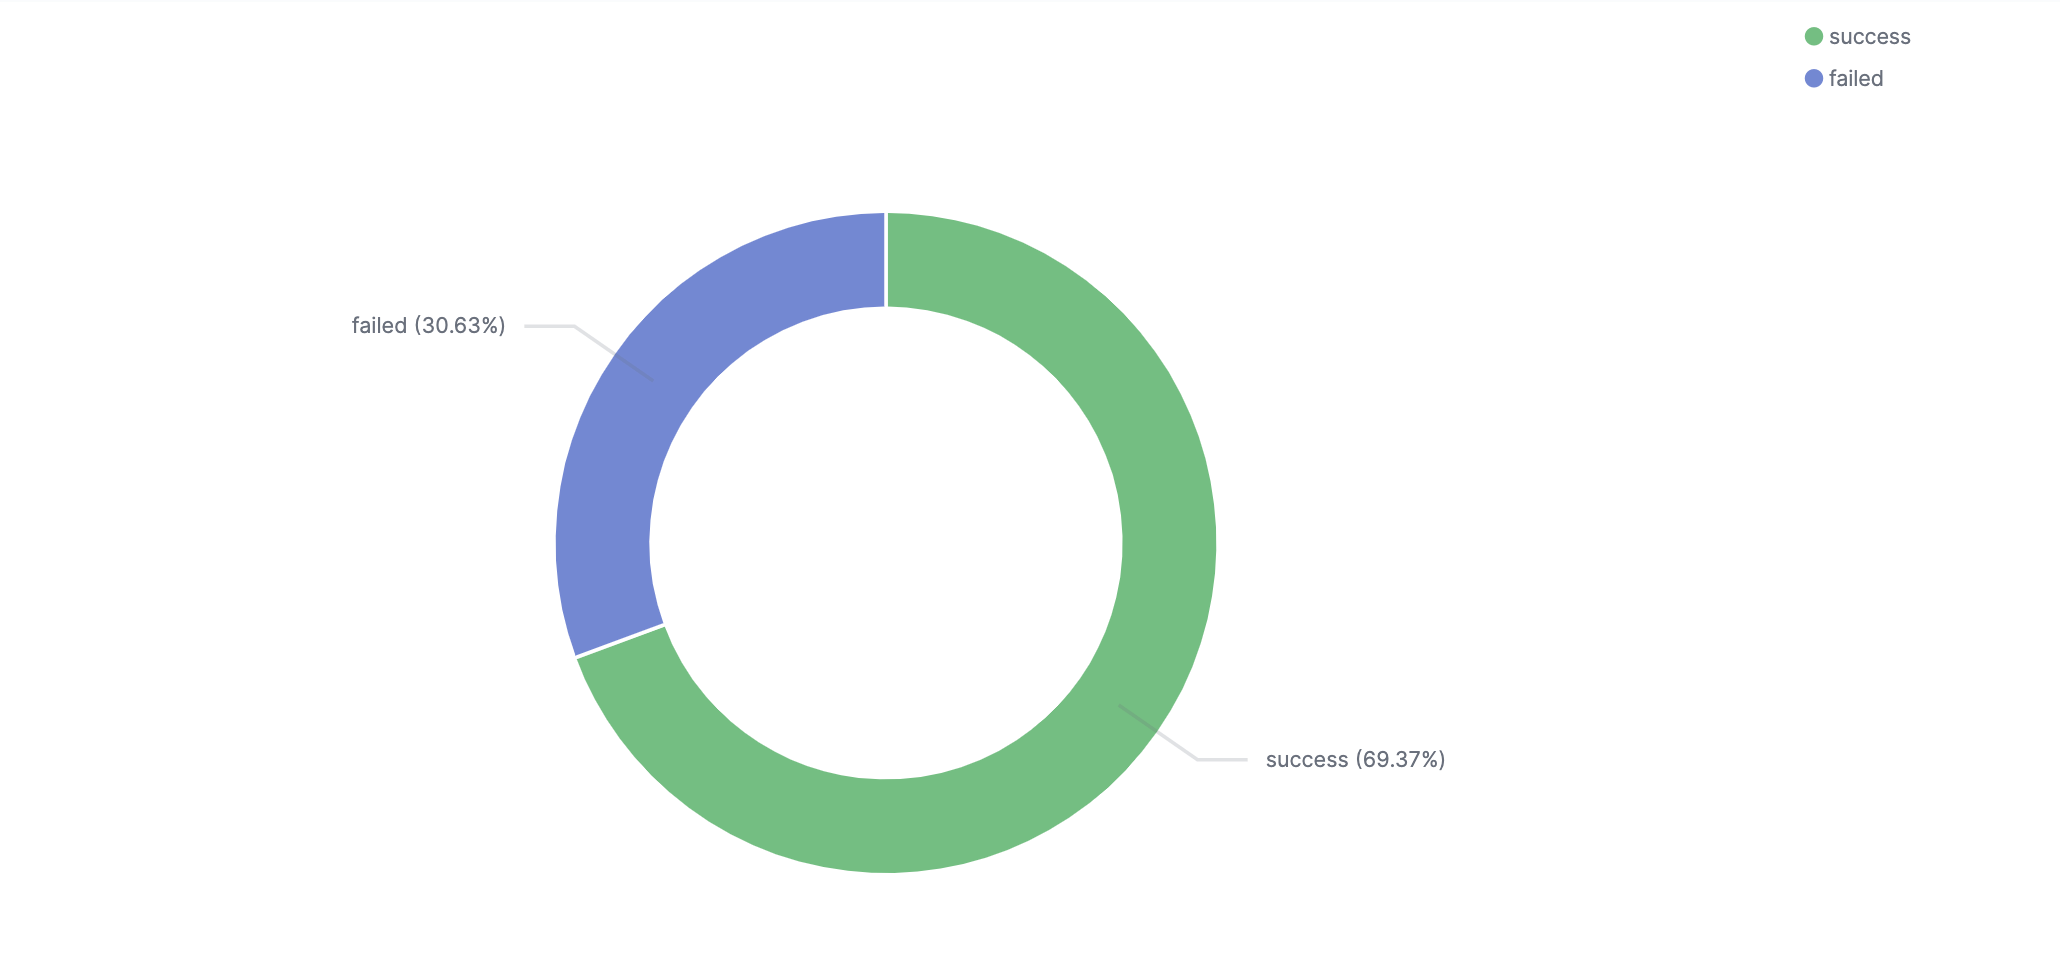
Job status ratio
This visualization shows the distribution of job completion statuses. There are four optional values; ‘success’, ‘onhold’, ‘failed’, and ‘cancelled’. The ‘onhold’ and ‘cancelled’ values are very rare. It is important to get visibility into the ratio as an indicator of when things actual do go wrong.
Alerts
In this section we will show how you can transform managing your deployment environment to be more proactive by using some of Coralogix’s innovative capabilities. Such as, its ability to identify changes from normal application behavior and the easy-to-use alert engine. Here are a few examples of alerts covering different aspects of monitoring CircleCI insights.
This tutorial explains how to use and define Coralogix alerts.
Job failure
This is an operational alert. It sends a notification when a job named ‘smtt’ fails.
Alert query:
workflows.job_name:smtt AND status:failed
If we have more than one job with the same name, running in different workflows, we can add the workflow name to the query, ‘AND workflows.workflow_name:CS’. The alert query can also be changed to capture a set of alerts based on a query language. For example ‘workflows.job_names:sm*’ or ‘workflows.job_names:/sm[a-z]+/’.
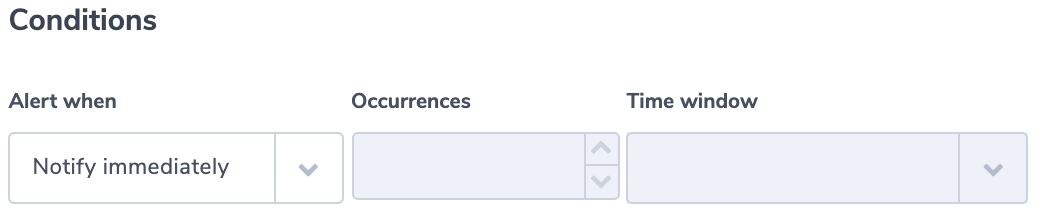
The alert condition is an immediate alert
Job duration
This is another example of an operational alert that sends a notification if a job runtime is larger than a threshold. We use ‘build_time_millis.numeric’. This is a numeric version Coralogix creates for every field. Since every job is different, the query for this alert can come with a job or workflow name. It can also look for outlier values like in this example:
Alert query:
build_time_millis.numeric:>20000
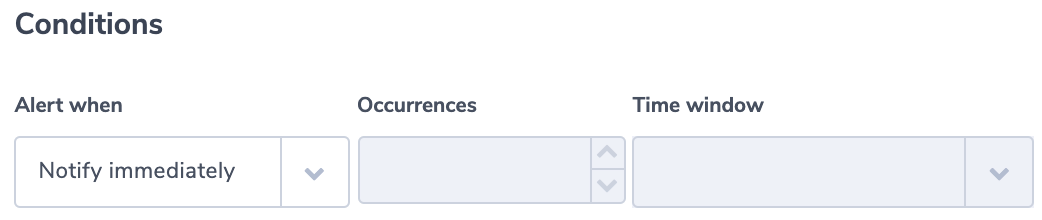
Alert condition:
Ratio of ‘failure’ compared to to all job runs is above the threshold
In this operational alert, a user will get a notification when the ratio of failed job runs to overall number of runs, is over a certain threshold. In this purpose, we’ll use the Coralogix ‘Ratio alerts’ type. For this alert type, users define two queries and then alert on the ratio between the number of logs in both queries’ results. Our query example counts the overall number of jobs and the number of failures:
Alert query 1:
status:*
Alert query 2:
status:failed
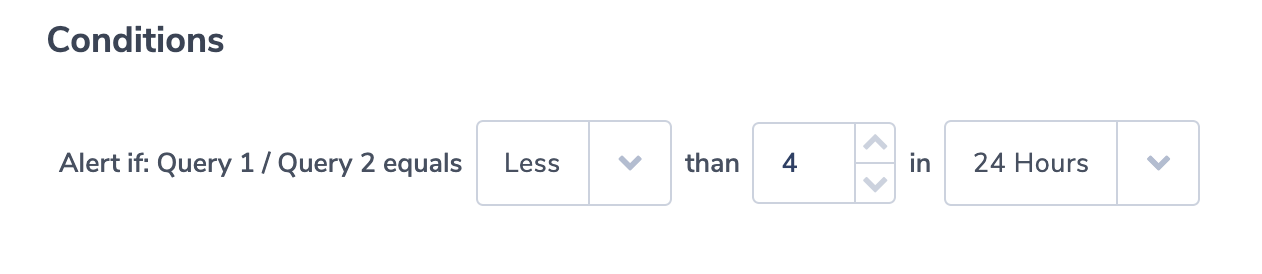
This condition alerts the user if failures are more than 25% of job outcomes:
SSH Disabled
This is a security alert. The field ‘ssh_disabled’ is a boolean field. When false, it indicates that users are running jobs and workflows remotely using SSH. For some companies, SSH runs will be considered a red flag.
Alert query:
ssh_disabled:false
Alert condition:
If choosing specific fields for the notification using the Coralogix Alert Notification Content, make sure you include ‘ssh_users’. Its value is an array of strings that includes the user names of the SSH users.
You can of course set security alerts based on other key-value pairs like ‘user.login’, ‘user.name’, or ‘picard.build_agent.instance_ip’.
As an example, this query will create an alert if picard.build_agent.instance_ip does not belong to a group of approved IP addresses that start with 170:
Alert query:
NOT picard.build_agent.instance_ip.keyword:/170.d{1,3}.d{1,3}.d{1,3}/
To learn more about keyword fields and how to use regular expressions in queries see our queries tutorial.
As you know each company has its own build schedule and configuration. One of the powers of Coralogix is its ease of use and flexibility, allowing you to take the concepts and examples found in this document and adapt them to your own environment and needs. We are always an email or intercom chat away.