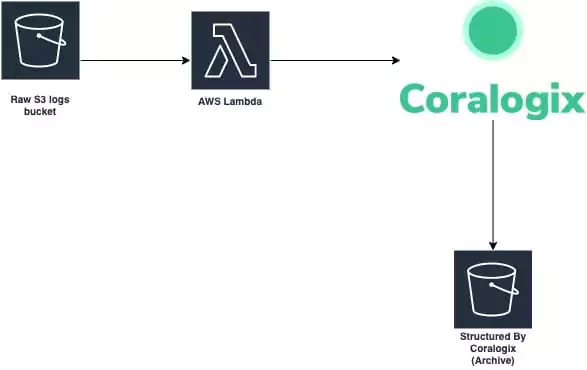
Coralogix and Sumo Logic are two different answers to the same observability platform decision. Where Coralogix processes telemetry in flight, stores it in your own Amazon Simple Storage Service (S3) bucket, and prices on data ingested, Sumo Logic keeps data in vendor-managed storage and, under its Flex model, bills for data scanned at query time.
Both platforms have introduced pricing and artificial intelligence (AI) changes in the past year, and those changes have widened the difference between them.
This guide covers how that architectural split plays out across pricing, core features, AI capabilities, security packaging, archive query, and support, then shows when each platform is the better fit.
What Is Coralogix?
Coralogix is a full-stack observability and security platform built to remove the two pressures this comparison keeps returning to: unpredictable monitoring costs and telemetry locked in a vendor’s store.
Sumo Logic is a cloud-native log analytics and security platform that ships log management, metrics, application performance monitoring (APM), security information and event management (Cloud SIEM), and security orchestration, automation, and response (Cloud SOAR) as modules under one software as a service (SaaS) contract.
Its Flex pricing model removes ingest charges for logs and bills for data scanned at query time, which shifts the cost driver from data volume to query behavior. The data lives in Sumo Logic’s vendor-managed storage, with retention and archive options that vary by plan.
Summary: Coralogix vs. Sumo Logic
The platforms differ across pricing, retention, archive query, AI, security packaging, support, trial access, and Federal Risk and Authorization Management Program (FedRAMP) status.
Flex pricing bills per terabyte (TB) scanned at query time (estimated $2.05 to $3.14/TB); log ingest is free
Data retention
Customer-controlled (your own S3; no Coralogix platform ceiling)
Long-term retention options available
Archive query
Direct query from S3 at no additional cost; no rehydration
Historical query options vary by retention path
AI capabilities
Olly (autonomous agent), Model Context Protocol (MCP) server, agentic command-line interface (CLI), AI Center with Guardrails, code agent observability
Dojo AI, Mobot conversational interface, security-focused AI agents
SIEM
In-stream Cloud SIEM included in base pricing
Cloud SIEM with separate security-oriented packaging
SOAR
Not offered (webhook integrations available)
Cloud SOAR and embedded automation capabilities
Support Service Level Agreement (SLA)
24/7 with a 17-second median response time; all customers
The differences above come down to where each product stores telemetry. The sections below work through them, starting with logs, metrics, traces, and alerting.
Core Features Across Logs, Metrics, Traces, and Alerting
Both platforms cover log aggregation, metrics collection, distributed tracing, and alerting. The differences appear in data correlation and query capabilities, especially around alerting logic.
Firing Alerts Before Data Reaches Storage
During an incident, the delay between an event occurring and an alert firing depends on when the platform evaluates the data. Coralogix processes all telemetry through its Streama in-stream engine before storing anything, so parsing, enrichment, alerting, and anomaly detection happen while data is still in flight, and Loggregation clusters logs into patterns automatically.
Sumo Logic evaluates alert conditions through monitors that continuously query logs or metrics after ingestion, at a frequency that depends on the underlying query and detection window.
Correlating Multi-Stage Incidents with Flow Alerts
A multi-stage outage or attack produces a separate alert for each condition under per-query alerting, leaving the on-call engineer to reconstruct the sequence by hand.
Flow Alerts remove that manual step by chaining multiple alert conditions in a logical sequence across data types, firing only when a specific pattern of events occurs in order. A single Flow Alert can connect Domain Name System (DNS) activity, elevated frontend traffic, a suspicious Internet Protocol (IP) range, and data exfiltration signals into one P1 alert that triggers only if all four conditions appear within a defined time window.
Sumo Logic’s monitors evaluate threshold and anomaly conditions on individual queries, so correlating a sequence of events across signal types means configuring separate monitors.
Query Languages: DataPrime vs. Sumo Query Language
DataPrime uses a pipe-based syntax with explicit source declarations spanning logs, metrics, and traces, so a single query language filters and aggregates across signal types without switching views.
Sumo Logic’s Search Query Language is also pipe-based, but logs, metrics, and traces each get their own query experience. For an engineer mid-incident, that means one query workflow instead of three.
AI Capabilities: Coralogix vs. Sumo Logic
Both platforms have invested in AI-assisted troubleshooting, but their approaches target different workflows. Coralogix’s AI focuses on Site Reliability Engineering (SRE) and platform engineering investigation, while Sumo Logic’s AI direction leans more toward security operations and security operations center (SOC) analyst use cases. If your team is evaluating AI features, the practical question is which workflows each vendor supports most directly.
Coralogix: Olly, MCP Server, and AI Center
Olly, Coralogix’s autonomous observability agent, targets the investigation problem directly: it answers natural-language questions across logs, metrics, and traces, and supports incident triage and root cause analysis, so an investigation starts from a question instead of a query.
For teams wiring AI coding agents into operations, the Coralogix CLI and MCP server give those agents headless access to the same observability data. Teams shipping large language model (LLM) applications get observability and governance from AI Center, with real-time LLM evaluators and AI Guardrails that can block unsafe interactions before they reach users.
Sumo Logic: Dojo AI and SOC Analyst Agent
Sumo Logic’s AI portfolio centers on Dojo AI, its agentic AI platform for security operations, with Mobot as the conversational interface and agents that summarize insights and assist triage. Its SOC Analyst Agent, in preview, applies agentic reasoning to shorten security investigation workflows. The portfolio’s center of gravity sits in the SOC, which matches Sumo Logic’s security-led packaging.
What Each Platform Includes for SIEM, SOAR, CSPM, and SSPM
Running observability and security as separate products means two ingestion pipelines, two contracts, and the same telemetry paid for twice. Security packaging decides how much of that duplication a platform removes.
If your use case spans observability and security together, these boundaries shape the budget before any feature comparison starts.
Capability
What it covers
Coralogix
Sumo Logic
SIEM
Detecting threats across your logs and security telemetry
Cloud SIEM included in base pricing; security data runs on the same in-stream pipeline as logs, metrics, and traces
Cloud SIEM with separate security-oriented packaging, behavioral analytics, and curated content for SOC teams
SOAR
Automating the response after a threat is detected
Not offered; webhook integrations connect external tools, including Cortex XSOAR incident creation
Cloud SOAR as a separate product, with automation capabilities inside Cloud SIEM
Posture management (CSPM, SSPM, AI-SPM)
Finding risky configurations in cloud infrastructure, SaaS applications, and AI systems
All three included in base pricing with no separate licensing
Teams that want SOC coverage without staffing one get a managed option on the Coralogix side: Snowbit, Coralogix’s managed security arm, provides 24/7 managed detection and response (MxDR).
Snowbit analysts triage alerts, build custom detection rules, and run threat-hunting campaigns inside your Coralogix tenant, working from the same data the engineering team already ships. The platform maintains certifications and compliance coverage including SOC 2 Type II, ISO 27001, ISO 27701, PCI DSS, HIPAA, GDPR, DORA, and ISO 42001-aligned AI governance.
Ingestion-Based vs. Scan-Based Pricing Models
Sticker-price comparisons mislead without billing-model context. Coralogix charges based on ingestion volume per signal, while Sumo Logic ties more of the bill to scans and packaged credits. That difference determines cost behavior beyond headline rates.
Built-In Cost Reduction with Coralogix
Coralogix charges based on the volume and type of data you ingest, with no per-user, per-host, or per-query charges for its core observability pricing. The TCO Optimizer routes data into Frequent Search, Monitoring, Compliance, and Blocked pipelines based on policies you define for each data stream, so low-priority data stops billing at the full rate.
Retention costs follow the same logic, set by your object storage choices instead of a platform rehydration charge; the archiving section below covers the mechanics.
How Sumo Logic Flex Pricing Compares
Sumo Logic’s Flex pricing charges for data scanned at query time, not data ingested: log ingestion is free, and the pricing page estimates $2.05 to $3.14 per terabyte (TB) scanned depending on your analytics usage profile. Every dashboard refresh, monitor evaluation, and ad-hoc search consumes scan credits, so monthly cost scales with how often your team queries data, not only with data volume. Flex is the default model for new customers, while some existing customers remain on Sumo Logic’s older tiered plans.
What a Typical Workload Costs on Each Platform
A mid-size Kubernetes platform ingesting 180 GB/day of logs, 5 GB/day of traces, and minimal metrics illustrates the cost difference between the two billing models.
Component
Coralogix
Sumo Logic
Logs (5,400 GB/month)
5,400 × $0.42 = $2,268
Log scan costs vary with search frequency
Traces (150 GB/month)
150 × $0.16 = $24
Trace charges depend on credits and packaging
Monthly total
~$2,292 before storage
Requires vendor quote
Coralogix produces a deterministic total from published rates, while Sumo Logic’s total depends on query frequency and packaging, so an exact comparison requires a vendor quote. The Coralogix costs below use published rates, with the scan-based structure described earlier applied to Sumo Logic.
Archiving and Archive Query: Who Controls Retention
The two platforms approach historical data with different architectures, and the difference shows up in both retention cost and how fast a historical query returns. For teams where retention policy drives the buying decision, this section carries the most weight in the comparison.
Who Sets the Retention Limit
Coralogix writes ingested data to your own S3 bucket (or Google Cloud Storage on the US3 environment) in open Parquet format. Your cloud storage lifecycle policies control retention, not a Coralogix-imposed limit. Whatever your compliance team sets as the retention window, the platform never caps it.
Sumo Logic supports long-term retention within its platform, with archive options for data beyond primary retention windows. Cost-reduced retention depends on plan and archive path. Sumo Logic’s plan structure sets the retention ceiling.
Direct Archive Query Without Rehydration
Sumo Logic provides multiple paths to historical data, and querying archived data means re-ingesting it: customers create an ingestion job that pulls archived logs from S3 back into the platform before searching them.
During an investigation, that adds a restore step, and a wait, between the question and the answer. Storage and retrieval characteristics also vary by plan and archive path, so the retrieval workflow depends on how the data was archived in the first place.
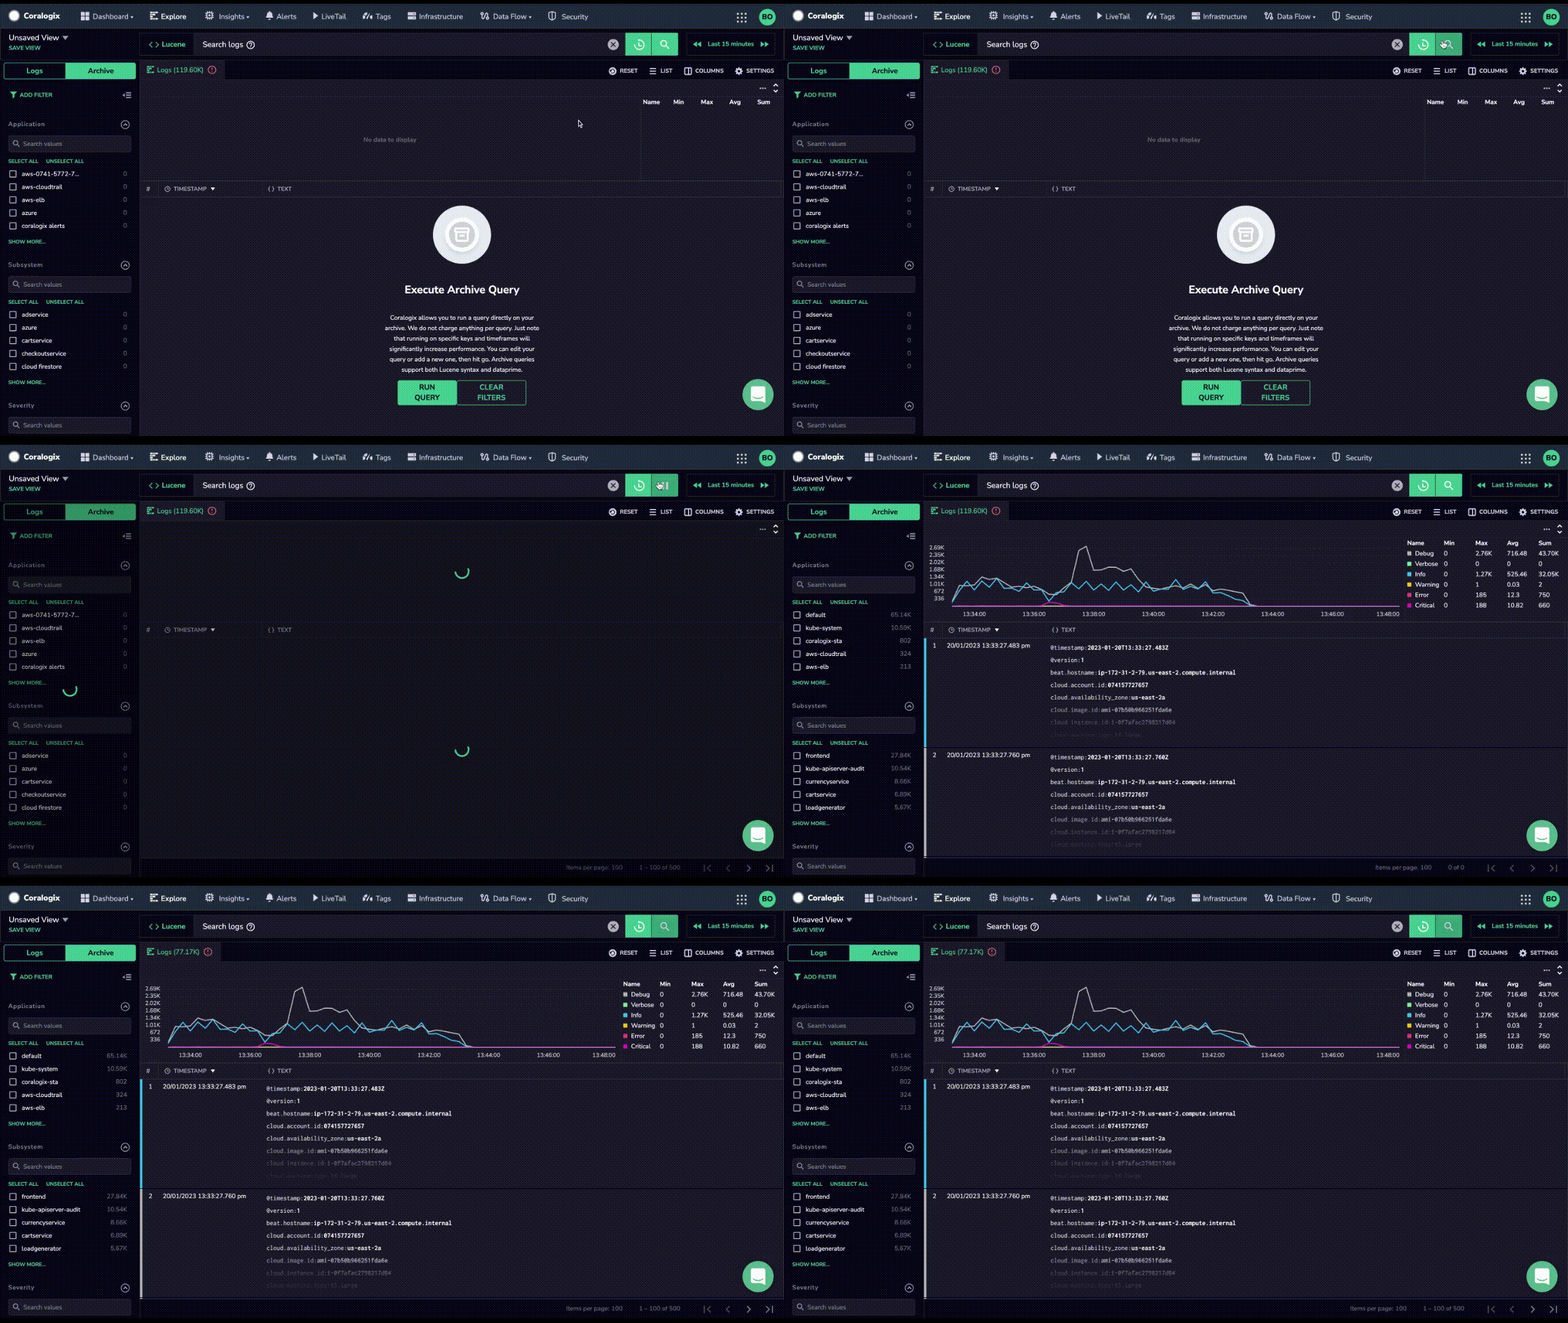
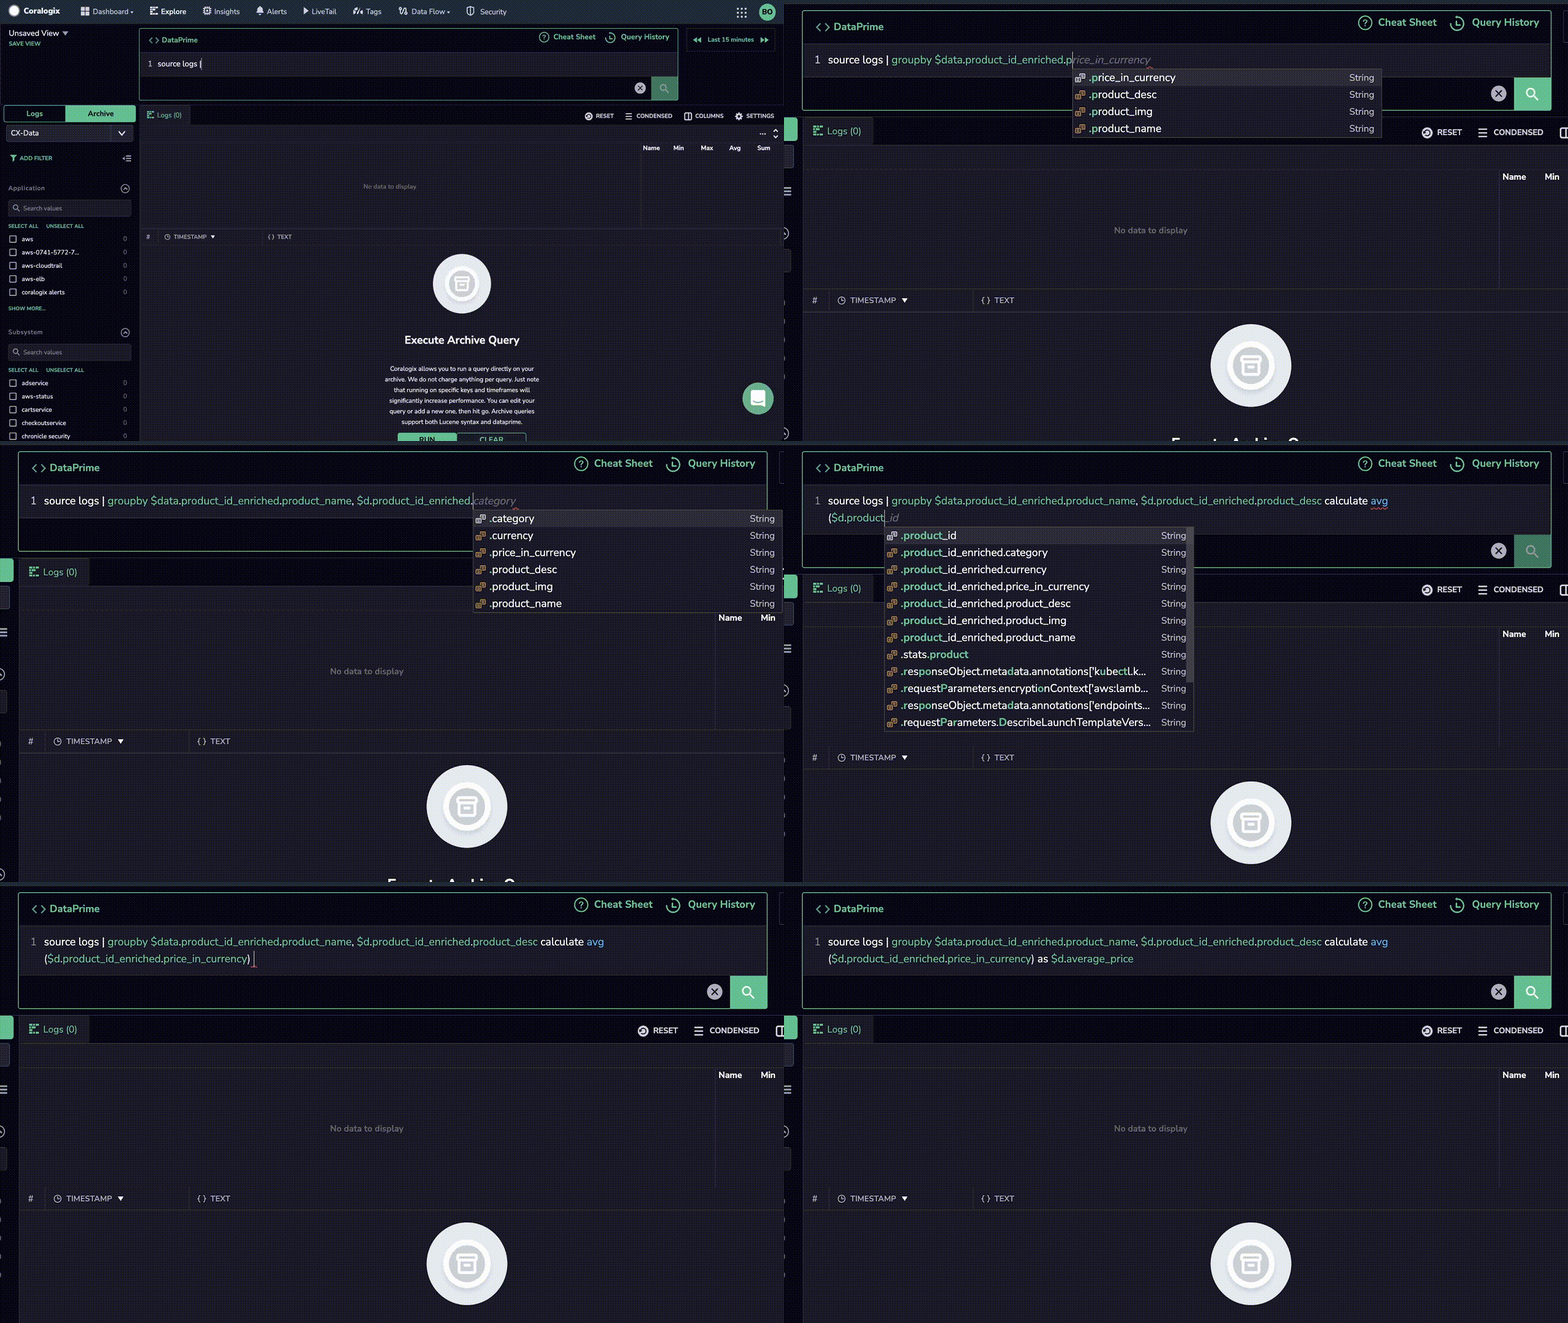
Coralogix supports remote, index-free querying directly against your S3 archive from the platform user interface, with no rehydration or re-indexing step. Your team can query archived logs and spans in S3 using DataPrime, Lucene, or Structured Query Language (SQL) syntax. All data lives in customer-owned S3, and archive queries carry no additional platform cost, so long-term retention stays predictable. A historical query starts when the question does.
Customer Support Tiers vs. One SLA for All Customers
Support tiers decide who waits during an incident: when faster response sits behind a Premium add-on, the on-call team on a Standard plan waits longest at the worst possible time. Sumo Logic tiers support across Professional, Enterprise, and Premium plans, and its shortest response time SLA is 0.5 hours for P1 issues on the Premium support tier.
Coralogix removes the tiering entirely: every customer gets 24/7 support with a 17-second median response time, regardless of spend. That takes support quality out of the contract negotiation.
Onboarding follows the same model. Coralogix offers free expert onboarding to every customer, with Technical Account Managers who support the rollout and migration. Sumo Logic includes a named Technical Account Manager and recurring status calls as part of its Premium support plan.
Coralogix vs. Sumo Logic: Which One to Choose
The decision comes down to which requirements are driving your evaluation.
When Coralogix Is the Better Fit
Coralogix is built for platform engineering and SRE teams that need logs, metrics, traces, security, and AI observability in a single platform with predictable costs and data ownership. Ingestion-based pricing produces a monthly total you can calculate before signing, and your telemetry lives in an S3 bucket you control, not a vendor’s store.
Those cost and data-ownership advantages grow more pronounced as data volumes increase, which is why teams reaching renewal with rising scan or credit bills tend to land here.
When Your Requirements Point to Sumo Logic
Two requirements favor Sumo Logic. If FedRAMP authorization is a hard procurement requirement today, Sumo Logic holds FedRAMP Moderate and Coralogix’s authorization is still in process. If you need built-in SOAR, Sumo Logic packages Cloud SOAR as a product, where Coralogix relies on webhook integrations to external tools. For every other driver in this comparison
If a hard FedRAMP requirement or built-in SOAR sits at the top of your list, Sumo Logic meets it today. For every other driver in this comparison, the question is whether your next renewal turns on security packaging or on growing data volume, and that answer points back to the architecture each platform is built on.
Predictable Costs and Data You Own: The Coralogix Approach
The comparison comes down to where each platform puts control. Coralogix processes telemetry through Streama before storage, writes it to an S3 bucket you own, and bills on rates you can calculate from a published price list, while Sumo Logic keeps data in vendor-managed storage and ties the bill to the volume of data scanned at query time, which moves with how often teams run dashboards, monitors, and searches.
Every difference this guide covered, from in-stream alerting to remote archive querying to support without tiers, follows from that architectural choice.
If you want to see what your current data volume would cost under ingestion-based pricing, try Coralogix for free and run the numbers against your own telemetry. The 14-day trial includes full feature access with no credit card required.
Frequently Asked Questions About Coralogix vs. Sumo Logic
Is Coralogix cheaper than Sumo Logic?
Coralogix produces a deterministic monthly cost from its published per-GB rates, with no query fees. Sumo Logic’s Flex pricing charges for data scanned at query time, so total cost depends on search behavior as well as data volume.
Does Sumo Logic have a free tier?
Sumo Logic offers a 30-day free trial, and its pricing page does not list an ongoing free plan. Coralogix offers a 14-day trial with eight units of data, full feature access, unlimited users, and no credit card required.
Can I migrate from Sumo Logic to Coralogix?
If your team already runs Sumo Logic’s OpenTelemetry Collector, the data ingestion migration consists primarily of reconfiguring the OpenTelemetry Protocol (OTLP) exporter endpoint. Coralogix includes free onboarding support with expert engineers who handle dashboard migration, DataPrime education, and alert configuration.
Does Coralogix support FedRAMP workloads?
Coralogix is in process for FedRAMP, with Department of Education sponsorship, but authorization is not yet complete. Sumo Logic holds FedRAMP Moderate authorization. If FedRAMP is a hard procurement requirement today, Sumo Logic is the compliant choice.
Coralogix and New Relic both cover the full observability surface, but they charge for it and store it in different ways. One prices purely on data ingested and writes telemetry to a bucket you own, while the other combines ingest pricing with per-user licensing and retains data in its own backend.
This guide covers how the two platforms compare on core features, pricing structure, AI observability, archiving and retention, security coverage, and support, then shows when each one is the stronger choice.
What Is Coralogix?
Coralogix is a full-stack observability platform whose architecture targets the two line items that grow fastest on a New Relic bill: user licensing and vendor-side retention.
New Relic is a full-stack observability platform that runs on a usage-based model combining per-gigabyte ingest with per-user fees. It treats OpenTelemetry (OTel) as a first-class ingestion path alongside its own agents, with application performance monitoring (APM) as its historical core strength. As of June 2026, a free tier covers 100 gigabytes of ingest per month with core platform features included.
Coralogix vs. New Relic: What Are the Key Differences?
For high-volume, cloud-native teams, the most important differences involve data volume, user count, and compliance requirements. Each dimension reflects how the platform is built, not a feature checkbox.
Dimension
Coralogix
New Relic
Pricing model
Ingestion-based, with no per-host, per-query, or per-feature charges
Per-gigabyte ingest ($0.40/GB, or $0.60/GB with Data Plus, beyond 100 GB/month free) plus per-user fees
Security capabilities center on vulnerability management
Support
24/7 support included for all customers; 17-second median response
Varies by edition; ticketed support on Standard, faster critical-response commitments on Pro and Enterprise
Coralogix prices and stores data on your side of the account boundary, while New Relic prices access to its platform. Each section below shows what the difference costs in practice.
Core Features: Logs, Metrics, Traces, and Alerting
Coralogix and New Relic support core observability workflows across logs, metrics, distributed traces, APM, real user monitoring (RUM), and infrastructure monitoring. Feature parity at this level means the comparison turns on how each platform handles the work around the signals: correlating them during an investigation and alerting them without noise.
Coralogix covers that baseline with an OpenTelemetry-native architecture and no proprietary agents, including Kubernetes observability and a service catalog with service level objective (SLO) tracking.
Data Correlation and Usability
Investigations stall when each telemetry type lives behind its own query tool, because every context switch resets an engineer’s train of thought mid-incident. Coralogix supports querying logs, metrics, and traces across its platform, using the piped DataPrime query language, with Lucene available for hybrid queries and PromQL supported separately for metrics dashboards.
New Relic Query Language (NRQL) covers similar cross-telemetry ground, so the separation shows up when the query language itself becomes the obstacle.
Olly, Coralogix’s autonomous observability agent, takes a plain-English question, runs the investigation itself, and returns the root cause with the affected code path, no DataPrime required.
Alerting Across Logs, Metrics, Traces, and Security Events
Multi-signal incidents produce alert noise when each signal fires its own notification: a latency spike, an error-rate alarm, and a security event arrive as three pages instead of one diagnosis. Flow Alerts treat the sequence itself as the alert condition across logs, metrics, traces, and security data: condition A followed by condition B inside a set window fires one priority-one (P1) notification, and an incomplete pattern fires nothing.
AI Capabilities: Coralogix vs. New Relic
Both vendors instrument large language model (LLM) workloads, but they answer different questions. New Relic tracks the operational metrics of artificial intelligence (AI) calls, while Coralogix also evaluates the outputs those calls produce, with built-in guardrail enforcement on top. That difference in scope is where the two platforms separate.
How Coralogix AI Center Evaluates LLM Outputs
A passing health check says nothing about whether the model hallucinated, drifted off topic, or leaked personally identifiable information (PII) in a response. AI Center, launched following the December 2024 acquisition of Aporia, answers that question directly: its Evaluation Engine runs evaluators, small evaluator models with optional custom rules, that score every prompt and response for faithfulness, relevance, toxicity, and PII leakage.
Past detection, AI Guardrails block, rewrite, or flag unsafe prompts and responses inline before they reach the user. Instrumentation runs through LLM TraceKit, an OpenTelemetry-based software development kit (SDK), while code agent observability covers tools like Claude Code, Codex CLI, and Gemini CLI through their built-in OpenTelemetry Protocol telemetry.
New Relic AI Monitoring on Existing APM Agents
New Relic AI monitoring extends the APM instrumentation teams already run. Running on an existing agent, it traces agentic workflows, pinpoints latency per agent and tool, identifies which step in a chain failed, and tracks token consumption per model as a cost driver.
Applied Intelligence handles anomaly detection and incident correlation across the wider platform, and New Relic AI answers natural-language queries. The difference in this comparison sits at output quality: New Relic reports what an LLM call cost and how long it took, while Coralogix also scores what the model said and can act on it.
Security: SIEM and CSPM on the Same Pipeline
Running observability and security monitoring as two separate vendors fragments the data layer: the same logs get shipped twice, paid for twice, and queried in two different languages. Security packaging decides how much of that duplication a platform removes.
Capability
What it covers
Coralogix
New Relic
SIEM
Detecting threats across your logs and security telemetry
Cloud SIEM included, with out-of-the-box threat detections on the same in-stream pipeline as the rest of the platform
Not offered; teams that need SIEM coverage pair New Relic with a separate security vendor
CSPM
Finding risky configurations in cloud infrastructure
Included across Amazon Web Services (AWS), Azure, and Google Cloud Platform (GCP)
Teams that want SOC coverage without staffing one get a managed option on the Coralogix side: Snowbit, Coralogix’s managed security arm, provides managed detection and response inside your Coralogix tenant, working from the same telemetry the engineering team already ships.
Pricing: Ingestion-Based vs. Ingest Plus Per-User Fees
Coralogix charges only for data volume, while New Relic adds user licensing on top of ingest. That difference compounds as teams grow and shapes how predictable your observability budget will be year over year. For buyers focused on controlling spend, the pricing model carries as much weight as feature depth.
Ingest-Only Billing on Coralogix
Every charge on a Coralogix invoice maps to ingested data: [unit-based ingestion pricing] converts units to gigabytes at rates set per pipeline, and unlimited users and hosts come with every plan.
Per-user, per-host, per-query, and per-feature charges do not exist in the model. The TCO (total cost of ownership) Optimizer assigns each data stream to the Frequent Search, Monitoring, Compliance, or Blocked pipeline based on how the data is used, so a debug stream bound for the archive never bills at the rate of data your team searches daily.
New Relic’s Ingest and Per-User Pricing
New Relic’s per-user pricing splits across Basic (free), Core ($49 per user per month), and Full Platform tiers, with Full Platform rates set by edition. Ingest beyond the free 100 gigabytes per month bills at $0.40 per gigabyte on the original data option, or $0.60 per gigabyte with Data Plus. For teams with dozens of full-platform users, user fees become a major part of total platform cost.
What a Typical Workload Costs on Each Platform
For a team ingesting a high volume of logs per day with multiple full-platform users, the annual cost profile differs because Coralogix doesn’t add user-based charges on top of ingest. Twenty full-platform users on New Relic’s Pro edition add $6,980 per month in user fees before any data charges, while the same twenty users cost $0 on Coralogix. Archive storage also follows a different pattern because Coralogix stores data in the customer’s own S3 bucket instead of a vendor-owned store.
Archiving and Archive Query
Long-term retention usually forces a choice between vendor storage fees and losing searchability. Coralogix writes all telemetry data to your own cloud object storage, including Amazon S3 or Google Cloud Storage, in open Parquet format after in-stream processing. It stays accessible indefinitely at standard object storage costs, with no vendor-side retention limits or rehydration steps. Streama processes the data in flight before it lands, so the archive holds full-fidelity telemetry in a format any Parquet reader can open, with or without Coralogix in the picture.
Data Retention Limits Compared
Default retention on New Relic varies by data type, with logs retained 30 days by default and Data Plus adding up to 90 days of retention for most data types. Live archives extend log storage up to seven years for teams with compliance requirements. Coralogix stores data in your S3 bucket with no retention limit. Logs compress when written to S3, which reduces effective storage cost, and your S3 lifecycle policies control retention.
Remote Queries on Unindexed Data
Coralogix’s remote query capability lets your team search archived data directly from the platform without reindexing or rehydration. Archived queries run from Explore using the same text, Lucene, or DataPrime query syntax as live searches, and archived data stays searchable alongside live data streams.
Your data remains in customer-owned cloud object storage, and there’s no additional charge for archive queries. For compliance logs routed to the Compliance pipeline, ongoing costs after the initial ingest charge drop to the S3 storage fee alone, which supports long-term retention for forensic and audit requirements.
Support and Response Times Compared
Every Coralogix account includes 24/7 support from software engineers at no extra cost, with a 17-second median response time and a one-hour median resolution time across all support requests. Coralogix has no premium support tiers, so the team paging at 3 a.m. gets the same access as the largest account.
New Relic’s support varies by edition, with ticketed support on Standard and faster critical-response commitments on the Pro and Enterprise editions.
Coralogix vs. New Relic: Which One to Choose
The decision comes down to which requirements are driving your evaluation.
Where New Relic Still Fits
If your evaluation turns on mature agent-based APM with deep auto-instrumentation under a single software as a service (SaaS) contract, New Relic meets that requirement today. The free tier and broad language coverage suit smaller teams standardized on proprietary agents. The user-based cost component stays manageable only while full-platform seat counts stay low.
The Coralogix Case: Volume Pricing, Owned Storage, Security Included
Choose Coralogix when your team prioritizes predictable costs at high data volumes, needs to query archived data without rehydration fees, or wants to consolidate observability and security, including SIEM and CSPM, in a single platform. The customer-owned storage model in open Parquet format also reduces long-term vendor lock-in risk.
No User Fees and Data You Own: The Coralogix Approach
The comparison comes down to what you pay for and where your data lives. Coralogix bills only on ingested volume, processes telemetry through Streama before it lands in an S3 bucket you own, and keeps every archived byte searchable without rehydration, while New Relic prices platform access through user licenses on top of ingest and retains data in its own backend. Every difference this guide covered, from per-user fees to retention ceilings to support tiers, follows from that structural choice.
If you want to see what removing per-user fees does to your observability bill, try Coralogix for free on a 14-day trial against your own production traffic. The trial includes full feature access for unlimited users with no credit card required.
Frequently Asked Questions About Coralogix vs. New Relic
Is Coralogix cheaper than New Relic?
For teams with dozens of engineers accessing the platform, Coralogix is often more cost-effective because it prices by data usage with no per-user fees. Full platform user licenses can become the dominant cost driver as your team grows on user-priced products. At high data volumes with few users, the cost comparison depends on how you route data through Coralogix’s TCO Optimizer pipelines.
Does New Relic charge per user?
Yes. As of June 2026, New Relic prices users in three types: Basic (free), Core ($49 per user per month), and Full Platform, which is priced by edition and carries the highest rates. User fees apply on top of data ingest charges.
Can Coralogix replace New Relic for APM?
Coralogix covers distributed tracing, service catalog with SLO tracking, and more, all built on OpenTelemetry. Teams running OpenTelemetry-instrumented services can migrate without changing their instrumentation. Organizations that rely heavily on agent-based auto-discovery should evaluate the OpenTelemetry-native path during a proof of concept.
How long does New Relic retain data by default?
Default retention varies by data type, with logs retained 30 days by default and Data Plus adding up to 90 days for most data types. Coralogix can retain archived data indefinitely in your own S3 bucket, with retention controlled by your S3 lifecycle policies and storage charged through your object storage.
Does Coralogix support OpenTelemetry natively?
Coralogix runs on an OTel-native architecture with no proprietary agents required. The platform accepts OTLP for logs, metrics, and traces.
Python is a highly skilled language with a large developer community, which is essential in data science, machine learning, embedded applications, and back-end web and cloud applications.
And logging is critical to understanding software behavior in Python. Once logs are in place, log monitoring can be utilized to make sense of what is happening in the software. Python includes several logging libraries that create and direct logs to their assigned targets.
This article will go over Python logging best practices to help you get the best log monitoring setup for your organization.
What is Python logging?
Logging in Python, like other programming languages, is implemented to indicate events that have occurred in software. Logs should include descriptive messages and variable data to communicate the state of the software at the time of logging.
They also communicate the severity of the event using unique log levels. Logs can be generated using the Python standard library.
Python logging module
The Python standard library provides a logging module to log events from applications and libraries. Once the Python JSON logger is configured, it becomes part of the Python interpreter process that is running the code.
In other words, Python logging is global. You can also configure the Python logging subsystem using an external configuration file. The specifications for the logging configuration format are found in the Python standard library documentation.
The logging library is modular and offers four categories of components:
Loggers expose the interface used by the application code.
Handlers are created by loggers and send log records to the appropriate destination.
Filters can determine which log records are output.
Formatters specify the layout of the final log record output.
Multiple logger objects are organized into a tree representing various parts of your system and the different third-party libraries you have installed. When you send a message to one of the loggers, the message gets output on that logger’s handlers using a formatter attached to each handler.
The message then propagates the logger tree until it hits the root logger or a logger in the tree configured with .propagate=False. This hierarchy allows logs to be captured up the subtree of loggers, and a single handler could catch all logging messages.
Python loggers
The logging.Logger objects offer the primary interface to the logging library. These objects provide the logging methods to issue log requests along with the methods to query and modify their state. From here on out, we will refer to Logger objects as loggers.
Creating a new logger
The factory function logging.getLogger(name) is typically used to create loggers. By using the factory function, clients can rely on the library to manage loggers and access loggers via their names instead of storing and passing references to loggers.
The name argument in the factory function is typically a dot-separated hierarchical name, i.e. a.b.c. This naming convention enables the library to maintain a hierarchy of loggers. Specifically, when the factory function creates a logger, the library ensures a logger exists for each level of the hierarchy specified by the name, and every logger in the hierarchy is linked to its parent and child loggers.
Threshold logging level
Each logger has a threshold logging level to determine whether a log request should be processed. A logger processes a log request if the numeric value of the requested logging level is greater than or equal to the severity of the logger’s threshold logging level.
Clients can retrieve and change the threshold logging level of a logger via Logger.getEffectiveLevel() and Logger.setLevel(level) methods, respectively. When the factory function is used to create a logger, the function sets a logger’s threshold logging level to the threshold logging level of its parent logger as determined by its name.
Log levels
Log levels allow you to define event severity for each log so they are easily analyzed. Python supports predefined values, which can be found by calling logging.getLevelName(). Predefined log levels include CRITICAL, ERROR, WARNING, INFO, and DEBUG from highest to lowest severity. Developers can also maintain a dictionary of log levels by defining custom levels using logging.getLogger().
Python comes with different methods to read events from the software: print() and logging. Both will communicate event data but pass this information to different storage locations using different methods.
The print function sends data exclusively to the console. This can be convenient for fast testing as a function is developed, but it is not practical for use in functional software. There are two critical reasons to not use print() in software:
If your code is used by other tools or scripts, the user will not know the context of the print messages.
When running Python software in containers like Docker, the print messages will not be seen since containers cannot access the console.
The logging library also provides many features contributing to Python logging best practices. These include identifying the line of the file, function, and time of log events, distinguishing log events by their importance, and providing formatting to keep log messages consistent.
Python logging examples
Here are a few code snippets to illustrate how to use the Python logging library.
Snippet 1: Creating a logger with a handler and a formatter
# main.py
import logging, sys

def _init_logger():    #Create a logger named 'app'
    logger = logging.getLogger('app')
    #Set the threshold logging level of the logger to INFO
    logger.setLevel(logging.INFO)
    #Create a stream-based handler that writes the log entries    #into the standard output stream
    handler = logging.StreamHandler(sys.stdout)
    #Create a formatter for the logs
    formatter = logging.Formatter(       '%(created)f:%(levelname)s:%(name)s:%(module)s:%(message)s')
        #Set the created formatter as the formatter of the handler    handler.setFormatter(formatter)
    #Add the created handler to this logger
    logger.addHandler(handler)

_init_logger()
_logger = logging.getLogger('app')
In snippet 1, a logger is created with a log level of INFO. Any logs that have a severity less than INFO will not print (i.e. DEBUG logs). A new handler is created and assigned to the logger. New handlers can be added to send logging outputs to streams like sys.stdout or any file-like object.
A formatter is created and added to the handler to transform log messages into placeholder data. In this formatter, the time of the log request (as an epoch timestamp), the logging level, the logger’s name, the module name, and the log message will all print.
Snippet 2: Issuing log requests
# main.py
_logger.info('App started in %s', os.getcwd())
In snippet 2, an info log states the app has started. When the app is started in the folder /home/kali with the logger created in snippet 1, the following log entry will be generated in the std.out stream:
1586147623.484407:INFO:app:main:App started in /home/kali/
Snippet 3: Issuing log requests with positional arguments
# app/io.py
import logging

def _init_logger():
    logger = logging.getLogger('app.io')
    logger.setLevel(logging.INFO)

_init_logger()
_logger = logging.getLogger('app.io')

def write_data(file_name, data):
    try:
        # write data
        _logger.info('Successfully wrote %d bytes into %s', len(data), file_name)
    except FileNotFoundError:
        _logger.exception('Failed to write data into %s', file_name)
This snippet logs an informational message every time data is written successfully via write_data. If a write fails, the snippet logs an error message that includes the stack trace in which the exception occurred. The logs here use positional arguments to enhance the value of the logs and provide more contextual information.
With the logger created using snippet 1, successful execution of write_data would create a log similar to:
1586149091.005398:INFO:app.io:io:Successfully wrote 134 bytes into /tmp/tmp_data.txt
If the execution fails, then the created log will appear like:
1586149219.893821:ERROR:app:io:Failed to write data into /tmp1/tmp_data.txt
Traceback (most recent call last):
File “/home/kali/program/app/io.py”, line 12, in write_data
print(open(file_name), data)
FileNotFoundError: [Errno 2] No such file or directory: ‘/tmp1/tmp_data.txt’
Alternatively to positional arguments, the same outputs could be achieved using complete names as in:
_logger.info('Successfully wrote %(data_size)s bytes into %(file_name)s',
    {'data_size': len(data), 'file_name': file_name})
Types of Python logging methods
Every logger offers a shorthand method to log requests by level. Each pre-defined log level is available in shorthand; for example, Logger.error(msg, *args, **kwargs).
In addition to these shorthand methods, loggers also offer a general method to specify the log level in the arguments. This method is useful when using custom logging levels.
Logger.log(level, msg, *args, **kwargs)
Another useful method is used for logs inside exception handlers. It issues log requests with the logging level ERROR and captures the current exception as part of the log entry.
Logger.exception(msg, *args, **kwargs)
In each of the methods above, the msg and args arguments are combined to create log messages captured by log entries. They each support the keyword argument exc_info to add exception information to log entries and stack_info and stacklevel to add call stack information to log entries. Also, they support the keyword argument extra, which is a dictionary, to pass values relevant to filters, handlers, and formatters.
How to get started with Python logging
To get the most out of your Python logging, they need to be set up consistently and ready to analyze. When setting up your Python logging, use these best practices below.
Create loggers using .getlogger
The logging.getLogger() factory function helps the library manage the mapping from logger names to logger instances and maintain a hierarchy of loggers. In turn, this mapping and hierarchy offer the following benefits:
Clients can use the factory function to access the same logger in different application parts by merely retrieving the logger by its name.
Only a finite number of loggers are created at runtime (under normal circumstances).
Log requests can be propagated up the logger hierarchy.
When unspecified, the threshold logging level of a logger can be inferred from its ascendants.
The configuration of the logging library can be updated at runtime by merely relying on the logger names.
Use pre-defined logging levels
Use the shorthand logging.<logging level>() method to log at pre-defined logging levels. Besides making the code a bit shorter, the use of these functions helps partition the logging statements into two sets:
Those that issue log requests with pre-defined logging levels.
Those that issue log requests with custom logging levels.
The pre-defined logging levels capture almost all logging scenarios that occur. Most developers are universally familiar with these logging levels across different programming languages, making them easy to understand. The use of these values reduces deployment, configuration, and maintenance burdens.
Create module-level loggers
While creating loggers, we can create a logger for each class or create a logger for each module. While the first option enables fine-grained configuration, it leads to more loggers in a program, i.e., one per class. In contrast, the second option can help reduce the number of loggers in a program. So, unless such fine-grained configuration is necessary, create module-level loggers.
Use .LoggerAdapter to inject local contextual information
Use logging.LoggerAdapter() to inject contextual information into log records. The class can also modify the log message and data provided as part of the request. Since the logging library does not manage these adapters, they cannot be accessed with common names. Use them to inject contextual information local to a module or class.
Use filters or .setLogRecordFactor() to inject global contextual information
Two options exist to seamlessly inject global contextual information (common across an app) into log records. The first option is to use the filter support to modify the log record arguments provided to filters. For example, the following filter injects version information into incoming log records.
There are two downsides to this option. First, if filters depend on the data in log records, then filters that inject data into log records should be executed before filters that use the injected data. Thus, the order of filters added to loggers and handlers becomes crucial. Second, the option “abuses” the support to filter log records to extend log records.
The second option is to initialize the logging library with a log record creating a factory function via logging.setLogRecordFactory(). Since the injected contextual information is global, it can be injected into log records when created in the factory function. This ensures the data will be available to every filter, formatter, logger, and handler in the program.
The downside of this option is that we have to ensure factory functions contributed by different components in a program play nicely with each other. While log record factory functions could be chained, such chaining increases the complexity of programs.
Use .disable() to inhibit processing of low-level requests
A logger will process a log request based on the effective logging level. The effective logging level is the higher of two logging levels: the logger’s threshold level and the library-wide level. Set the library-wide logging level using the logging.disable(level) function. This is set to 0 by default so that every log request will be processed.
Using this function, the software will throttle the logging output of an app by increasing the logging level across the whole app. This can be important to keep log volumes in check in production software.
Advantages and disadvantages of python logging
Python’s logging library is more complicated than simple print() statements. The library has many great features that provide a complete solution for obtaining log data needed to achieve full-stack observability in your software.
Here we show the high-level advantages and disadvantages of the library.
Configurable logging
The Python logging library is highly configurable. Logs can be formatted before printing, can have placeholder data filled in automatically, and can be turned on and off as needed. Logs can also be sent to a number of different locations for easier reading and debugging. All of these settings are codified, so are well-defined for each logger.
Save Tracebacks
In failures, it is useful to log debugging information showing where and when a failure occurred. These tracebacks can be generated automatically in the Python logging library to help speed up troubleshooting and fixes.
Difficulty using consistent logging levels
Log levels used in different scenarios can be subjective across a development team. For proper analysis, it is important to keep log levels consistent. Create a well-defined strategy for your team about when to use each logging level available and when a custom level is appropriate.
Design of multiple loggers
Since the logging module is so flexible, logging configurations can quickly get complicated. Create a strategy for your team for how each logging module will be defined to keep logs consistent across developers.
Python logging platforms
Let’s look at an example of a basic logger in Python:
Line 2: create a basicConf function and pass some arguments to create the log file. In this case, we indicate the severity level, date format, filename and file mode to have the function overwrite the log file.
Line 3 to 5: messages for each logging level.
The default format for log records is SEVERITY: LOGGER: MESSAGE. Hence, if you run the code above as is, you’ll get this output:
Regarding the output, you can set the destination of the log messages. As a first step, you can print messages to the screen using this sample code:
import logging
logging.basicConfig(level=logging.DEBUG, format='%(asctime)s - %(levelname)s - %(message)s')
logging.debug('This is a log message.')
If your goals are aimed at the Cloud, you can take advantage of Python’s set of logging handlers to redirect content. Currently in beta release, you can write logs to Stackdriver Logging from Python applications by using Google’s Python logging handler included with the Stackdriver Logging client library, or by using the client library to access the API directly. When developing your logger, take into account that the root logger doesn’t use your log handler. Since the Python Client for Stackdriver Logging library also does logging, you may get a recursive loop if the root logger uses yourPython log handler.
Basic Python logging concepts
When we use a logging library, we perform/trigger the following common tasks while using the associated concepts (highlighted in bold).
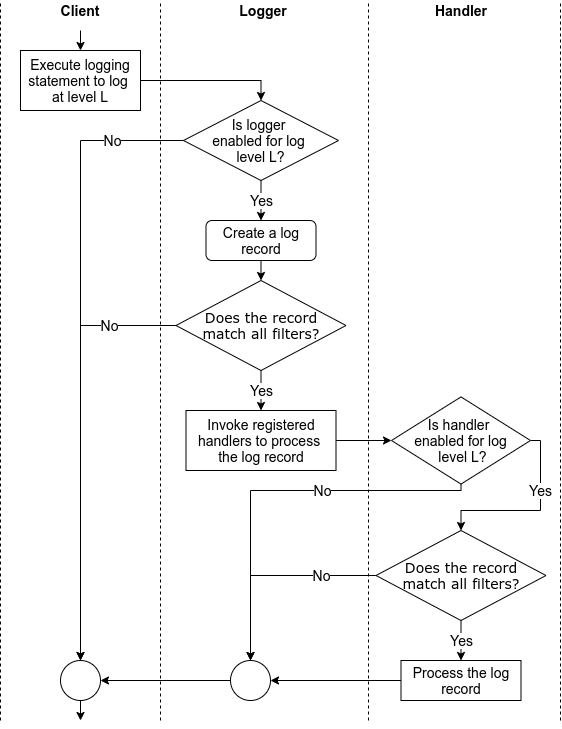
A client issues a log request by executing a logging statement. Often, such logging statements invoke a function/method in the logging (library) API by providing the log data and the logging level as arguments. The logging level specifies the importance of the log request. Log data is often a log message, which is a string, along with some extra data to be logged. Often, the logging API is exposed via logger objects.
To enable the processing of a request as it threads through the logging library, the logging library creates a log record that represents the log request and captures the corresponding log data.
Based on how the logging library is configured (via a logging configuration), the logging library filters the log requests/records. This filtering involves comparing the requested logging level to the threshold logging level and passing the log records through user-provided filters.
Handlers process the filtered log records to either store the log data (e.g., write the log data into a file) or perform other actions involving the log data (e.g., send an email with the log data). In some logging libraries, before processing log records, a handler may again filter the log records based on the handler’s logging level and user-provided handler-specific filters. Also, when needed, handlers often rely on user-provided formatters to format log records into strings, i.e., log entries.
Independent of the logging library, the above tasks are performed in an order similar to that shown in Figure 1.
Figure 1: The flow of tasks when logging via a logging library
Python logging methods
Every logger offers the following logging methods to issue log requests.
Each of these methods is a shorthand to issue log requests with corresponding pre-defined logging levels as the requested logging level.
In addition to the above methods, loggers also offer the following two methods:
<a href="https://docs.python.org/3/library/logging.html#logging.Logger.log" target="_blank" rel="noopener noreferrer">Logger.log(level, msg, *args, **kwargs)</a> issues log requests with explicitly specified logging levels. This method is useful when using custom logging levels.
<a href="https://docs.python.org/3/library/logging.html#logging.Logger.exception" target="_blank" rel="noopener noreferrer">Logger.exception(msg, *args, **kwargs)</a> issues log requests with the logging level ERROR and that capture the current exception as part of the log entries. Consequently, clients should invoke this method only from an exception handler.
msg and args arguments in the above methods are combined to create log messages captured by log entries. All of the above methods support the keyword argument exc_info to add exception information to log entries and stack_info and stacklevel to add call stack information to log entries. Also, they support the keyword argument extra, which is a dictionary, to pass values relevant to filters, handlers, and formatters.
When executed, the above methods perform/trigger all of the tasks shown in Figure 1 and the following two tasks:
After deciding to process a log request based on its logging level and the threshold logging level, the logger creates a <a href="https://docs.python.org/3/library/logging.html#logging.LogRecord" target="_blank" rel="noopener noreferrer">LogRecord</a> object to represent the log request in the downstream processing of the request. LogRecord objects capture the msg and args arguments of logging methods and the exception and call stack information along with source code information. They also capture the keys and values in the extra argument of the logging method as fields.
After every handler of a logger has processed a log request, the handlers of its ancestor loggers process the request (in the order they are encountered walking up the logger hierarchy). The Logger.propagate field controls this aspect, which is True by default.
Beyond logging levels, filters provide a finer means to filter log requests based on the information in a log record, e.g., ignore log requests issued in a specific class. Clients can add and remove filters to/from loggers using <a href="https://docs.python.org/3/library/logging.html#logging.Logger.addFilter" target="_blank" rel="noopener noreferrer">Logger.addFilter(filter)</a> and <a href="#id.46r0co2" target="_blank" rel="noreferrer noopener">Logger.removeFilter(filter)</a> methods, respectively.
Python logging configuration
The logging classes introduced in the previous section provide methods to configure their instances and, consequently, customize the use of the logging library. Snippet 1 demonstrates how to use configuration methods. These methods are best used in simple single-file programs.
When involved programs (e.g., apps, libraries) use the logging library, a better option is to externalize the configuration of the logging library. Such externalization allows users to customize certain facets of logging in a program (e.g., specify the location of log files, use custom loggers/handlers/formatters/filters) and, hence, ease the deployment and use of the program. We refer to this approach to configuration as data-based approach.
Configuring the library
Clients can configure the logging library by invoking <a href="https://docs.python.org/3/library/logging.config.html#logging.config.dictConfig" target="_blank" rel="noopener noreferrer">logging.config.dictConfig(config: Dict)</a> function. The config argument is a dictionary and the following optional keys can be used to specify a configuration.
filters key maps to a dictionary of strings and dictionaries. The strings serve as filter ids used to refer to filters in the configuration (e.g., adding a filter to a logger) while the mapped dictionaries serve as filter configurations. The string value of the name key in filter configurations is used to construct logging.Filter instances.
"filters": {
  "io_filter": {
    "name": "app.io"
  }
}
This configuration snippet results in the creation of a filter that admits all records created by the logger named ‘app.io’ or its descendants.
formatters key maps to a dictionary of strings and dictionaries. The strings serve as formatter ids used to refer to formatters in the configuration (e.g., adding a formatter to a handler) while the mapped dictionaries serve as formatter configurations. The string values of the datefmt and format keys in formatter configurations are used as the date and log entry formatting strings, respectively, to construct logging.Formatter instances. The boolean value of the (optional) validate key controls the validation of the format strings during the construction of a formatter.
This configuration snippet results in the creation of two formatters. A simple formatter with the specified log entry and date formatting strings and detailed formatter with specified log entry formatting string and default date formatting string.
handlers key maps to a dictionary of strings and dictionaries. The strings serve as handler ids used to refer to handlers in the configuration (e.g., adding a handler to a logger) while the mapped dictionaries serve as handler configurations. The string value of the class key in a handler configuration names the class to instantiate to construct a handler. The string value of the (optional) level key specifies the logging level of the instantiated handler. The string value of the (optional) formatter key specifies the id of the formatter of the handler. Likewise, the list of values of the (optional) filters key specifies the ids of the filters of the handler. The remaining keys are passed as keyword arguments to the handler’s constructor.
This configuration snippet results in the creation of two handlers:
A <em>stderr</em> handler that formats log requests with INFO and higher logging level log via the simple formatter and emits the resulting log entry into the standard error stream. The stream key is passed as keyword arguments to logging.StreamHandler constructor. The value of the stream key illustrates how to access objects external to the configuration. The ext:// prefixed string refers to the object that is accessible when the string without the ext:// prefix (i.e., sys.stderr) is processed via the normal importing mechanism. Refer to Access to external objects for more details. Refer to Access to internal objects for details about a similar mechanism based on cfg:// prefix to refer to objects internal to a configuration.
An alert handler that formats ERROR and CRITICAL log requests via the detailed formatter and emails the resulting log entry to the given email addresses. The keys mailhost, formaddr, toaddrs, and subject are passed as keyword arguments to logging.handlers.SMTPHandler’s constructor.
loggers key maps to a dictionary of strings that serve as logger names and dictionaries that serve as logger configurations. The string value of the (optional) level key specifies the logging level of the logger. The boolean value of the (optional) propagate key specifies the propagation setting of the logger. The list of values of the (optional) filters key specifies the ids of the filters of the logger. Likewise, the list of values of the (optional) handlers key specifies the ids of the handlers of the logger.
This configuration snippet results in the creation of two loggers. The first logger is named app, its threshold logging level is set to WARNING, and it is configured to forward log requests to stderr and alert handlers. The second logger is named app.io, and its threshold logging level is set to INFO. Since a log request is propagated to the handlers associated with every ascendant logger, every log request with INFO or a higher logging level made via the app.io logger will be propagated to and handled by both stderr and alert handlers.
root key maps to a dictionary of configuration for the root logger. The format of the mapped dictionary is the same as the mapped dictionary for a logger.
incremental key maps to either True or False (default). If True, then only logging levels and propagate options of loggers, handlers, and root loggers are processed, and all other bits of the configuration is ignored. This key is useful to alter existing logging configuration. Refer to Incremental Configuration for more details.
disable_existing_loggers key maps to either True (default) or False. If False, then all existing non-root loggers are disabled as a result of processing this configuration.
Also, the config argument should map the version key to 1.
Here’s the complete configuration composed of the above snippets.
The configuration schema for filters supports a pattern to specify a factory function to create a filter. In this pattern, a filter configuration maps the () key to the fully qualified name of a filter creating factory function along with a set of keys and values to be passed as keyword arguments to the factory function. In addition, attributes and values can be added to custom filters by mapping the . key to a dictionary of attribute names and values.
For example, the below configuration will cause the invocation of app.logging.customFilterFactory(startTime='6PM', endTime='6AM') to create a custom filter and the addition of local attribute with the value True to this filter.
Configuration schemas for formatters, handlers, and loggers also support the above pattern. In the case of handlers/loggers, if this pattern and the class key occur in the configuration dictionary, then this pattern is used to create handlers/loggers. Refer to User-defined Objects for more details.
Configuring using Configparse-Format Files
The logging library also supports loading configuration from a <a href="https://docs.python.org/3/library/configparser.html#module-configparser" target="_blank" rel="noopener noreferrer">configparser</a>-format file via the <a href="https://docs.python.org/3/library/logging.config.html#logging.config.fileConfig" target="_blank" rel="noopener noreferrer">logging.config.fileConfig() function. Since this is an older API that does not provide all of the functionalities offered by the dictionary-based configuration scheme, the use of the dictConfig() function is recommended; hence, we’re not discussing the fileConfig() function and the configparser file format in this tutorial.
Configuring over the wire
While the above APIs can be used to update the logging configuration when the client is running (e.g., web services), programming such update mechanisms from scratch can be cumbersome. The logging.config.listen() function alleviates this issue. This function starts a socket server that accepts new configurations over the wire and loads them via dictConfig() or fileConfig() functions. Refer to <a href="https://docs.python.org/3/library/logging.config.html#logging.config.listen" target="_blank" rel="noopener noreferrer">logging.config.listen()</a> for more details.
Loading and storing configuration
Since the configuration provided to dictConfig() is nothing but a collection of nested dictionaries, a logging configuration can be easily represented in JSON and YAML format. Consequently, programs can use the json module in Python’s standard library or external YAML processing libraries to read and write logging configurations from files.
For example, the following snippet suffices to load the logging configuration stored in JSON format.
import json, logging.config

with open('logging-config.json', 'rt') as f:
  config = json.load(f)
  logging.config.dictConfig(config)
Limitations
In the supported configuration scheme, we cannot configure filters to filter beyond simple name-based filtering. For example, we cannot create a filter that admits only log requests created between 6 PM and 6 AM. We need to program such filters in Python and add them to loggers and handlers via factory functions or the addFilter() method.
Python logging performance
While logging statements help capture information at locations in a program, they contribute to the cost of the program in terms of execution time (logging statements in loops) and storage (logging lots of data). Although cost-free yet useful logging is impossible, we can reduce the cost of logging by making choices that are informed by performance considerations.
Configuration-based considerations
After adding logging statements to a program, we can use the support to configure logging (described earlier) to control the execution of logging statements and the associated execution time. In particular, consider the following configuration capabilities when making decisions about logging-related performance.
Change logging levels of loggers: This change helps suppress log messages below a certain log level. This helps reduce the execution cost associated with unnecessary creation of log records.
Change handlers: This change helps replace slower handlers with faster handlers (e.g., during testing, use a transient handler instead of a persistent handler) and even remove context-irrelevant handlers. This reduces the execution cost associated with unnecessary handling of log records.
Change format: This change helps exclude unnecessary parts of a log record from the log (e.g., exclude IP addresses when executing in a single node setting). This reduces the execution cost associated with unnecessary handling of parts of log records.
The above changes the range over coarser to finer aspects of logging support in Python.
Code-based considerations
While the support to configure logging is powerful, it cannot help control the performance impact of implementation choices baked into the source code. Here are a few such logging-related implementation choices and the reasons why you should consider them when making decisions about logging-related performance.
Do not execute inactive logging statements
Upon adding the logging module to Python’s standard library, there were concerns about the execution cost associated with inactive logging statements — logging statements that issue log requests with logging level lower than the threshold logging level of the target logger. For example, how much extra time will a logging statement that invokes logger.debug(...) add to a program’s execution time when the threshold logging level of logger is logging.WARN? This concern led to client-side coding patterns (as shown below) that used the threshold logging level of the target logger to control the execution of the logging statement.
# client code
...
if logger.isEnabledFor(logging.DEBUG):
    logger.debug(msg)
...
Today, this concern is not valid because the logging methods in the logging.Logger class perform similar checks and process the log requests only if the checks pass. For example, as shown below, the above check is performed in the logging.Logger.debug method.
Consequently, inactive logging statements effectively turn into no-op statements and do not contribute to the execution cost of the program.
Even so, one should consider the following two aspects when adding logging statements.
Each invocation of a logging method incurs a small overhead associated with the invocation of the logging method and the check to determine if the logging request should proceed, e.g., a million invocations of logger.debug(...) when threshold logging level of logger was logging.WARN took half a second on a typical laptop. So, while the cost of an inactive logging statement is trivial, the total execution cost of numerous inactive logging statements can quickly add up to be non-trivial.
While disabling a logging statement inhibits the processing of log requests, it does not inhibit the calculation/creation of arguments to the logging statement. So, if such calculations/creations are expensive, then they can contribute non-trivially to the execution cost of the program even when the corresponding logging statement is inactive.
Do not construct log messages eagerly
Clients can construct log messages in two ways: eagerly and lazily.
The client constructs the log message and passes it on to the logging method, e.g., logger.debug(f'Entering method Foo: {x=}, {y=}'). This approach offers formatting flexibility via <a href="https://docs.python.org/3/reference/lexical_analysis.html#f-strings" target="_blank" rel="noopener noreferrer">f-strings</a> and the <a href="https://docs.python.org/3/library/string.html#formatstrings" target="_blank" rel="noopener noreferrer">format()</a> method, but it involves the eager construction of log messages, i.e., before the logging statements are deemed as active.
The client provides a printf-style message format string (as a msg argument) and the values (as a args argument) to construct the log message to the logging method, e.g., logger.debug('Entering method %s: x=%d, y=%f', 'Foo', x, y). After the logging statement is deemed as active, the logger constructs the log message using the string formatting operator %. This approach relies on an older and quirky string formatting feature of Python but it involves the lazy construction of log messages.
While both approaches result in the same outcome, they exhibit different performance characteristics due to the eagerness and laziness of message construction.
For example, on a typical laptop, a million inactive invocations of logger.debug('Test message {0}'.format(t)) takes 2197ms while a million inactive invocations of logger.debug('Test message %s', t) takes 1111ms when t is a list of four integers. In the case of a million active invocations, the first approach takes 11061ms and the second approach took 10149ms. A savings of 9–50% of the time taken for logging!
So, the second (lazy) approach is more performant than the first (eager) approach in cases of both inactive and active logging statements. Further, the gains would be larger when the message construction is non-trivial, e.g., use of many arguments, conversion of complex arguments to strings.
Do not gather unnecessary under-the-hood information
By default, when a log record is created, the following data is captured in the log record:
Identifier of the current process.
Identifier and name of the current thread.
Name of the current process in the multiprocessing framework.
Filename, line number, function name, and call stack info of the logging statement.
Unless these bits of data are logged, gathering them unnecessarily increases the execution cost. So, if these bits of data will not be logged, then configure the logging framework to not gather them by setting the following flags.
logging.logProcesses = False
logging.logThreads = False
logging.logMultiProcessing = False
logging._srcFile = None
Do not block the main thread of execution
There are situations where we may want to log data in the main thread of execution without spending almost any time logging the data. Such situations are common in web services, e.g., a request processing thread needs to log incoming web requests without significantly increasing its response time. We can tackle these situations by separating concerns across threads: a client/main thread creates a log record while a logging thread logs the record. Since the task of logging is often slower as it involves slower resources (e.g., secondary storage) or other services (e.g., logging services such as Coralogix, pub-sub systems such as Kafka), this separation of concerns helps minimize the effort of logging on the execution time of the main/client thread.
The Python logging library helps handle such situations via the <a href="https://docs.python.org/3/library/logging.handlers.html#logging.handlers.QueueHandler" target="_blank" rel="noopener noreferrer">QueueHandler</a> and <a href="https://docs.python.org/3/library/logging.handlers.html#queuelistener" target="_blank" rel="noopener noreferrer">QueueListener</a> classes as follows.
A pair of QueueHandler and QueueListener instances are initialized with a queue.
When the QueueHandler instance receives a log record from the client, it merely places the log request in its queue while executing in the client’s thread. Given the simplicity of the task performed by the QueueHandler, the client thread hardly pauses.
When a log record is available in the QueueListener queue, the listener retrieves the log record and executes the handlers registered with the listener to handle the log record. In terms of execution, the listener and the registered handlers execute in a dedicated thread that is different from the client thread.
Note: While QueueListener comes with a default threading strategy, developers are not required to use this strategy to use QueueHandler. Instead, developers can use alternative threading strategies that meet their needs.
That about wraps it up for this Python logging guide. If you’re looking for a log management solution to centralize your Python logs, check out our easy-to-configure Python integration.
With various open source platforms on the market, engineers have to make smart and cost-effective choices for their teams in order to scale. Elastic Cloud, and its flagship product Elasticsearch, are one of several options available, but how do they compare to a full-stack observability platform like Coralogix?
This article will provide a complete breakdown between Coralogix and Elastic Cloud, from essential industry features, like logs, metrics and traces, to pricing models and support services. When it comes to ensuring observability for modern systems, you need to know which platform suits your data needs.
SaaS vs PaaS
Elastic Cloud is a Platform-as-a-Service (PaaS) solution that provides customers a cloud platform which they oversee themselves.
Coralogix, on the other hand, is a fully managed SaaS solution that allows DevOp teams all the tools they need for better data management and software development. Coralogix also runs architecture in a more efficient manner, driving internal cost savings down and resulting in a lower price point. The time to value with Coralogix is much less overall.
Coralogix and Elastic Cloud support ingesting logs, metrics, and traces. While these three data types are common across most SaaS observability platforms, Coralogix uses a unique data streaming analytics pipeline called Streama to analyze data in real-time and provide long-term trend analysis without indexing.
Data correlation and usability
While both Coralogix and Elastic Cloud ingest logs, metrics, and traces from many different sources, Coralogix excels at bringing all this data together in a single, cohesive journey that allows users to sail between data types seamlessly.
Coralogix Flow Alerts
Coralogix alerting has unique features like Coralogix Flow Alerts, which allow users to orchestrate their logs, metrics, traces, and security data into a single alert that tracks multiple events over time. Using Flow Alerts, customers can track the change in their system.
Machine Learning capabilities
Both Coralogix and Elastic Cloud utilize machine learning for alarms, and for automatic correlation between events. For example, if an alarm triggers because of a flow anomaly, the Coralogix platform will automatically show other anomalies that occurred in the same timeframe.
Coralogix Loggregation
Coralogix Loggregation is another unique feature in the Coralogix toolkit. Loggregation will automatically cluster similar logs together, to form a “template”. This functionality allows users to understand which logs are noisiest and accounting for the most errors and more.
Essentially, the Loggeration guides customers through troubleshooting. While Elastic Cloud offers some log clustering functionality (where all data has to be indexed first), Coralogix lets you analyze your data free from indexing.
Archiving and Archive Query
There is no bigger difference in this comparison of Coralogix vs Elastic Cloud than in archiving. For Elastic customers, archiving in a remote location, such as S3, is limited to enterprise customers. As a result, most users ingest a lot of data, and subsequently spend a larger amount of money.
All Coralogix customers, regardless of ingestion amounts, can remotely archive their data into S3. Since Coralogix does not tier its solution, customers who ingest their data into the platform gain immediate access to every single feature.
Furthermore, with the Coralogix platform, you can perform remote queries in seconds on archived, unindexed data. Meanwhile, with Elastic, for data to be accessible, it needs tobe indexed, resulting in huge implication costs. Finally, Coralogix enables infinite retention with unlimited access, with no cost per query, through its archive query capability.
Cost optimizations
Coralogix: Coralogix users start by indexing the majority of their data, but over time, they tend to transfer more data to the archive. This is because it can be queried in seconds, atno additional cost.
This functionality means customers can store the majority of their data in S3, and pay at most $0.023 / GB for storage.Coupled with the Compliance ingest costs in Coralogix, $0.17 / GB, the GB cost for ingest and storage is $0.193 / GB for the first month and $0.023/GB every month after that.Customers can cut costs by between 40% and 70%. Compared to Elastic Cloud, Coralogix cost optimization rests entirely with the customer. Cost optimization with an Elastic deployment may require in-house teams that negate much of the cost optimization possible.
Elastic Cloud: For Elastic customers, instance types and computation power are just a few features that matter. Most are trading off cost for performance.
Coralogix doesn’t charge by cloud resources, but by ingestion volume. More than that, Coralogix allows customers to assign use cases to traces and logs, which drive instant cost savings via the TCO Optimizer. These decisions are flexible and reversible, and entirely risk free.
Pricing model
The Coralogix pricing model is based entirely on GB ingestedwith no solution tiering or extra costs for features, making it easy for new customers to predict their costs. In comparison, the Elastic offering is based on compute capacity. Translating from data volumes to computing is difficult because the correct cluster size would be impacted by a number of other complex variables, such as data tiering, query volumes, high availability and much more.
Customer support
While Elastic Cloud offers 24/7 support to its premium customers, other customers receive lesser coverage. Moreover, Elastic only offers rapid support, or roughly a 30-minute “target response time” for enterprise customers. This is not an SLA, so their documentation does not describe it as such.
Coralogix offers all customers a median 30-second response time, an SLA measured in minutes, and 24/7 support. Coralogix also offers a median resolution time of 43 minutes. Even with the most complete support that Elastic offers, they are acknowledging issues only 10 minutes faster than Coralogix is resolving them.
Out-of-the-box dashboards
Elastic Cloud lacks a built-in dashboard for well-known technology, such as Kubernetes and Serverless. Elastic customers have to manually create these dashboards from scratch, often needing to be reworked since these dashboards are regularly shared in open source communities.
Coralogix has built dashboards for Kubernetes Monitoring, Serverless monitoring and more, while also supporting open source dashboarding solutions like Grafana. Coralogix also provides a custom dashboarding solution for Coralogix users. The platform’s reuse of open source dashboards, like JSON definitions, and the time-to-value of premade dashboards makes its offerings the best of both worlds.
Event-driven architecture is an efficient and effective way to process random, high-volume events in software. Real-time data observability and monitoring of event-driven system architecture has become increasingly important as more and more applications and services move toward this architecture.
Here, we will explore the challenges involved in monitoring event-driven systems, the key metrics that should be monitored, and the tools and techniques that can be used to implement real-time monitoring, including Coralogix’s full-stack observability platform–letting you monitor and analyze data with no limitations.
We will also discuss best practices for designing event-driven systems that are easy to monitor, debug, and maintain.
What is event-driven architecture?
Event-driven architecture is a software architecture pattern emphasizing event production, detection, and consumption. Events are characterized as a change in the system or actions taken by an external actor. Events can be triggered by anything from a user logging into your website to an IoT device pushing data to your platform. Events are generally unpredictable by nature, so reacting to them with traditional polling architecture can be computationally heavy.
In an event-driven architecture, components within the system communicate by publishing events to a central event bus or message broker, which then notifies other components that have subscribed to those events. These components can then appropriately react to the event for their role in the system. The nature of this architecture lends well to microservice architectures.
The advantages of event-driven architecture include improved scalability, loose coupling, and greater flexibility, and it is handy for systems that need to handle large volumes of data and respond quickly to changing conditions. When you have loosely coupled applications, your teams can have better cross-team collaboration and can work more independently and quickly.
When should you use event-driven architecture?
Event-driven architecture is most efficient when you have a system that must respond quickly and efficiently to changing conditions, handle large volumes of data, and scale horizontally.
Real-time processing can be done in a very efficient and effective manner using event-driven architecture. These architectures can quickly handle large volumes of data, making them ideal for real-time processing in a production environment working at scale. Processing can be used to:
Analyze user behaviors on a webpage
Detect security threats
Record input data events such as sales
Act upon IoT sensor data
AWS tools to support event-driven architecture
Amazon Web Services (AWS) provides several services and tools that support event-driven architecture and enable developers to build scalable, flexible, and responsive applications. Here, we will focus on AWS Pipes, AWS EventBridge, and AWS Kinesis. These services do not need to be used together, but complement each other for an effective event-driven architecture design.
AWS EventBridge Pipes
Pipes is a service on AWS, becoming generally available with the full feature set for AWS users in December 2022. The pipes service allows you to create connections between services by creating streams between services without needing to create integration code.
Pipes use managed polling infrastructure to fetch and send events to configured consumers. Events maintain source event order while allowing developers to customize the stream’s batch size, starting position, and concurrency. Pipes also have configurable filtering and enrichment steps, so data flowing through the pipe can be blocked if it is not relevant, and can be enriched with more data before reaching target consumers. The enrichment step can fetch enrichment data using AWS Lambda, AWS API Gateway, or other AWS services.
AWS EventBridge
EventBridge is a service linking multiple AWS producers and consumers together while allowing data filtering for only relevant data. EventBridge provides fast access to events produced by over 200 other AWS services and your client applications via API. Once in EventBridge, events can be filtered by developer-defined rules. Each rule can route data to multiple targets that are appropriate for that data. Rules can also customize event data before sending it to targets.
EventBridge was built for scale applications and can process hundreds of thousands of events per second. Higher throughputs are also available by request. EventBridge also recently added a replay feature to rehydrate archived events to help developers debug and recover from errors.
AWS Kinesis
Kinesis is a managed, real-time, scale streaming service provided by AWS. Kinesis can take streaming data at high volumes and has controls in place that help data processing work effectively. Partition keys allow you to ensure similar data are processed together, and sent to the same Lambda instance. Back pressure features ensure Kinesis does not overrun sink points with limited resources or that are throttled. Kinesis can also replay events up to 24 hours in the past if necessary to avoid data loss or corruption.
Kinesis, however, does not support routing. All data in a stream is sent to all configured trigger points. Producers (data sources) and consumers (data endpoints) are inherently tied together. Depending on the consumer, there may be wasted data where a consumer does not need to process certain data so it is dropped on the floor. When every millisecond of processing costs, this is less than ideal. There are also limits to the number of consumers available per Kinesis stream. While users can configure multiple, every new consumer increases the likelihood of throttling in the stream, increasing latency.
A sample event-driven architecture
The high-level architecture for an event-driven platform could resemble the setup below. In this architecture, an API Gateway is used to collect events. They directly flow through SQS, EventBridge Pipes, and EventBridge rules before reaching processing that involves developer code. Along this flow, data could be transformed if needed before storage in either OpenSearch or S3. Lambdas can be triggered by Kinesis DataStreams or directly by EventBridge rules for further processing.
Observability in distributed, event-driven architecture
Distributed systems are notoriously difficult to troubleshoot since each service acts individually. The system depicted above uses several discrete services which operate independently, and each can provide a point of failure. DevOps teams need to track data as it flows through these different software systems to effectively troubleshoot and fix errors. By tracing data, teams can detect where data is bottlenecked and where failures are occurring. Logs and metrics will show how services function individually and in response to one another. The more quickly teams visualize issues, the more quickly they can be fixed. Reduction of downtime and errors is the end goal of every software team.
Observability methods must be integrated to complete the building of an event-driven architecture. Various tools exist within AWS and with external, full-stack observability platforms like Coralogix. Software must be integrated with the ability to generate observability data (logs, metrics, and traces). This data can be utilized within AWS and exported to observability tools for further analysis. With a distributed system such as the event-driven architecture shown, trace data is especially important, and often overlooked, to ensure analysis can be done effectively to track data as it moves through the system.
While AWS provides observability features such as CloudWatch and CloudTrail, they require manual setup to enable features like alarms. For software running at scale in production environments, external tools are required to ensure your event-driven software runs effectively with minimal downtime when errors occur. For the most effective results, data should be sent to a full-stack observability platform that can offer managed machine learning algorithms and visualization tools so troubleshooting your architecture becomes efficient and effective.
Summary
This article highlighted how an event-driven architecture can be implemented in AWS. Using the available services, minimal coding is required to stream data from external sources like API Gateway to efficient processing and storage endpoints. Data that is not required for processing can be filtered out in this process, requiring less computing time in your software.
Implementing effective observability tooling while building distributed systems is critical to reducing application downtime and lost data. AWS CloudWatch and CloudTrail can be used for monitoring an AWS software system. Coralogix’s full-stack observability platform enhances AWS’s monitoring by providing analysis on logs, traces, and metrics and providing insights and visualizations only available with machine learning.
We are caught in a whirlwind of rapid data observability. As more engineers, services and sophisticated practices are helping generate an astronomical amount of digital information, there’s a growing challenge of the data explosion.
Coralogix offers a completely unique solution to the data problem. Using Coralogix Remote Query, the platform can drive cost savings of 40-70% without sacrificing insights or functionality.
Scale breeds complexity and cost
The propagation of microservices shows no sign of slowing down. In fact, 85% of respondents from large companies report using microservices, according to a 2021 global marketing survey.
In tandem, modern engineering practices will become more ubiquitous and accelerate the rate of change, influencing ephemeral infrastructure. As a result, the natural chaos of solution and demand for data will increase.
According to traditional advice for your data, you should adhere to a simple data life cycle. First, ingest and index everything, then archive your data after a certain period, and finally reingest data when you need it.
However, that same life cycle drives a series of consequences, including:
Incurring maximum cost because all data becomes indexed by default.
Incurring costs in multiple places through ingestion, storage, reindexing, and more.
Customers won’t know how much data they should reindex, resulting in more consumption that wastes money and time.
Coralogix Remote Query: An elegant solution to a complex problem
Rather than ingest and compress data, Coralogix Remote Query transforms the traditional and stiff archive into a living, breathing part of the customer’s observability stack. Coralogix Remote Query is a solution to constant reingestion of logs and enables customers to get the best of both worlds:
Telemetry is stored in an S3 bucket in a customer’s account so they pay the bare minimum for storage costs.
Customers may query their bucket from the Coralogix UI, which is free of charge, and only pay Coralogix for the initial ingestion.
Coralogix’s offering can bring down costs and increase the dataset customers can access, accelerating insights and overcoming the data explosion. These queries also run faster than most OpenSearch solutions today. For example, a 10TB query takes roughly 10-seconds to complete, with millions of logs loaded from S3 in second. Gain speed and usability, while reducing costs.
Unparalleled efficiency with the TCO optimizer
Coralogix TCO Optimizer allows customers to route their data to three different use cases intelligently. Data can be classified as frequent search (indexed), monitoring (converted into metrics before archiving) or compliance (enriched, transformed and archived). This drives huge cost savings because data can be analyzed and understood without the need to index. And data can be retrieved in seconds, thanks to Coralogix Remote Query.
What does this mean for your organization?
TCO Optimizer and Remote Query have some clear and obvious outcomes for any organization struggling to balance costs with insights:
Access more data than ever, while maintaining unrivaled performance.
Drive down costs only indexing the data that you need, and nothing more.
Transform and investigate data in new and exciting ways, using Coralogix’s DataPrime query language.
Set up your archive in less time
Creating a Coralogix archive is as simple as defining an S3 bucket and adding some simple IAM permissions to give Coralogix access to your bucket. Coralogix handles data formatting, enrichment and transformation. To begin, ship your company data to Coralogix using one of over 200 integrations. Then you’re ready to access the data however you need.
It is commonplace for organizations to restrict their IT systems from having direct or unsolicited access to external networks or the Internet, with network proxies serving as gatekeepers between an organization’s internal infrastructure and any external network. Network proxies can provide security and infrastructure admins the ability to specify specific points of data egress from their internal networks, often referred to as an egress controller.
This tutorial demonstrates how to leverage open-source telemetry shippers in conjunction with an open-source network proxy to create a hub-and-spoke architecture that sends your data to Coralogix with a single specified point of data egress.
STEP 3. Define any global options that apply to the entire Caddy server, including which HTTP protocols to support. The h2c scheme allows us to translate gRPC requests into HTTPS onward requests to Coralogix.
{
        servers {
                protocols h1 h2 h2c
        }
}
STEP 4. Define the parameters of the reverse proxy, including the address and port for the inbound traffic coming from our OpenTelemetry Collectors. This allows us to successfully forward inbound gRPC traffic from our OpenTelemetry Collectors to Coralogix ingress via HTTPS.
The log function is used to write all associated logs to stdout with a level of DEBUG or higher.
The destination of our reverse proxy connections is specified as ingress.coralogixstg.wpengine.com:443 with the transport type specified to HTTP.
The tls_server_name parameter is set to ingress.coralogixstg.wpengine.com.
STEP 5. Instruct Caddy 2 to publish Prometheus-format metrics of the Caddy 2 server itself. This step allows us to use our OpenTelemetry Collectors to scrape these metrics and actively monitor our egress controller without deploying any additional components into our telemetry stack.
:2019 {
        metrics /metrics
}
STEP 6. To apply the configuration for the first time and start the Caddy server, use the following command:
caddy run
STEP 7. To make any changes to the Caddyfile, reapply the configuration with the following command:
caddy reload
STEP 8. To view the logs generated by Caddy 2 in stdout, use the following command:
sudo journalctl -u caddy -f
OpenTelemetry
Now that have implemented our Caddy 2 server, update the configuration of our OpenTelemetry Daemonset to send the gRPC traffic to the reverse proxy listening address.
Use this example values.yaml file with Helm to apply the new configuration to our OpenTelemetry Collectors.
As this is a tutorial environment, we have added tls: insecure_skip_verify: true configurations to each of the endpoints (traces, metrics, logs) for the Coralogix Exporter.
The setting insecure_skip_verify: true allows us to send the data using unencrypted gRPC (without TLS verification) to our Caddy 2 egress controller. Caddy 2 then handles the TLS handshake with Coralogix ingress over HTTPS.
Important note folks! This is for a non-production environment. If you have a valid SSL/TLS architecture available, we recommend you secure the traffic between the OpenTelemetry Collectors and Caddy 2 using TLS.
Here we add a configuration in our OpenTelemetry Collector configuration that leverages the Prometheus receiver to scrape the metrics published by Caddy 2. All we need to do here is change <caddy_proxy_address> to the address of our Caddy 2 server.
You can now monitor Caddy 2 in your Coralogix dashboard. Go on to configure metric alerts to notify us should any issues occur with our egress controller.
SaaS Observability is a busy, competitive marketplace. Alas, it is also a very homogeneous industry. Vendors implement the features that have worked well for their competition, and genuine innovation is rare. At Coralogix, we have no shortage of innovation, so here are four features of Coralogix that nobody else in the observability world has.
1. Customer Support Is VERY Fast
Customer support is the difference between some interesting features and an amazing product. Every observability vendor has some form of customer support, but none of them are even close to our response time.
At Coralogix, we respond to customer queries in 19 seconds (median) and achieve <40 minute resolution times on average.
This is fine for now – but how will Coralogix scale this support?
We already have! Coralogix has over 2,000 customers, all of whom are getting the same level of customer support because we don’t tier our service. 1 gigabyte or 100 terabytes – everyone gets the same fantastic standard of service. Don’t believe me? Sign up for a trial account and test our service!
2. Coralogix is Built Differently
The typical flow for data ingestion follows a set of steps:
Data is initially stored and indexed.
Indexed data then triggers a series of events downstream, such as dashboard updates and triggering alarms.
Finally, cost optimization decisions and data transformations are made.
This flow adds latency and overhead, which slows down alarms, log ingestion, dashboard updates, and more. It limits the decision-making capabilities of the platform. It’s impossible to skip indexing and go straight to archiving because every process depends on indexed data. At Coralogix, we saw that this wouldn’t work and endeavored to build our platform differently.
It is a side-effect-free architecture, meaning it is entirely horizontally scalable, and adapts beautifully to meet huge daily demands. This means the Coralogix platform is exponentially more efficient.
3. Archiving and Remote Query
Many observability providers allow customers to archive their data in low-cost storage. In most providers, data is compressed and stored in low-cost storage, like Amazon S3. Customers need to rehydrate their data if they wish to accesstheir data.
There are some key issues with this approach:
Archived data is far less discoverable.
Historical data may be held hostage by a SaaS provider using proprietary compression.
Customers now have to pay again for a massive volume of data in hot storage.
So how does it work at Coralogix?
At Coralogix, we do not demand that data must be rehydrated before it can be queried. Instead, archives can be queried directly. Our remote query engine is fast. Up to 5x faster than Athena and capable of processing terabytes of data in seconds.
With support for schema on read and schema-on-write, Coralogix Remote Query is much more than a simple archiving solution. It’s an entire data analytics platform capable of processing Lucene, SQL, and DataPrime queries.
Does Remote Query save customers money?
In summary, yes. Customers are migrating to Coralogix daily, and they constantly report cost savings. One of the most interesting behaviors in new customers is their willingness to hold less data in “frequent search.” This means customers are paying for less data in hot storage because that data is still easily and instantly accessible in the archive.
This behavior shift and our TCO Optimizer regularly drive cost savings of between 40% and 70%. Speaking of…
4. The Most Advanced Cost Optimization on the Market
Most observability providers have a tiered solution, especially regarding cost optimization. Spending enough money unlocks certain features, like tiered storage. Our competitors need to gatekeep their cost optimization features because they are not architected for this type of early decision-making in the data process. This means they can only afford to optimize their biggest customers.
Coralogix is Perfect for the Cost Optimization Challenge
More than this, we also have features that allow our customers to transform their data on the fly. This allows them to keep only the necessary information and drop everything they don’t. For example, Logs2Metrics, allows our customers to transform their expensive logs into optimized metrics that can be retained for far longer at a fraction of the cost.
Coralogix is Different in All the Best Ways
Coralogix is more than just a full-stack observability platform with some interesting tools. It’s a revolutionary product that will scale to meet customer demands—every time. Our features, coupled with unprecedented customer support and incredible cost optimization make us one of the few observability providers that will help you to grow, help you to optimize, and, at the same time, save you money in the process.
Long-term storage, especially for logs, is essential to any modern observability provider. Each vendor has their own method for handling this problem. While there are numerous available solutions, let’s explore just one – Coralogix vs DataDog – and see the benefits and limitations.
Coralogix already outpaces Datadog in support, with 30-second response times, and cost, where customers have experienced 40-70% cost reductions.
Flex Logs
DataDog has released its feature, named Flex Logs, that enables users to store their logs in their own cloud storage, for example, S3. This allows them to archive logs in very low-cost storage, enabling them to retain more logs without hugely increasing costs. This is especially useful for teams with a large volume of logs and need to retain them for compliance issues.
So what’s missing?
There are some limitations. While we believe that querying archived logs is possible in DataDog, there is a compute cost associated with this feature.
How does Coralogix Remote Query Compare?
Coralogix Remote Query has an initial similarity with DataDog. They both utilize cloud storage in the user’s cloud account for cost-effective log storage. However, Flex Logs is ostensibly a log storage mechanism, but Coralogix Remote Query is a data analytics solution that easily competes with DataDog Flex Logs, providing a wealth of insights out of the box.
Remote Query Data Does Not Need Rehydration
While DataDog does appear to offer direct archive query, it also appears that it charges monthly compute costs, which is likely to increase the total spend for the customer to access their own data. This is the fundamental difference when comparing Coralogix vs DataDog. Coralogix enables Remote Query, which allows users to directly query their archived data, without re-indexing.
Additionally, Coralogix Remote Query supports both schema on read and schema on write, allowing users to define their schema upfront for maximum query precision and optimization, or discover their unstructured data as they go.
Why is Remote Query so Important For An Archive?
The need to reindex data raises some serious questions:
How much data is necessary to reindex?
How expensive will it be to hold all of this data in indexed storage?
How long will it take to reindex this data, especially if there is a lot?
At Coralogix, we don’t force users down a data reindexing strategy. Coralogix does have a reindexing capability, which users can use as they wish. Still, with our unique architecture and the power of Remote Query, we have found that this is required far less than with other SaaS vendors.
Remote Query means users can easily discover their data at no extra cost. The only cost that the user incurs is their S3 hosting fees. Coralogix customers can issue as many queries as they like to their archive using Remote Query. This enables three key capabilities – discovering Coralogix Archive Data, holding less data in Frequent Search, and generating new insights via DataPrime.
Coralogix Archive Data is Discoverable
With Coralogix, data can be explored, new insights can be garnered, and new intelligence can be gathered without the need to reindex. This means that teams can freely (literally) explore their data without worrying about overages or charges for indexing a huge volume of data from the archive. DataDog, with its requirement to reindex, does not have this capability.
Users Can Hold Far Less Data in Frequent Search
Coralogix Remote Query is extremely fast, up to 5x faster than AWS Athena in certain scenarios. Many Coralogix users have realized that the significantly reduced cost and remarkable performance of Remote Query means they keep fewer indexed logs. This further reduces their costs while allowing them to explore more of their data than ever before.
Users Can Generate Entirely new Insights with DataPrime
Coralogix Remote Query doesn’t just allow users to pull the data from remote storage. They can also perform aggregations on their data using the DataPrime syntax (SQL and Lucene are also supported). This enables true data discovery and the ability to directly generate reports on archived data, instantly.
Coralogix vs Datadog: Remote Query is the Next Generation of Archiving
Whether it’s the feature-set, the price point, the analytics capabilities, or the performance, by our overall estimations Coralogix wins with long-term storage of observability data. The capabilities available as part of the Remote Query feature are entirely unparalleled in the industry. Because our unique and fundamentally different architecture drives them, many of our competitors are years away from meeting the standard that we have set.
In modern observability, Lucene is the most commonly used language for log analysis. Lucene has earned its place as a query language. Still, as the industry demands change and the challenge of observability grows more difficult, Lucene’s limitations become more obvious.
How is Lucene limited?
Lucene is excellent for key value querying. For example, if I have a log with a field userId and I want to find all logs pertaining to the user Alex, then I can run a simple query: userId: Alex.
To understand Lucene limitations, ask a more advanced question: Who are the top 10 most active users on our site? Unfortunately, this is complex, requiring functionality that is not found in Lucene. So something new is necessary at this point. More than just a query language, observability needs a syntax that will help us explore new insights within our data.
DataPrime – The Full Stack Observability Syntax
DataPrime is the Coralogix query syntax that allows users to explore their data, perform schema on read transformations, group and aggregate fields, extract data, and much more. Let’s look at a few examples.
Aggregating Data – “Who are our Top 10 most active users?”
To answer a question like this, let’s break down our problem into stages:
First, filter the data by logs that indicate “activity”
Aggregate our data to count the logs
Sort the results into descending order
Limit the response to only the top 10
Most of these activities are completely impossible in Lucene, so let’s explore how they look in DataPrime:
DataPrime transforms this complex problem into a flattened series of processes, allowing users to think about their data as it transforms through their query rather than nesting and forming complex hierarchies of functionality.
Extracting Embedded Data – “How do we analyze unstructured strings?”
Extracting data in DataPrime is entirely trivial, using the extract command. This command allows users to transform unstructured data into parsed objects that are included as part of the schema (a capability known as schema on read). Extract supports a number of methods:
JSON parsing will take unparsed JSON and add it to the schema of the document
The key-value parser will automatically process key value pairs, using custom delimiters
The Regex parser will allow users to define lookup groups to specify exactly where keys are in unstructured data.
The following example shows how simple it is to use regular expressions to capture multiple values from unstructured data.
Redacting – “We want to generate a report, but there’s sensitive data in here.”
Logs often contain personal information. A common solution to this problem is to extract the data, redact it in another tool and send the redacted version. All this does is copy personal data and increase the attack surface. Instead, use DataPrime to redact data as it’s queried.
This makes it impossible for data to leak out of the system, and helps companies analyze their data while maintaining data integrity and confidentiality.
DataPrime Changes how Customers Explore Their Data
With access to a much more sophisticated set of tools, users can explore and analyze their data like never before. Don’t settle for simple queries and complex syntax. Flatten your processing, and generate entirely new fields on the fly using DataPrime.
Like many cool tools out there, this project started from a request made by a customer of ours.
Having recently migrated to our service, this customer had ~30TB of historical logging data. This is a considerable amount of operational data to leave behind when moving from one SaaS platform to another. Unfortunately, most observability solutions are built around the working assumption that data flows are future-facing.
To put it in layman’s terms, most services won’t accept an event message older than 24 hours. So, we have this customer coming to us and asking how we can migrate this data over, but those events were over a year old! So, of course, we got to thinking…
Data Source Requirements
This would be a good time to describe the data sources and requirements that we received from the customer.
We were dealing with:
~30 TB of data
Mostly plain text logs
Various sizes of gzip files from 1GB to 200KB
A mix of spaces and tabs
No standardized time structure
Most of the text represents a certain key/value structure
So, we brewed a fresh pot of coffee and rolled out the whiteboards…
Sending the Data to Coralogix
First, we created a small bit of code to introduce the log lines into Coralogix. The code should work in parallel and be as frugal as possible.
Once the data is coming into Coralogix, the formatting and structuring of the data can be done by our rules engine. All we needed is to extract the timestamp, make it UNIX compatible, and we are good to go.
We chose to do this by implementing a Lambda function with a SAM receipt. The Lambda will trigger for each S3 PUT event so we can have a static system costing us nothing on idle and always ready to handle any size of data dump we throw its way.
Now that we have the data streaming in, we need to make sure it keeps its original timestamp. Don’t forget it basically has two timestamps now:
Time of original message
Time of entry to Coralogix
In this part, we make the past timestamp the field by which we will want to search our data.
Like every good magic trick, the secret is in the moment of the swap, and for this solution this is it.
Since we have the original time stamp, we can configure it to be of a Date type. All we need to do in Coralogix is make sure the field name has the string timestamp in its name (i.e. coralogix_custom_timestamp).
Some parts of Coralogix are based on the community versions of Elastic stack, so we also place some of the advanced configurations at the user’s disposal (i.e. creation of index templates or Kibana configurations).
Creating Index Patterns
At this point, we need to create a template for new indexes to use our custom timestamp field.
While the Elastic engine will detect new fields and classify them accordingly by default, we can override this as part of the advanced capabilities of Coralogix.
Once this part is done, we will have the ability to search the “Past” in a native way. We will be able to set an absolute time in the past.
To create the templates, click on the Kibana logo on the top right of the Coralogix UI -> select Management -> Index Patterns. This is essentially where we can control the template which creates the data structures of Coralogix.
First, we should remove the current pattern template (i.e. *:111111_newlogs*).
Note – This step will only take effect on the creation of the new index (00:00:00 UTC).
Clicking on Create index format, one of the first parameters we are asked to provide is the field which will indicate the absolute time for new indices. In this case, “Time filter field name”.
If using the example field name suggested earlier, the field selected should be “coralogix_custom_timestamp”.
Sending Data to S3
Now that we have a team with flowing historical data and a time axis aware of the original time, all we have left is to point the Coralogix account to an S3 bucket to grant us endless retention. Essentially, the data goes through Coralogix but does not stay there.
For this step, we will use our TCO optimizer feature to configure a new policy for the application name we set on our Lambda. This policy will send all of our data to our S3 bucket.
Now the magic is ready!
Wrapping Up
Once a log gzip file is placed in S3, it will trigger an event for our Lambda to do some pre-parsing for it, and send it to Coralogix.
As data flows through Coralogix, it will be formatted by the rules we set for that application.
The data will then be structured and sent to S3 in a structured format. Once the data is sent to S3, it is no longer stored in the Coralogix platform in order to save on storage costs. You can still use Athena or any search engine to query the data with low latency. Behold! Your very own data lake was created with the help of Coralogix. If you have any questions about this or are interested in implementing something similar with us, don’t hesitate to reach out!
Infrastructure as Code is an increasingly popular DevOps paradigm. IaC has the ability to abstract away the details of server provisioning. This tutorial will look at how Coralogix can be used with the popular IaC tool Terraform.
Terraform
Terraform, a tool we’ve previously talked about, is Hashicorp’s answer to the problem of server provisioning. It uses the powerful paradigm of Infrastructure as Code (IaC). IaC abstracts and simplifies the traditional process of setting up and configuring servers by representing server configurations as code files.
This brings a range of benefits to DevOps teams such as automating deployment processes, providing effective infrastructure documentation, and enabling infrastructure validation.
Terraform itself is a binary that makes API calls to providers. These are services such as Coralogix or AWS which Terraform tells to perform particular tasks. Users can interact with the providers using the Terraform CLI or by setting up configuration files.
Terraform Configuration Language
Terraform represents the various objects of your infrastructure as resources. These are stored in configuration documents. The syntax of a typical configuration document looks something like this:
Blocks are comprised of three elements. The Block Type tells you that it is a Terraform resource. Block labels function as tags and a block can have multiple labels. The body of a block is where the content is stored. This content could be arguments or expressions.
Arguments and expressions
Arguments assign a value to a name while expressions are statements that combine values. In the first example cidr_block = var.base_cidr_block is an argument.
Terraform’s configuration language is declarative. As Yevgeniy Brikman explains, this shows its advantage when making configuration changes. For example, if you wanted to deploy 10 EC2 instances you might use the following configuration file:
You can change the number simply by editing the count argument. If you wanted 15 EC2 instances instead of ten you can write count = 15 without worrying about the configuration change history.
Using Terraform
Terraform has a range of useful applications. For one, it can simplify the setup of Heroku applications. Heroku is popular due to its ability to scale apps using dynos, but building anything complex quickly requires lots of add-ons.
Terraform, by using IaC, can make setting up these add-ons much simpler. Heroku add-ons can be specified in a Terraform configuration document. Terraform even allows you to do fancy stuff like using Cloudflare as a CDN for your application.
Another use is 2-tier applications that involve a pool of web servers using a database. For these to run successfully the connection between servers and database must be seamless. Additionally, both tiers must be up and running to execute functionality. You don’t want any of your servers trying to hit a database that isn’t there.
With IaC, Terraform can handle the infrastructure, ensuring the necessary dependencies are in place and that the database is up before servers are provisioned. Plus, this can all be done with a few configuration documents.
Coralogix
Many Terraform applications produce lots of logging data. As a case in point, Heroku logs are notorious for the amount of data they generate. To really reap the benefits of IaC in your application development, you need good observability.
This is where Coralogix (which has pre-built Heroku visualizations) comes in. It uses machine learning to automatically extract patterns and trends from data.
Using Coralogix with Terraform
As with other systems that it integrates with, you can use Terraform to interact with Coralogix, first by configuring it with the Coralogix provider, and second, by setting rules and alerts through the Terraform CLI.
Coralogix Provider
The Coralogix provider enables you to define rules and alerts through Terraform’s IaC paradigm. If you have Terraform at or later than 0.13, the code for the provider is:
The value of the API key is stored in an environment variable called API_KEY. If you’re an admin user, you can generate an API key from the Coralogix dashboard by going to Settings -> Account and clicking on API Access. This will let you create an Alerts & Rules API key.Since the API key is a sensitive value you can use infrastructure as code management platform to store the value securely.
Along with the API key, there are two optional arguments. url contains the Coralogix API URL which is stored in the environment variable API_URL. timeout is an argument specifying when the Coralogix API will time out. This information is stored in the CORALOGIX_API_TIMEOUT environment variable.
Log Parsing Rules
It’s important for DevOps engineers to effectively manipulate logging data. In Coralogix, this is enabled through log parsing rules. These are rules for processing, parsing, and restructuring log data. Rules come in various types, for example, parse rules allow you to create secondary logs based on data from primary logs.
Coralogix contains rules in Rules Groups. These are structures that contain sets of rules, along with a Rule Matcher which ensures only the desired logs are processed by queries.
Manipulating Rules Groups with Terraform
Terraform allows users to create, read, update, and delete Coralogix Rules Groups through its Coralogix Rules Groups resource.
In this example, we are creating a group called “My Group”.
# Create "My Group" Rules Group
<meta charset="utf-8">resource "coralogix_rules_group" "rules_group" {
<meta charset="utf-8">    name    = "My Group"
<meta charset="utf-8">    enabled = true
<meta charset="utf-8">}
In addition to the arguments included in the example, there are two optional arguments. The description argument allows you to add a description summarizing the Group’s purpose. The creator argument shows who created the rules group.
Manipulating Rules
Terraform lets you play not just with Rules Groups but with Rules themselves using this data source.
# Create "My Rule" Rule
<meta charset="utf-8">resource "coralogix_rule" "example" {
<meta charset="utf-8">    rules_group_id = "e10ef9d1-36ab-11e8-af8f-02420a00070c"
<meta charset="utf-8">    name           = "My Rule"
<meta charset="utf-8">    type           = "extract"
<meta charset="utf-8">    description    = "My Rule created with Terraform"
<meta charset="utf-8">    expression     = "(?:^|[\s"'.:\-\[\]\(\)\{\}])(?P<severity>DEBUG|TRACE|INFO|WARN|WARNING|ERROR|FATAL|EXCEPTION|[I|i]nfo|[W|w]arn|[E|e]rror|[E|e]xception)(?:$|[\s"'.:\-\[\]\(\)\{\}])"
<meta charset="utf-8">    rule_matcher {
<meta charset="utf-8">        field      = "applicationName"
<meta charset="utf-8">        constraint = "prod"
    {
<meta charset="utf-8">}
As with Rules Groups, rules have a name, description, and enabled flag. They also have three other arguments.
Rules_group_id contains the id of the rules group that the rule belongs to. This allows users to know what Rules Group a rule is part of and re-assign rules to different rules groups.
The type specifies what type the rule is. As explained at the beginning of this section, log parsing rules can come in different types. In this case, the rule type is “extract,” meaning that the rule is designed to extract information to a log and append additional fields to it.
The expression contains the rule itself in the form of a regular expression. In the above example, the rule is designed to search for logs containing words including DEBUG, TRACE, WARNING, and EXCEPTION.
Alerts
A key feature of Coralogix is the ability to create alerts. They enhance observability by alerting DevOps engineers whenever a parameter leaves its optimal state. Terraform lets users define Coralogix alerts with the Coralogix alert resource.
Just like Rules and Rules Groups, each alert has a name argument and an enabled flag. Moreover, there are plenty of additional arguments to determine the properties of the alert.
There are two required arguments in addition to the name and enabled.
The type determines the alert type. This can be either “text” or “ratio.” Text alerts simply provide a message when a system parameter exceeds a certain threshold. For example, Coralogix provides dynamic alerts, which update the threshold using machine learning.
Ratio alerts are slightly more complex. They let you calculate a ratio between two log queries, something that can be useful in areas ranging from system health to marketing.
Severity specifies the alert’s urgency. It can take three values, which include the following – “Info” means the alert simply provides information and the user is under no pressure to act on it. “Warning” is for when the alert provides a warning such as disk space is about to be used up. “Critical” would be for alerts that require immediate action, such as a system outage.
There are four block arguments; arguments whose values require Terraform Configuration Language blocks.
The filter defines what input the alert needs to respond to. This could be particular logs or application behavior. The block contains four optional fields. Text specifies the string query to be alerted on.
Users can decide what applications and subsystems the alert should respond to with the applications and subsystems fields. The severities field enables users to list the log severity levels they want to be alerted on.
Condition is where users can define the threshold that triggers the alert. It has three required fields; condition_type works like a relational operator in Java or Python and threshold specifies the number of log occurrences that should trigger the alert. Timeframe determines how long after the event the alert can be triggered.
Schedule determines when the alert should be triggered while notifications control who gets notified about the alert.
Wrapping Up
In this tutorial, we’ve seen how Coralogix can be used in tandem with the popular IaC tool Terraform. Coralogix can be integrated with Terraform through the Terraform Coralogix provider and Terraform provides plenty of enabling features to use key aspects of Coralogix, like rules and alerts.
The power of Infrastructure as Code is that it allows you to configure DevOps infrastructure with the same ease that you write code. Being able to apply that to observability is a very powerful tool.
Be Our Partner
Complete this form to speak with one of our partner managers.
Thank You
Someone from our team will reach out shortly. Talk to you soon!