The new standard of observability is here. Discover Olly, the industry’s first
The simplest CI/CD observability pipeline consists of three stages: build, test, and deploy.
In modern software systems, it is common for several developers to work on the same project simultaneously. Siloed working with infrequent merging of code in a shared repository often leads to bugs and conflicts that are difficult and time-consuming to resolve. To solve this problem, we can adopt continuous integration.
Continuous integration is the practice of writing code in short, incremental bursts and pushing it to a shared project repository frequently so that automated build and testing can be run against it. This ensures that when a developer’s code gets merged into the overall project codebase, any integration problems are detected as early as possible. The automatic build and testing are handled by a CI server.
If passing the automated build and testing results in code being automatically deployed to production, that is called continuous deployment.
All the sequential steps that need to be automatically executed from the moment a developer commits a change to it being shipped to production is referred to as a CI/CD pipeline. CI/CD pipelines can range from very simple to very complex, depending on the needs of the application.
Important considerations when developing CI/CD pipelines
Building a CI/CD pipeline is no simple task. It presents numerous challenges, some of which include:
Automating the wrong processes
The whole premise of CI/CD is to increase developer productivity and optimize time-to-market. This goal gets defeated when the CI/CD pipeline has many steps in it that aren’t necessary or that could be done faster manually.
When developing a CI/CD pipeline, you should:
- consider how long a task takes to perform manually and whether it is worth automating
- evaluate all the steps in the CI/CD pipeline and only include those that are necessary
- analyze performance metrics to determine whether the pipeline is improving productivity
- understand the technologies you are working with and their limitations as well as how they can be optimized so that you can speed up the build and testing stages.
Ineffective testing
Tests are written to find and remove bugs and ensure that code behaves in the desired manner. You can have a great CI/CD pipeline in place but still get bug-ridden code in production because of poorly written, ineffective tests.
To improve the effectiveness of a CI/CD pipeline, you should:
- write automated tests during development, ideally by practicing test-driven development (TDD)
- examine the tests to ensure that they are of high quality and suitable for the application
- ensure that the tests have decent code coverage and cover all the appropriate edge cases
Lack of observability in CI/CD pipelines
Continuous integration and continuous deployment underpin agile development. Together they ensure that features are developed and released to users quickly while maintaining high quality standards. This makes the CI/CD pipeline business-critical infrastructure.
The more complex the software being built, the more complex the CI/CD pipeline that supports it. What happens when one part of the pipeline malfunctions? How do you discover an issue that is causing the performance of the CI/CD pipeline to degrade?
It is important that developers and the platform team are able to obtain data that answers these critical questions right from the CI/CD pipeline itself so that they can address issues as they arise.
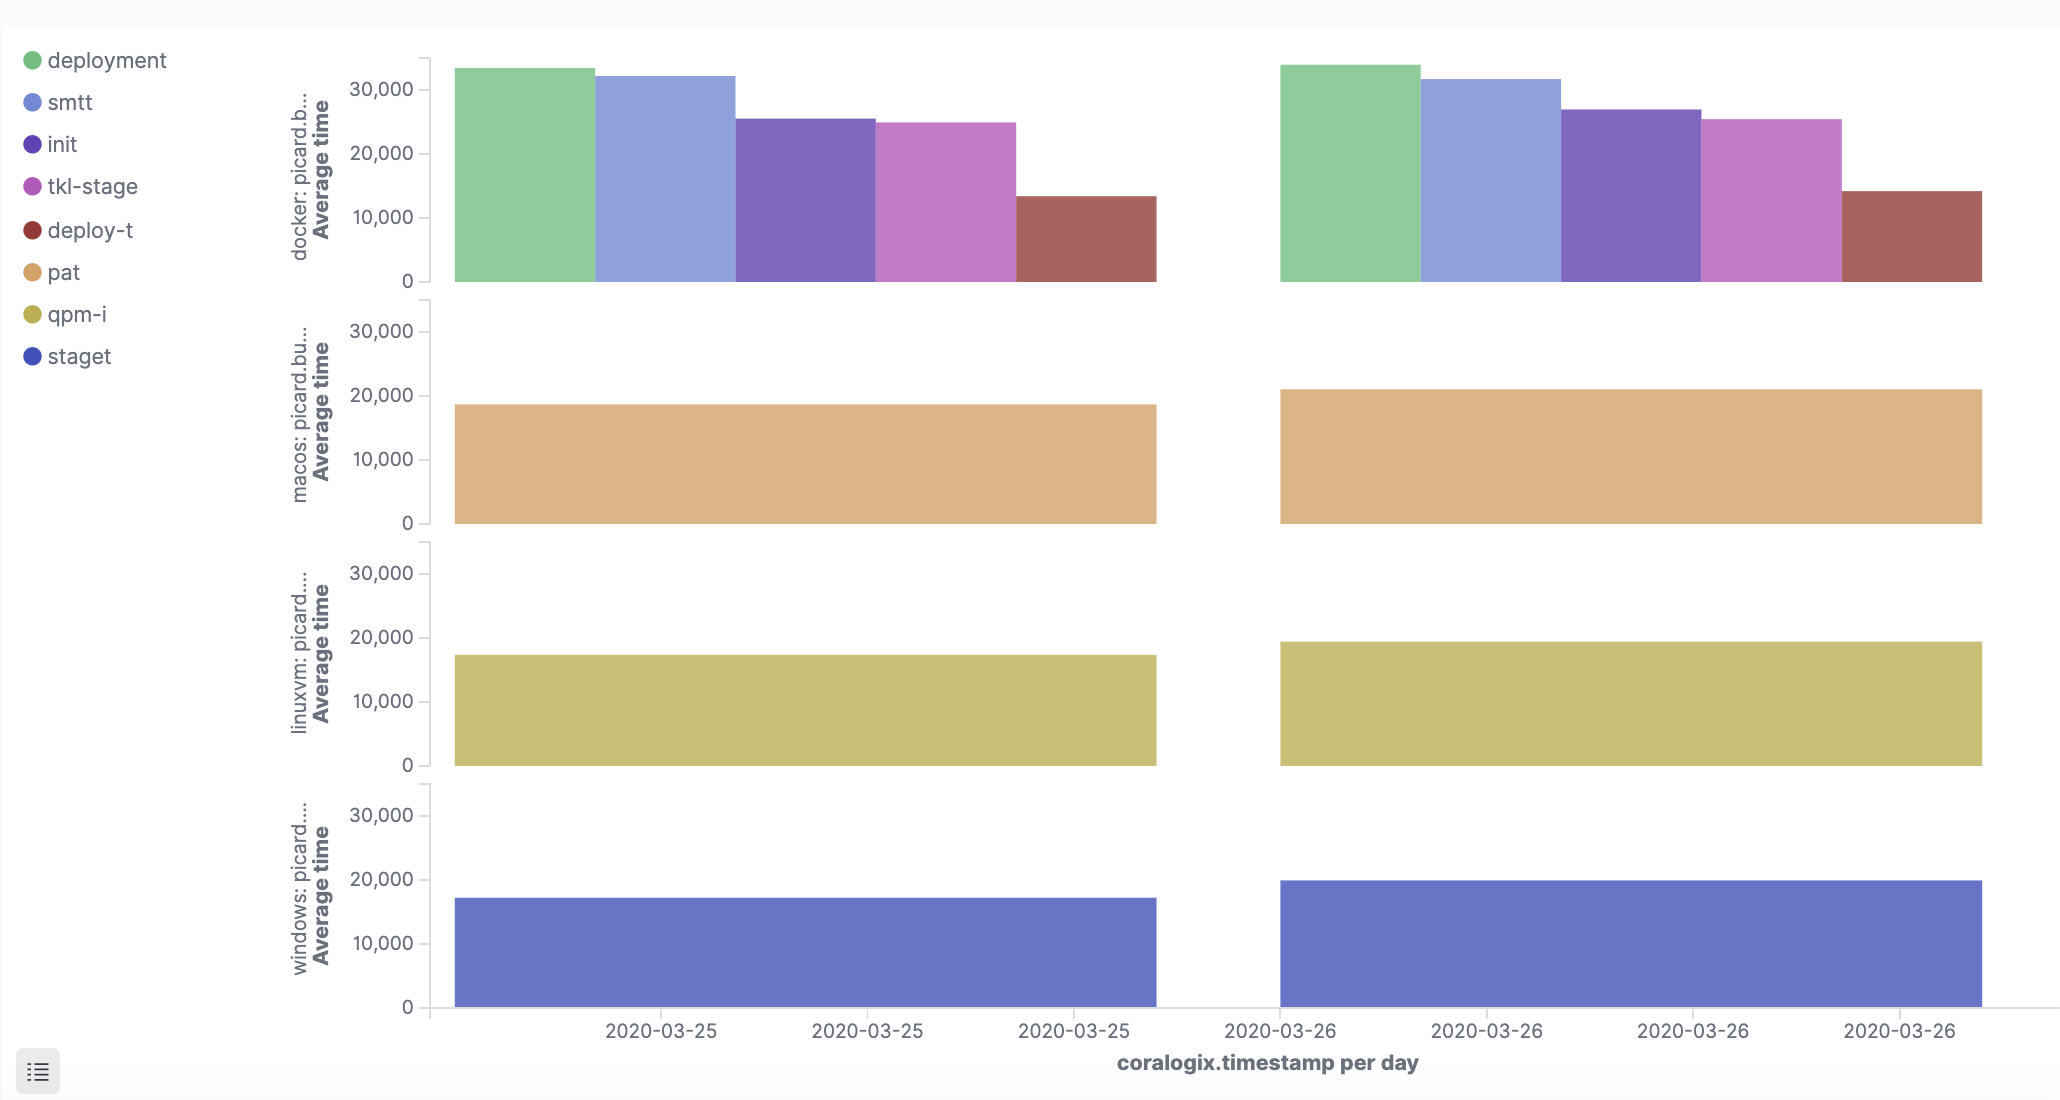
Making a CI/CD pipeline observable means collecting quality and performance metrics on each stage of the CI/CD pipeline and thus proactively working to ensure the reliability and optimal performance of this critical piece of infrastructure.
Quality metrics
Quality metrics help you identify how good the code being pushed to production is. While the whole premise of a CI/CD pipeline is to increase the speed at which software is shipped to get fast feedback from customers, it is also important to not be shipping out buggy code.
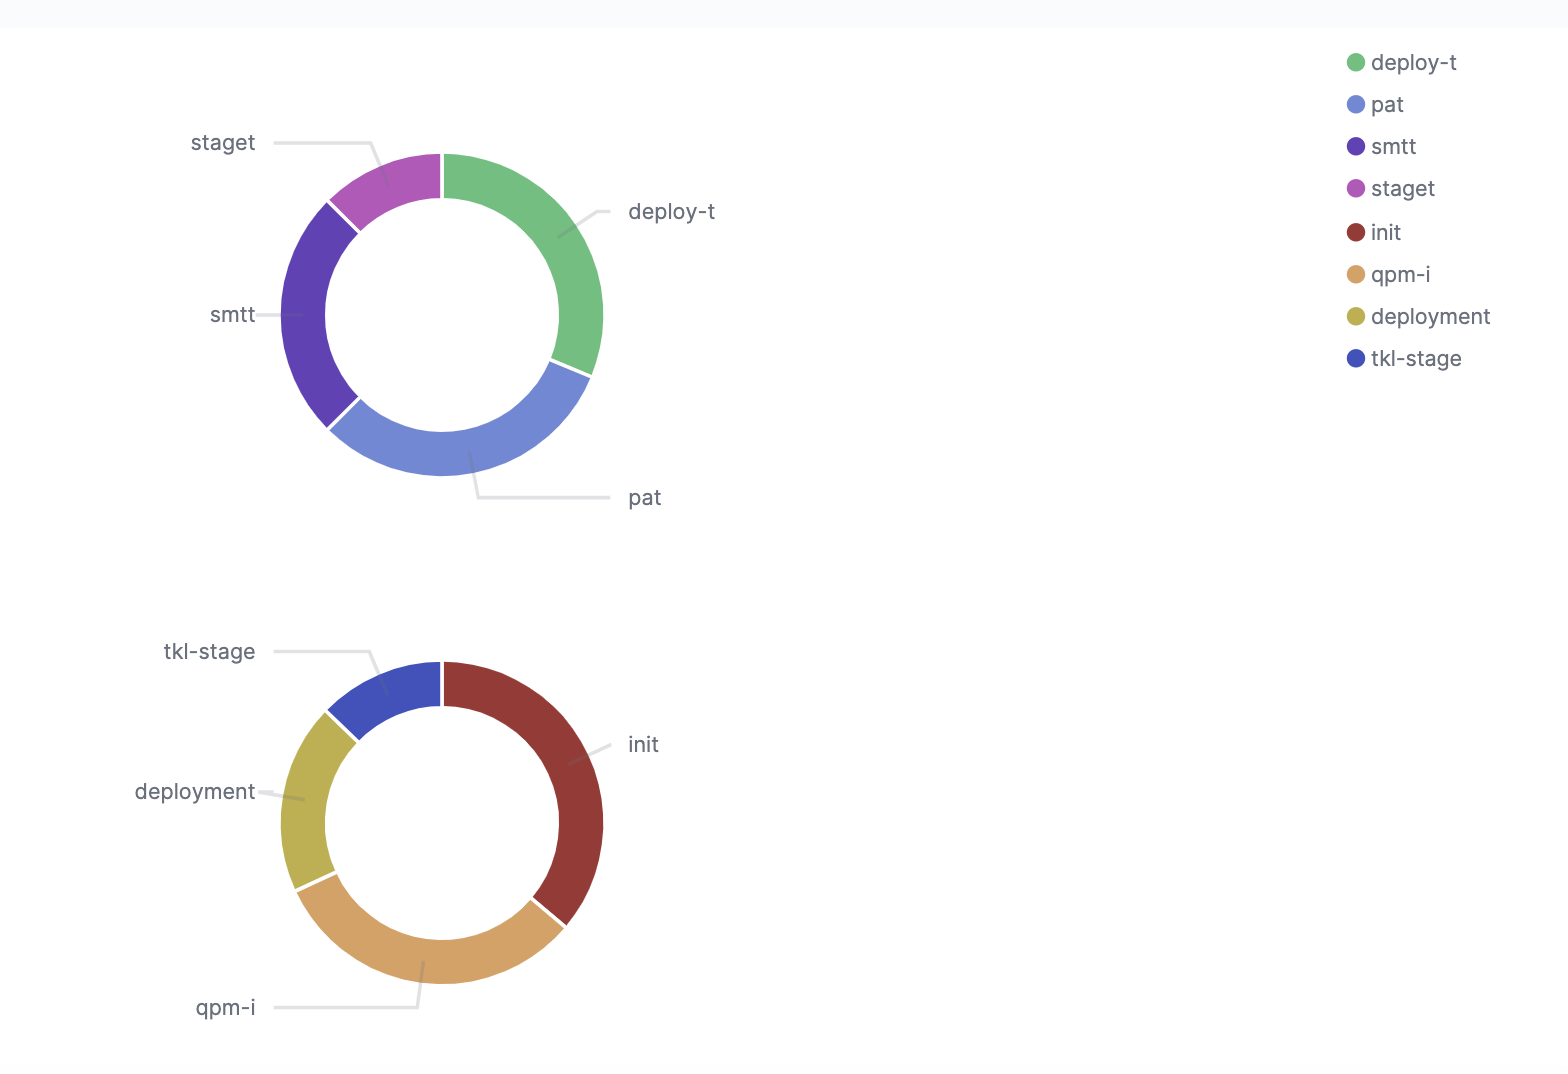
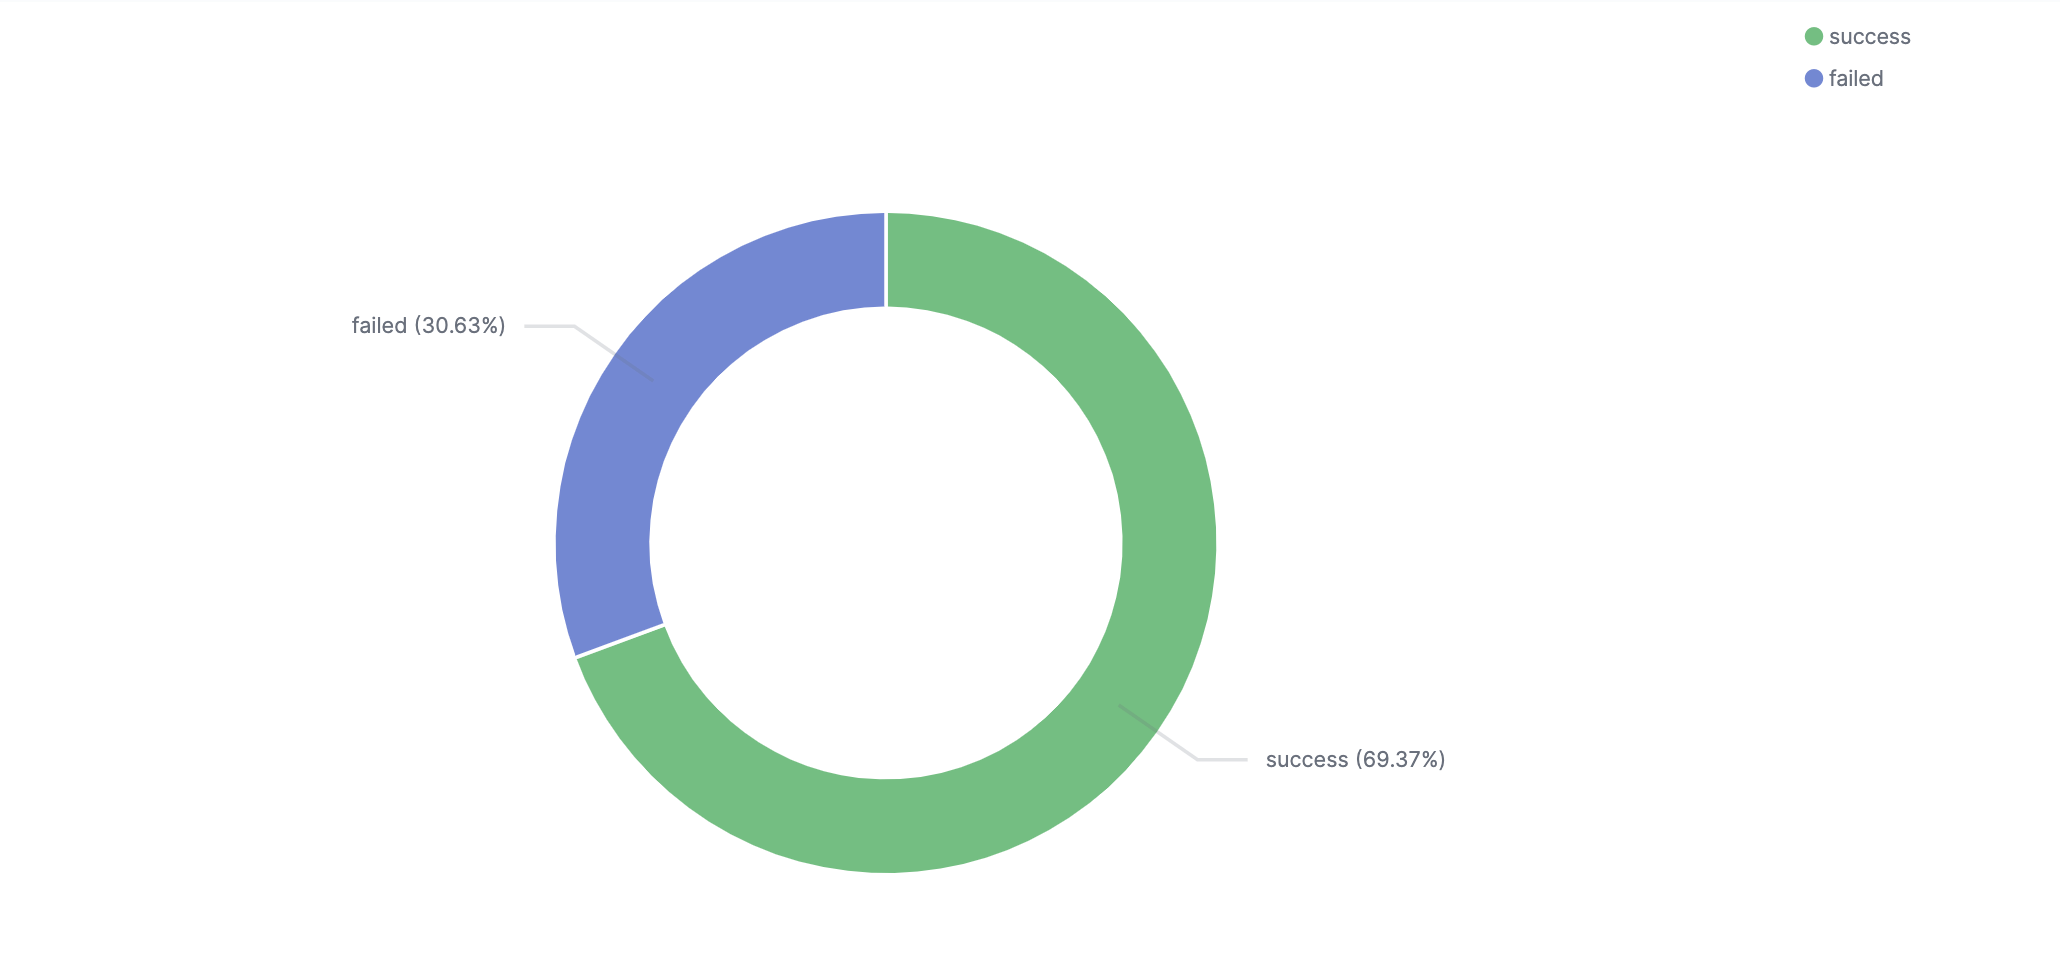
By tracking things like test pass rate, deployment success rate, and defects escape rate you can more easily identify where to improve the quality of code being produced.
Productivity metrics
An effective CI/CD pipeline is a performant one. You should be able to build, test, and ship code as quickly as possible. Tracking performance-related metrics can give you insight into how performant your CI/CD pipeline is and enable you to identify and fix any bottlenecks causing performance issues.
Performance-based metrics include time-to-market, defect resolution time, deployment frequency, build/test duration, and the number of failed deployments.
Observability in your CI/CD pipeline
The first thing needed to make a CI/CD pipeline observable is to use the right observability tool. Coralogix is a stateful streaming analytics platform that allows you to:
- Analyze and monitor your log data in the context of your CI/CD pipeline and without indexing to enable full observability without breaking your budget.
- Collect all system metrics and access unlimited granularity, cardinality, and labeling with no additional costs. Get maximum coverage for your systems with straightforward pricing.
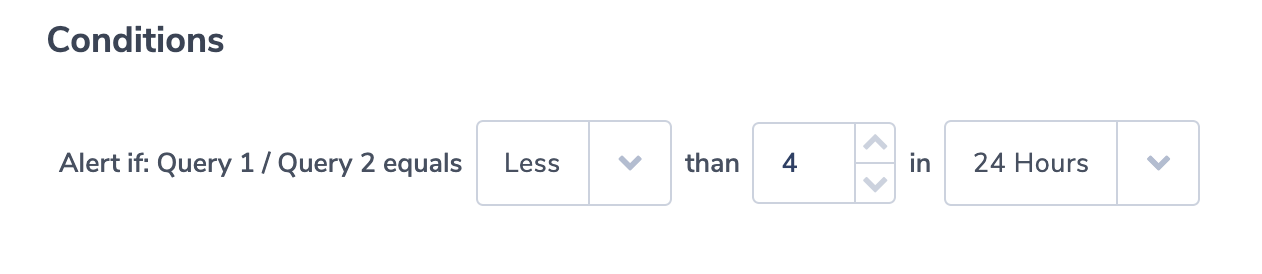
The observability tool you choose can then be configured to track and report on the observability metrics most pertinent to your application.
When an issue is discovered, the common practice is to have the person who committed the change that resulted in the issue investigate the problem and find a solution. The benefit of this approach is that it makes team members have a sense of complete end-to-end ownership of any task they take on as they have to ensure it gets shipped successfully.
Another good practice is to conduct a post-mortem reviewing the incident to identify what worked to resolve it and how things can be done better next time. The feedback from the post-mortem can also be used to identify where CI/CD pipeline can be improved to prevent future issues.
Example of a simple CircleCI CI/CD pipeline
There are a number of CI servers you can use to build your CI/CD pipeline. Popular ones include Jenkins, CircleCI, Gitlab and a newcomer Github Actions.
Coralogix provides integrations with CircleCI, Jenkins, and Gitlab that enable you to quickly and easily send logs and metrics to Coralogix from these platforms.
The general principle of most CI servers is that you define your CI/CD pipeline in a yml file as a workflow consisting of sequential jobs. Each job defines a particular stage of your CI/CD pipeline and can consist of multiple steps.
An example of a CircleCI CI/CD pipeline for building and testing a python application is shown in the code snippet below.
To add a deploy stage, you can use any one of the deployment orbs CircleCI provides. An orb is simply a reusable configuration package CircleCI makes available to help simplify your deployment configuration. There are orbs for most of the common deployment targets, including AWS and Heroku.
The completed CI/CD pipeline with deployment to Heroku is shown in the code snippet below.
Having created this CI/CD pipeline you would think that you are done, but in fact, you have only done half the job. The above CI/CD pipeline is missing a critical component to make it truly effective: observability.
Making the CI/CD pipeline observable
Coralogix provides an orb that makes it simple to integrate your CircleCI CI/CD pipeline. This enables you to send pipeline data to Coralogix in real-time for analysis of the health and performance of your pipeline.
The Coralogix orb provides four endpoints:
- coralogix/stats for sending the final report of w workflow job to Coralogix
- coralogix/logs for sending the logs of all workflow jobs to Coralogix for debugging
- coralogix/send for sending 3rd party logs generated during a workflow job to Coralogix
- coralogix/tag for creating a tag and a report for the workflow in Coralogix
To add observability to your CircleCI pipeline:
- In your Coralogix account, go ahead and enable Pipelines by navigating to Project Settings -> Advanced Settings -> Pipelines and turn it on
- Add the Coralogix orb stanza at the top of your CircleCI configuration file
- Use the desired Coralogix endpoint in your existing pipeline
The example below shows how you can use Coralogix to debug a CircleCI workflow. Adding the coralogix/logs job at the end of the workflow means that all the logs generated by CircleCI during the workflow will be sent to your Coralogix account, which will allow you to debug all the different jobs in the workflow.
Conclusion
CI/CD pipelines are a critical piece of infrastructure. By making your CI/CD pipeline observable you turn it into a source of real-time actionable insight into its health and performance.
Observability of CI/CD pipelines should not come as an after-thought but rather something that is incorporated into the design of the pipeline from the onset. Coralogix provides integrations for CircleCI and Jenkins that make it a reliable partner for introducing observability to your CI/CD pipeline.