With over 7.3 million docker accounts created in 2021, Docker’s popularity has seen a meteoric rise since its launch in 2013. However, more businesses using it also means attackers are incentivized to target docker vulnerabilities.
As per a 2020 report, 50% of poorly configured docker instances were subjected to cyber-attacks. And it’s not that easy to spot these poor configurations either because you must conduct checks at multiple levels.
What if attackers create a Malware-laden container and upload it to your company’s data repositories due to these poor configurations? The business impact this untrusted container can cause is horrifying, isn’t it?
Consider adding container security to your DevOps pipeline if you’re using Docker to set up containers and portability easily. With the rising number of organization-level cyberattacks, container security needs to be part of your overall security framework.
What is Container Security?
From CI/CD pipeline, container runtime, and protecting applications running on containers, container security encompasses risk management throughout your environment. The process of docker container security is similar, but you have to address a few safety concerns.
A prerequisite to container security is observability. Container-based deployments can include tens or hundreds of services being spun up at a given instant. Thus, logging and monitoring across these multiple cloud and on-premise environments become serious challenges. You need to use a full-stack observability platform like Coralogix to get a complete picture of your containerized environment’s health.
After you have observability in place, using a robust set of container security best practices will help you in the long term, especially when your company looks to expand the dockers in the environment. Let’s look at some of the prominent ones for protecting containerized applications.
Container Security Best Practices
1. Using minimal and secure base images
Cloud developers often use a large number of images for their Docker containers. If your project doesn’t require system libraries and utilities, you must avoid using an entire OS as a base image. Let’s understand why.
Bundling images can increase the chances of vulnerabilities. We recommend you use minimal images with just the right number of libraries and tools sufficient for your project. By doing so, you are consciously cutting down the attack surface.
2. Securing Container Runtime
In an agile setup, securing container applications’ runtime is typically the developer’s responsibility. In case of a network breach, it is vital to configure the runtime settings to curb the damage immediately. Developers need to keep track of container engine runtime settings.
Kubernetes comes with built-in tools that enhance container security, such as:
Network policies – to finely control container behavior.
Admission controllers – apply rules customized for specific attack parameters.
Role-Based Access Control (RBAC) – fine-tune authorization policies at the cluster level.
Secrets – use the secrets management tool to store your credentials instead of saving them in container images or configuration files.
Falco – analyzes threats using its audit logging feature.
3. Securing Registries
In addition to ensuring docker container security, protecting the container infrastructure stack is equally essential. Registries (storage and distribution platforms for docker images) can act as a hub for vulnerabilities and malware.
As a safe practice, always provide role-based “need-to-know” access for any user that needs to access the registries.
4. Securing Container Orchestrators such as Kubernetes
Container orchestration means using tools to automate the operations associated with running containers. Orchestration platforms like Kubernetes help automate tasks like assigning specific nodes to containers and their efficient packing.
Although Kubernetes helps you manage container applications, it doesn’t secure the health of the underlying infrastructure. You must build observability at a full-stack level to keep track of system behavior.
To ensure real-time security, you need to leverage the log data stored by Kubernetes in the nodes. Forward these logs to a centralized observability platform like Coralogix, and you can now perform Kubernetes monitoring seamlessly.
5. Securing the build pipeline
You can create an additional security layer for your containerized applications’ CI/CD pipelines. Scan your container images during their entry into registries.
These checks help detect malicious code that slipped your security checks in the earlier stages of your build pipelines. How does this slippage happen?
Vulnerabilities may be absent at the source code stage but may enter as a part of dependencies as the code proceeds through the build pipeline. Tools like SAST or SCA, which perform checks at the source stage, may fail to detect these. Scanning at the registry stage improves the probability of detection of these vulnerabilities.
6. Securing deployment
Use these five steps to make your container deployment more secure:
Run third-party debugging tools like the static analysis on your Container code. This step identifies coding errors that lead to security issues.
Broaden your testing framework. In addition to testing functions, also cross-check dependencies and their associated vulnerabilities.
Destroy affected containers instead of patching them. This practice will help avoid the chances of manual errors.
Ensure your host system meets CIS benchmarks. The container software and orchestrator at the host need to satisfy this compliance standard to avoid insecure code.
Restrict container privileges. Enabling root privileges and flags allows attackers to gain control outside the container and stage an attack.
7. Monitoring Container Traffic
Container traffic involves the continuous collection of application metrics needed for their health and smooth operation. As a developer, you can identify irregular traffic patterns in your container patterns via API monitoring. You can trace connections between containers and external entities.
Another safety practice is by strengthening your defenses against traffic sniffing via Kubernetes. Enable Transport Layer Security (TLS) to authenticate user identities at both ends.
Default Kubernetes permit unrestricted traffic between pods. You can tighten the traffic by configuring network policies.
Improving Container Security with Coralogix
As your container environment grows, traditional monitoring just isn’t enough. With applications distributed across environments, full-stack observability fills in the blind spots of complex IT systems and their dependencies.
Coralogix ensures the security of collaborative containerized environments via real-time observability and data analytics capabilities. You can view application metrics from logs, traces, and metrics on a single centralized dashboard, ensuring hassle-free troubleshooting and security control.
Amazon ELB (Elastic Load Balancing) allows you to make your applications highly available by using health checks and intelligently distributing traffic across a number of instances. It distributes incoming application traffic across multiple targets, such as Amazon EC2 instances, containers, IP addresses, and Lambda functions. You might have heard the terms, CLB, ALB, and NLB. All of them are types of load balancers under the ELB umbrella.
Types of Load Balancers
CLB: Classic Load Balancer is the previous generation of EC2 load balancer
ALB: Application Load Balancer is designed for web applications
NLB: Network Load Balancer operates at the network layer
This article will focus on ELB logs, you can get more in-depth information about ELB itself in this post
ELB Logs
Elastic Load Balancing provides access logs that capture detailed information about requests sent to your load balancer. Each ELB log contains information such as the time the request was received, the client’s IP address, latencies, request paths, and server responses.
ELB logs structure
Because of the evolution of ELB, documentation can be a bit confusing. Not surprisingly, there are three variations of the AWS ALB access logs; ALB, NLB, and CLB. We need to rely on the document header to understand which of the variant logs it describes (the URL and body will usually reference ELB generically).
How to collect ELB logs
The ELB access logging monitoring capability is integrated with Coralogix. The logs can be easily collected and sent straight to the Coralogix log management solution.
ALB Log Example
This is an example of a parsed ALB HTTP entry log:
Note that if you compare this log to the AWS log syntax table, we split the client address and port and target address and port into four different fields to make it easier.
ELB logs contain unstructured data. Using Coralogix parsing rules, you can easily transform the unstructured ELB logs into JSON format to get the full power of Coralogix and the Elastic stack working for you. Parsing rules use RegEx and I created the expressions for NLB, ALB-1,ALB-2, and CLB logs. The two ALB regexes cover “normal” ALB logs and the special cases of WAF, Lambda, or failed or partially fulfilled requests. In this cases AWS assigns the value ‘-‘ to the target_addr field with no port. You will see some time measurements assigned the value -1. Make sure you take it into account in your visualizations filters. Otherwise averages and other aggregations could be skewed. Amazon may add fields and change the log structure from time to time, so always check these against your own logs and make changes if needed. The examples should provide a solid foundation.
The following section requires some familiarity with regular expressions but just skip directly to the examples if you prefer.
A bit about why the regexes were created the way they were. Naturally, we always want to use a regex that is simple and efficient. At the same time, we should make sure that each rule captures the correct logs in the correct way (correct values matched with the correct fields). Think about a regex that starts with the following expression:
^(?P<timestamp>[^s]+)s*
It will work as long as the first field in the unstructured log is a timestamp, like in the case of CLB logs. However, in the case of NLB and ALB logs, the expression will capture the “type” field instead. Since the regex and rule have no context, it will just place the wrong value in the wrong JSON key. There are other differences that can cause problems like different numbers of fields or field order. To avoid this problem, we use the fact that NLB logs always start with ‘tls 1.0’ standing for the fields ’type’ and ‘version’, and that ALB logs start with a ‘type’ field with 6 optional values (http, https, h2, ws, wss).
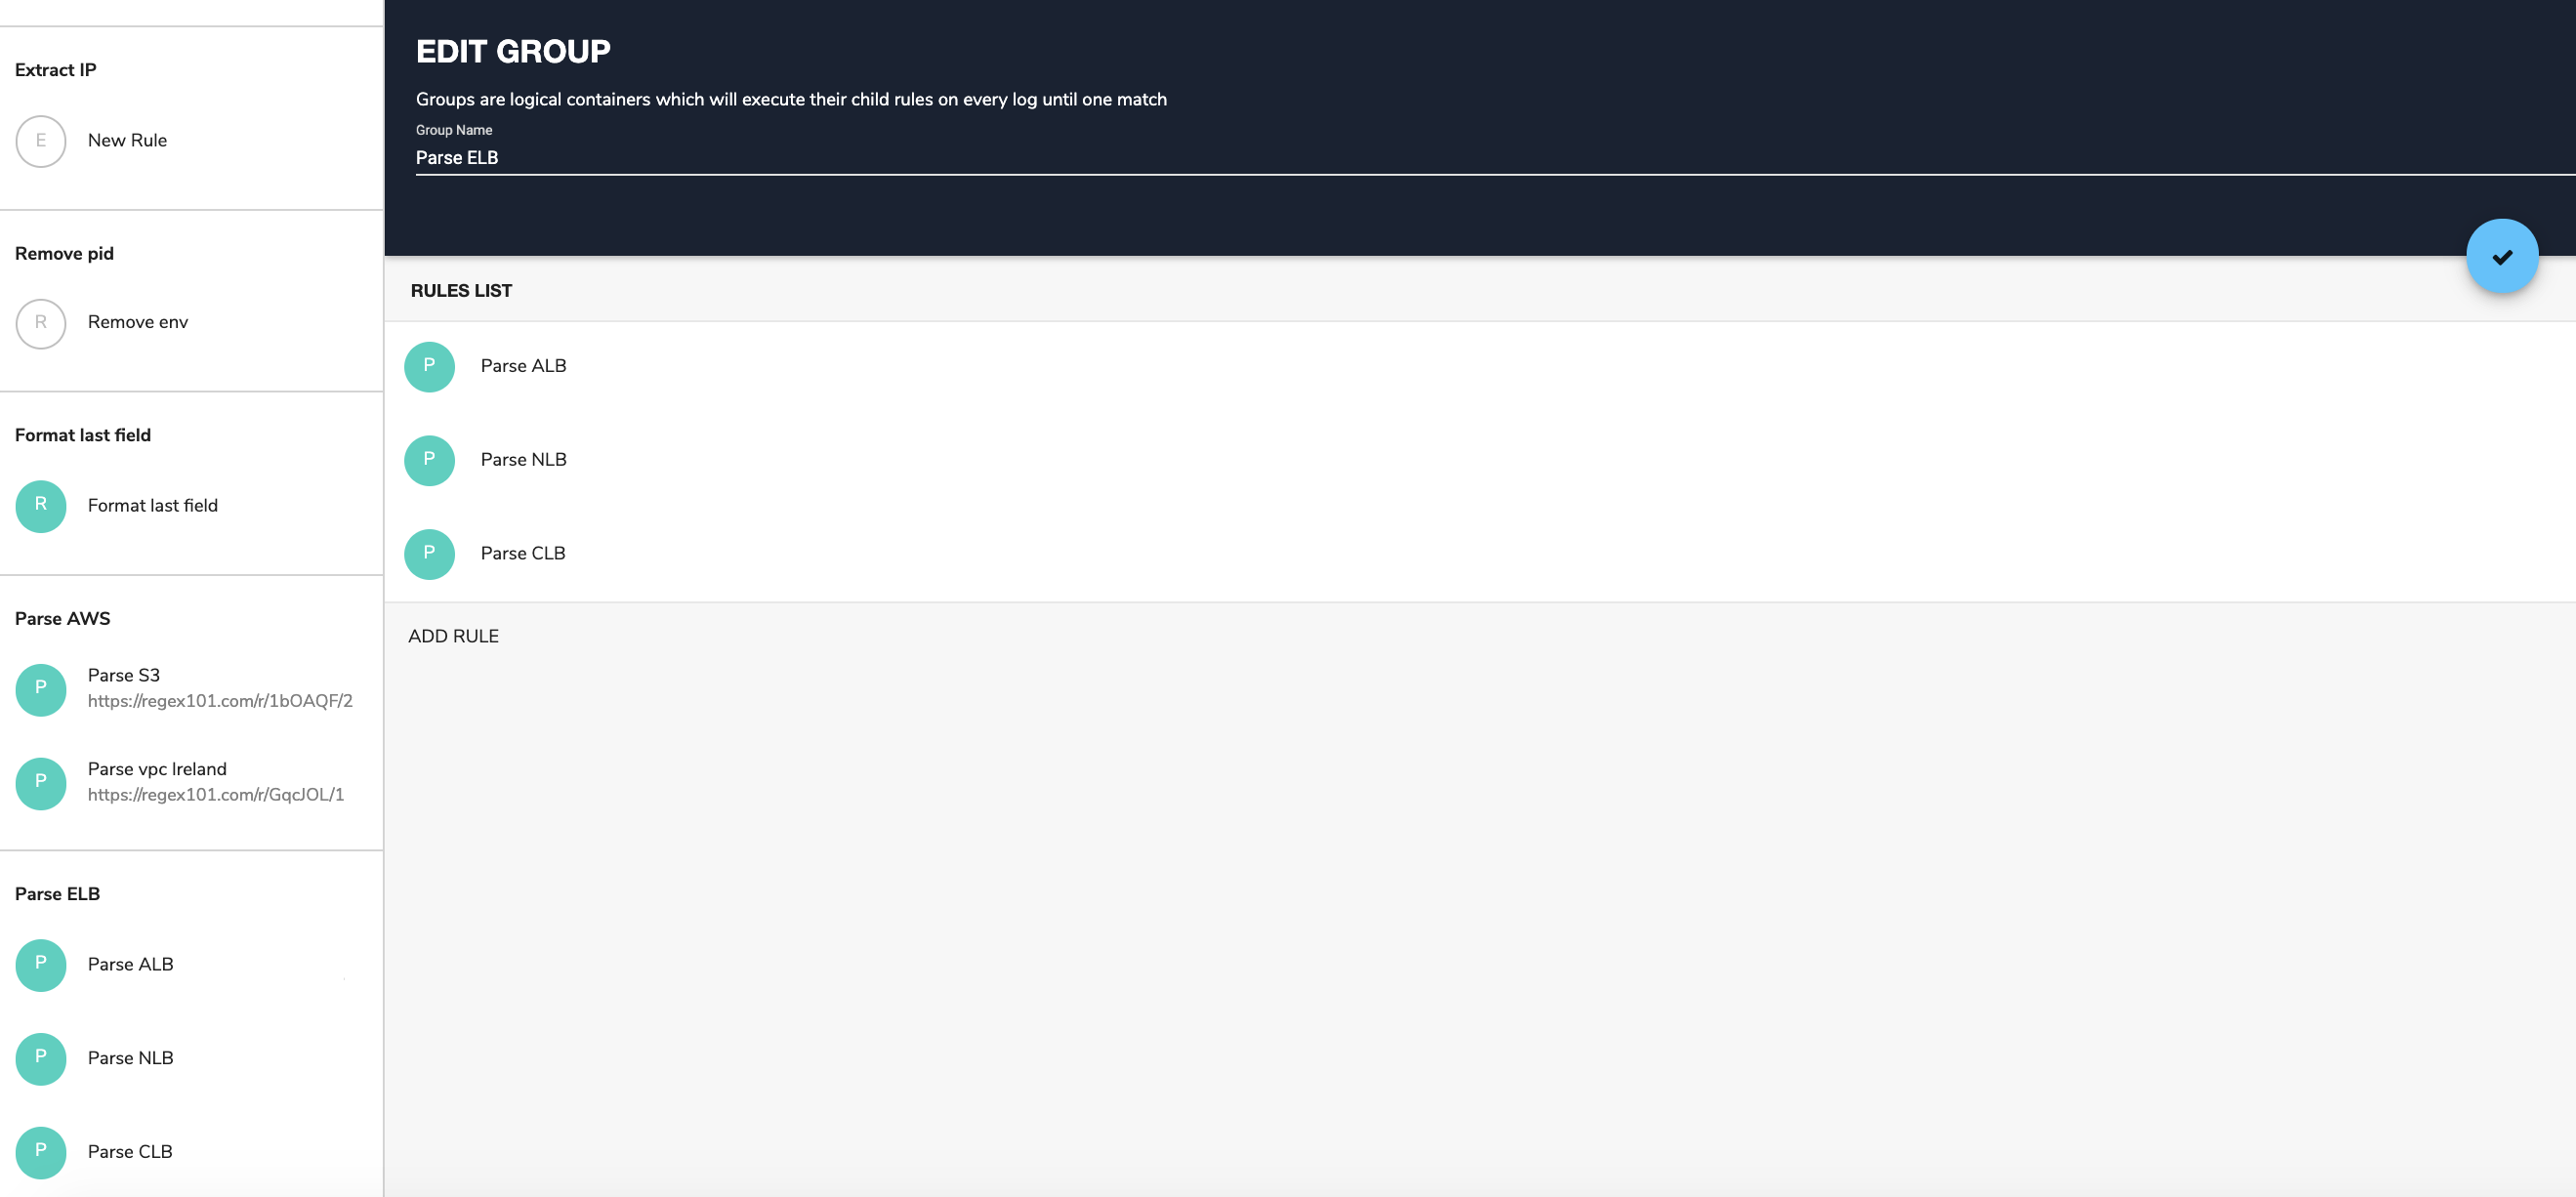
Note: As explained in the Coralogix rule tutorial, rules are organized by groups and executed by the order they appear within the group. When a rule matches a log, the log will move to the next group without processing the remaining rules within the same group.
Taking all this into account, we should:
Create a rule group called ‘Parse ELB’
Put the ALB and NLB rules first (these are the rules that look for the specific beginning of the respective logs) in the group
This approach will guarantee that each rule matches with the correct log.Now we are ready for the main part of this post.
In the following examples, we’ll describe how different ELB log fields can be used to indicate operational status. In the examples, we assume that the logs were parsed into JSON format. The examples will rely on the Coralogix alerts engine and on Kibana visualizations. They also provide additional insights into the different keys and values within the logs. Like always, we give you ideas and guidance on how to get more value out of your logs. However, every business environment is different and you are encouraged to take these ideas and build on top of them based on the best implementation for your infrastructure and goals. Last but not least, Elastic Load Balancing logs requests on a best-effort basis. The logs should be used to understand the nature of the requests, not as a complete accounting of all requests. In some cases, we will use ‘notify immediately’ alerts, but you should use ELB as a backup and not as the main vehicle for these types of alerts.
Tip: To learn the details of how to create Coralogix alerts you can read this guide.
Alerts
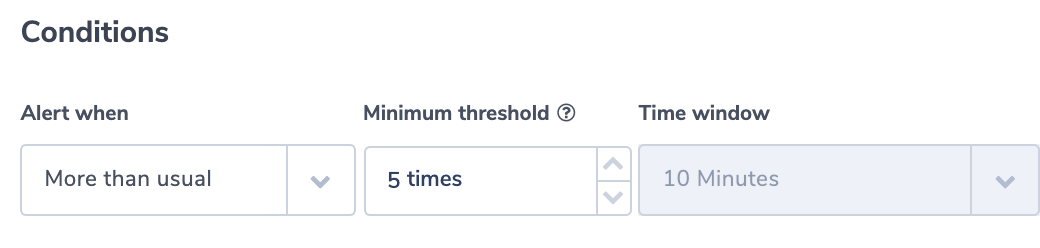
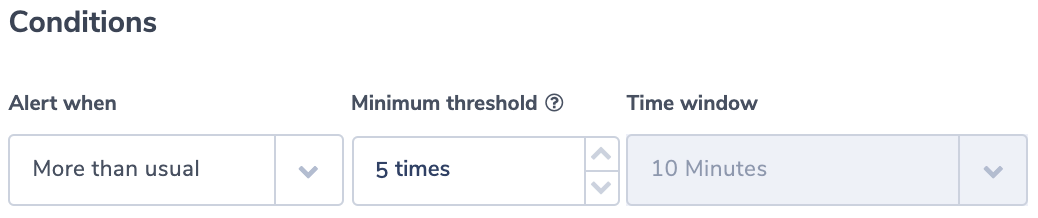
Increase in ELB WAF errors
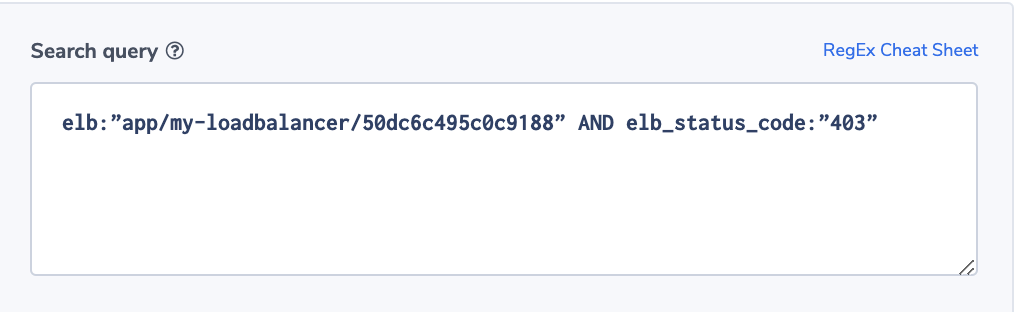
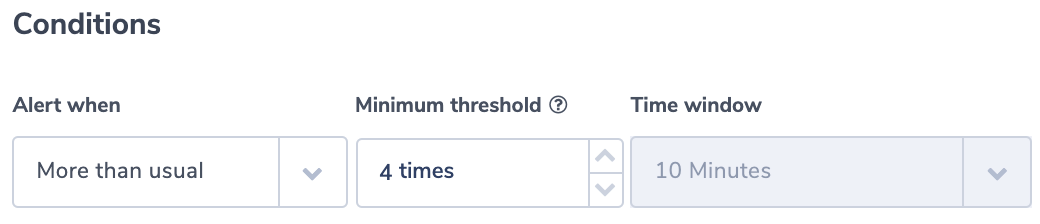
This alert identifies if a specific ELB generates 403 errors more than usual. A 403 error results from a request that is blocked by AWS WAF, Web Application Firewall. The alert uses the ‘more than usual’ option. With this option, Coraloix’s ML algorithms will identify normal behavior for every time period. It will trigger an alert if the number of errors is more than normal and is above the optional threshold supplied by the user.
Alert Filter:
elb:”app/my-loadbalancer/50dc6c495c0c9188” AND elb_status_code:”403”
Alert Condition: ‘More than usual’. The field elb_status_code can be found across ALB, CLB logs.
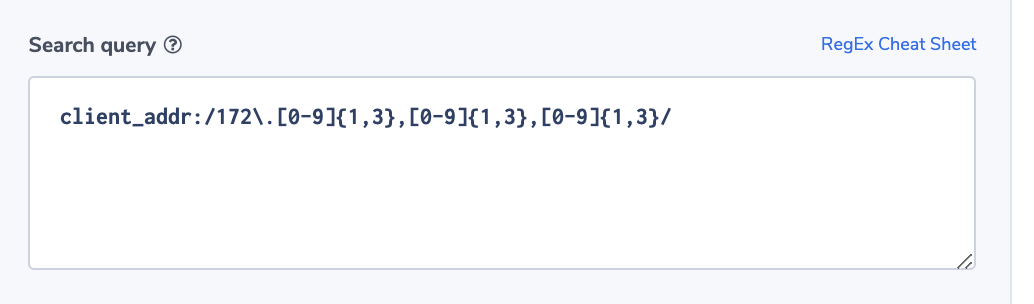
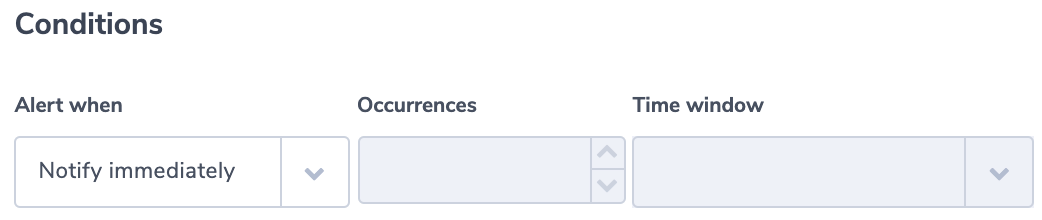
Outbound Traffic from a Restricted Address
In this example, we use the client field. It contains the IP of the requesting client. The alert will trigger if a request is coming from a restricted address. For the purpose of this example, we assume that permitted addresses are all under the subnet 172.xxx.xxx.xxx.
Note: Client_addr is found across NLB, ALB, and CLB.
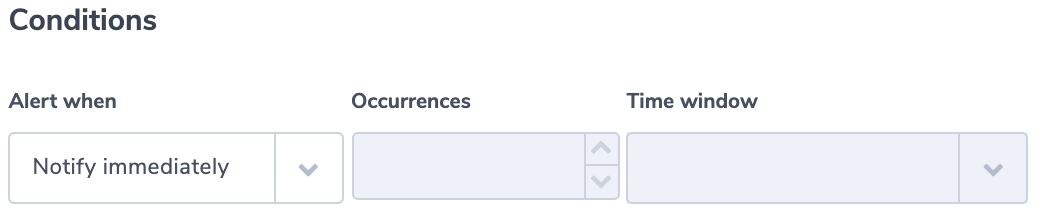
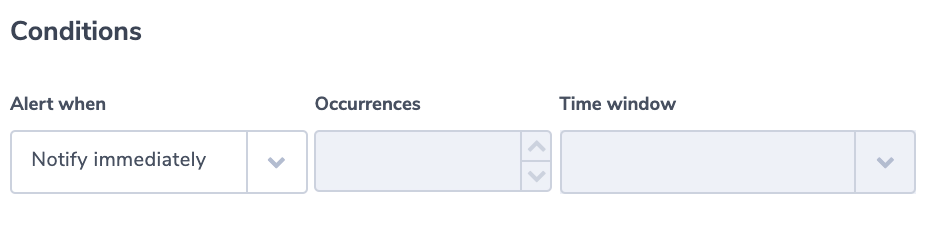
Alert Condition:‘Notify immediately’.
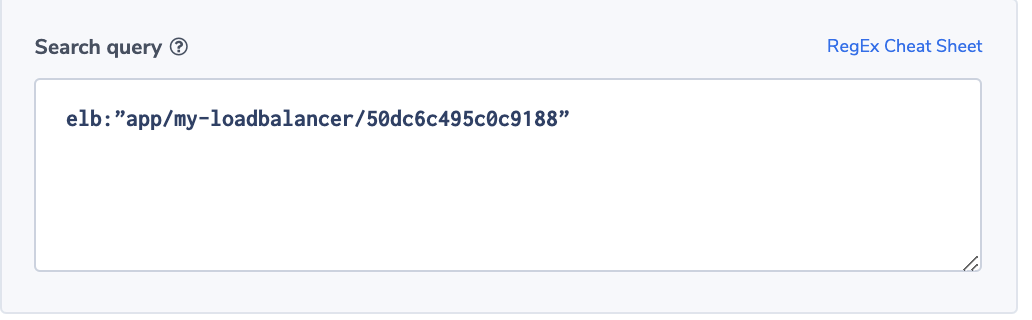
ELB Down
This alert identifies an inactive ELB. It uses the ‘less than’ alert condition. The threshold is set to no logs in 5 minutes. This should be adapted to your specific environment.
Alert Filter:
elb:”app/my-loadbalancer/50dc6c495c0c9188”
Alert Condition: ‘less than 1 in 5 minutes’’
This alert works across NLB, ALB, and CLB.
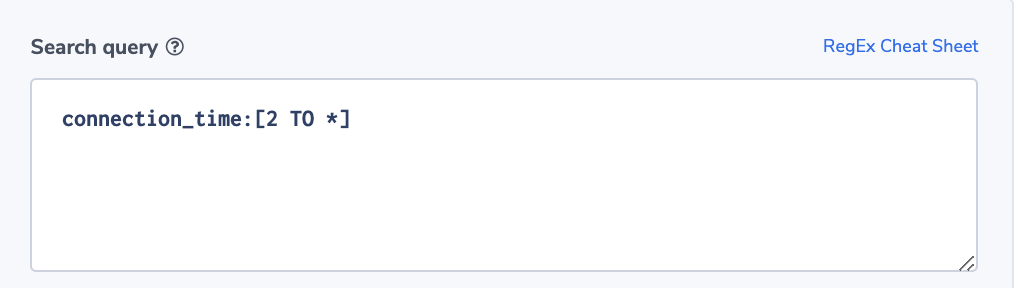
Long Connection Time
Knowing the type of transactions running on a specific ELB, ops would like to be alerted if connection times are unusually long. Here again, the Coralogix ‘more than usual” alert option will be very handy.
Alert Filter:
connection_time:[2 TO *]
Note: Connectiion_time is specific to NLB logs. You can create similar alerts on any of the time-related fields in any of the logs.
Alert Condition: ‘more than usual’
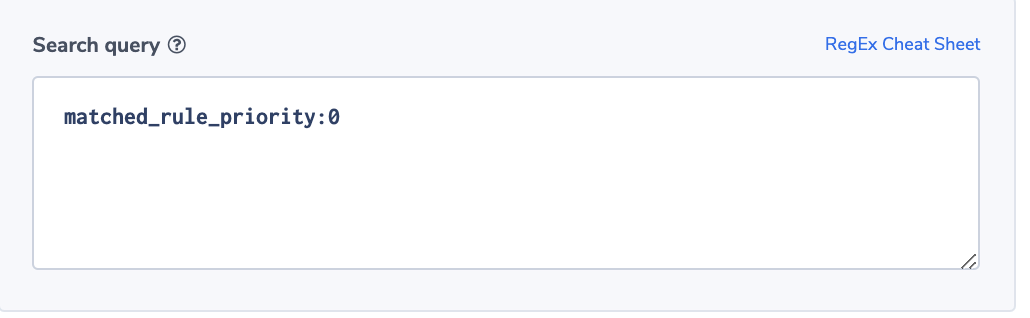
A Surge in ‘no rule’ Requests
The field ‘matched_rule_priority’ indicates the priority value of the rule that matched the request. The value 0 indicates that no rule was applied and the load balancer resorted to the default. Applying rules to requests is specifically important in highly regulated or secured environments. For such environments, it will be important to identify rule patterns and abnormal behavior. Coralogix has powerful ML algorithms focused on identifying deviation from a normal flow of logs. This alert will notify users if the number of requests not matched with a rule is more than the usual number.
Alert Filter:
matched_rule_priority:0
Note: This is an ALB field.
Alert Condition: ‘more than usual’
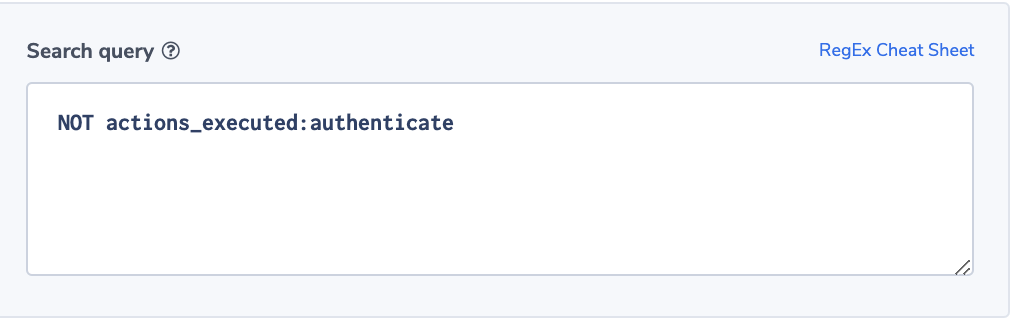
No Authentication
In this example, we assume a regulated environment. One of the requirements is that for every ELB request the load balancer should validate the session, authenticate the user, and add the user information to the request header, as specified by the rule configuration. This sequence of actions will be indicated by having the value ‘authenticate’ in the ‘actions_executed’ field. The field can include a few actions separated by ‘,’. Though ELB doesn’t guarantee that every request will be recorded, it is important to be notified of the existence of such a problem, so we will use the ‘notify immediately’ condition.
Alert Filter:
NOT actions_executed:authenticate
Note: This is an ALB field.
Alert Condition: ‘notify immediately’
Visualizations
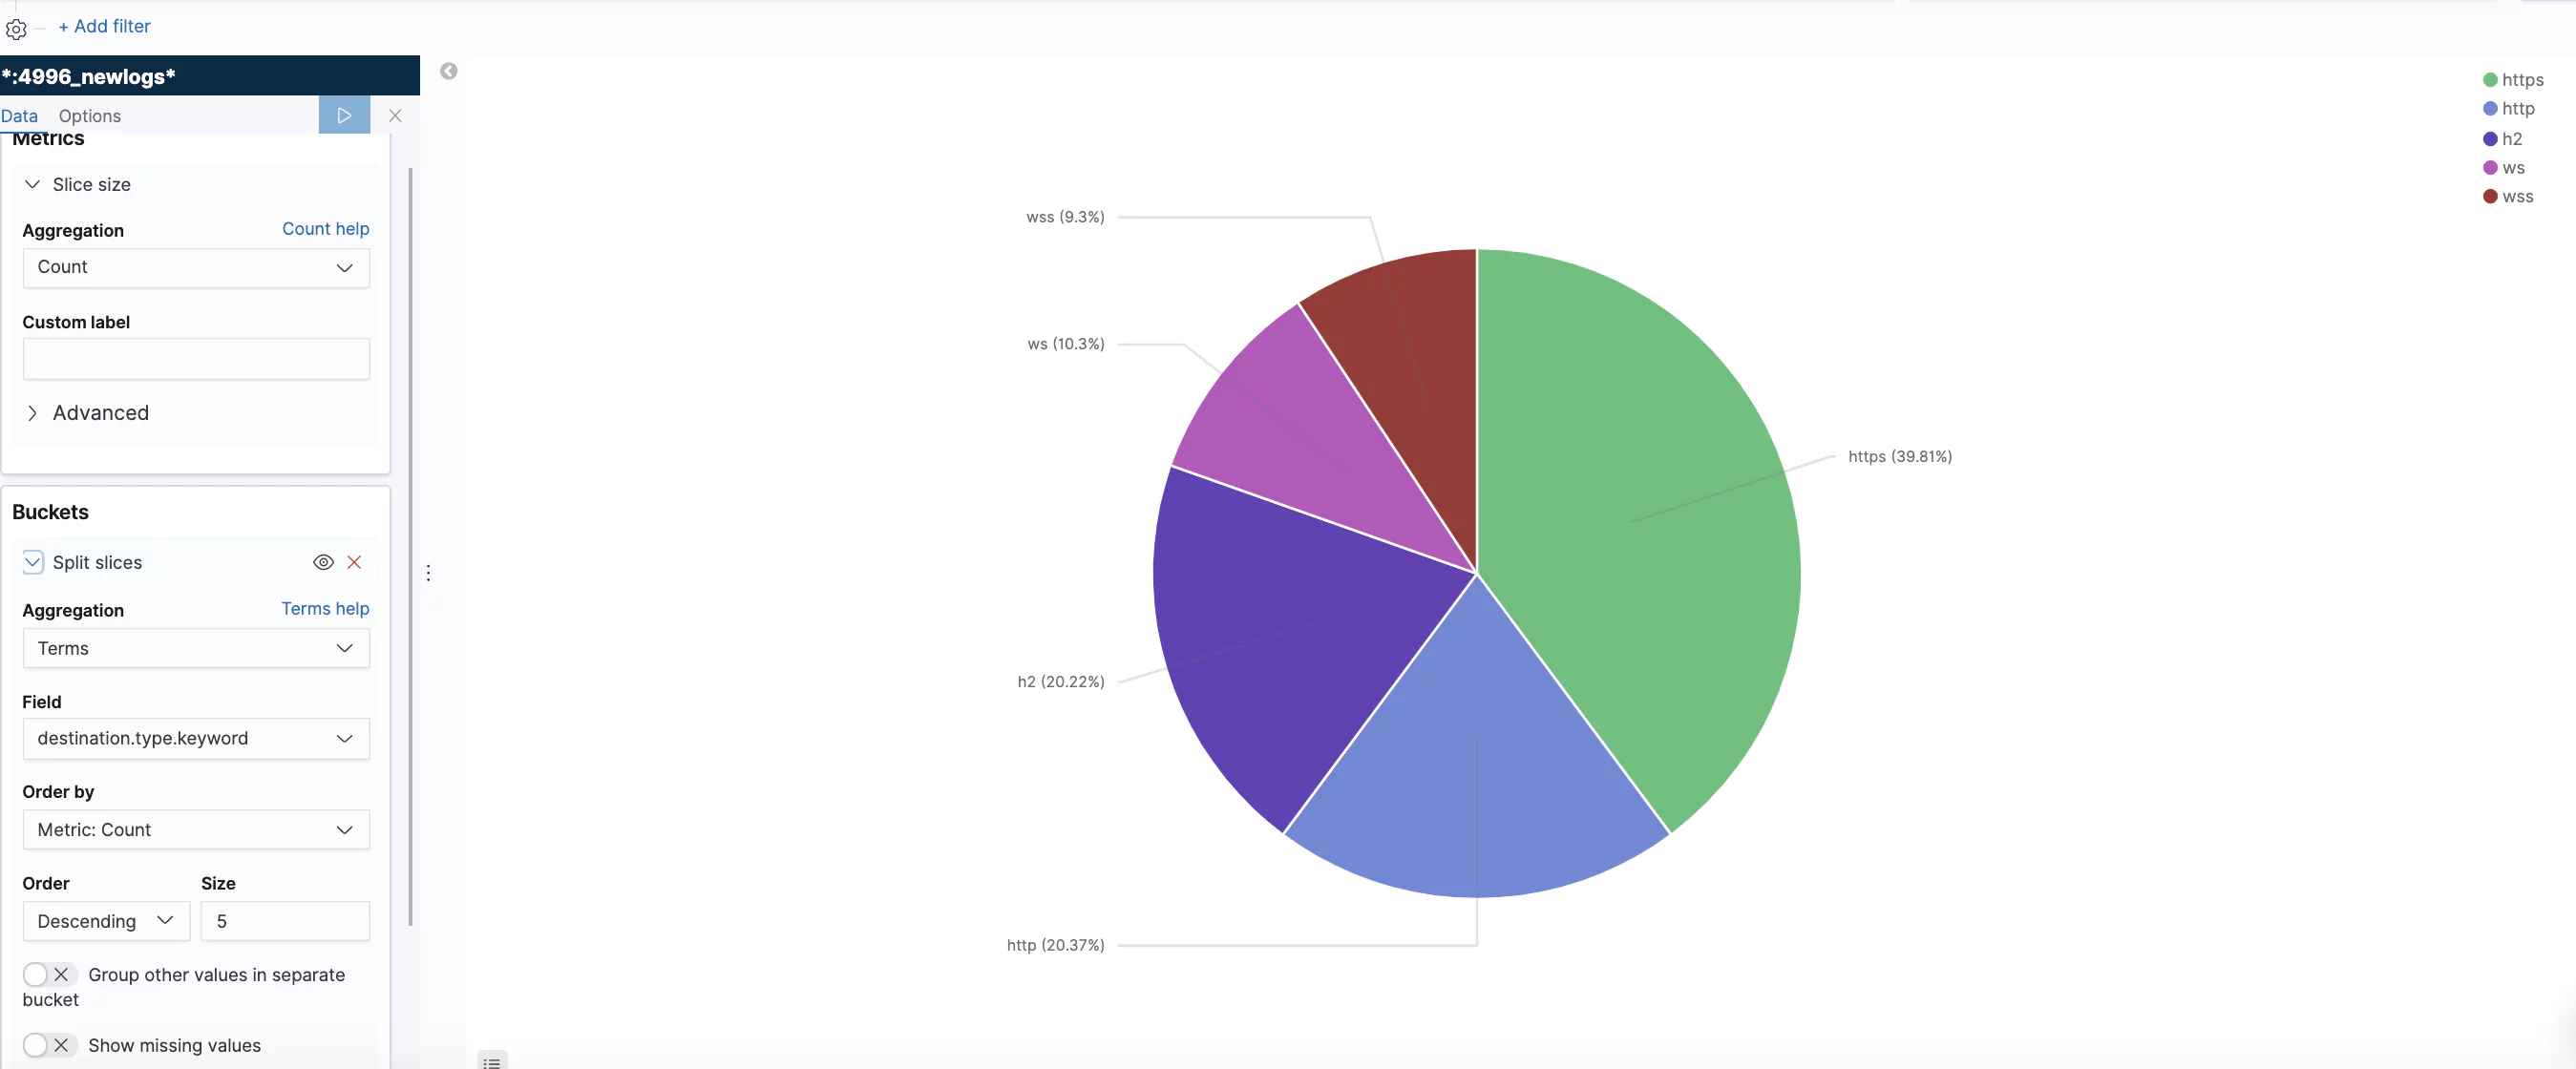
Traffic Type Distribution
Using the ‘type’ field this visualization shows the distribution of the different requests and connection types.
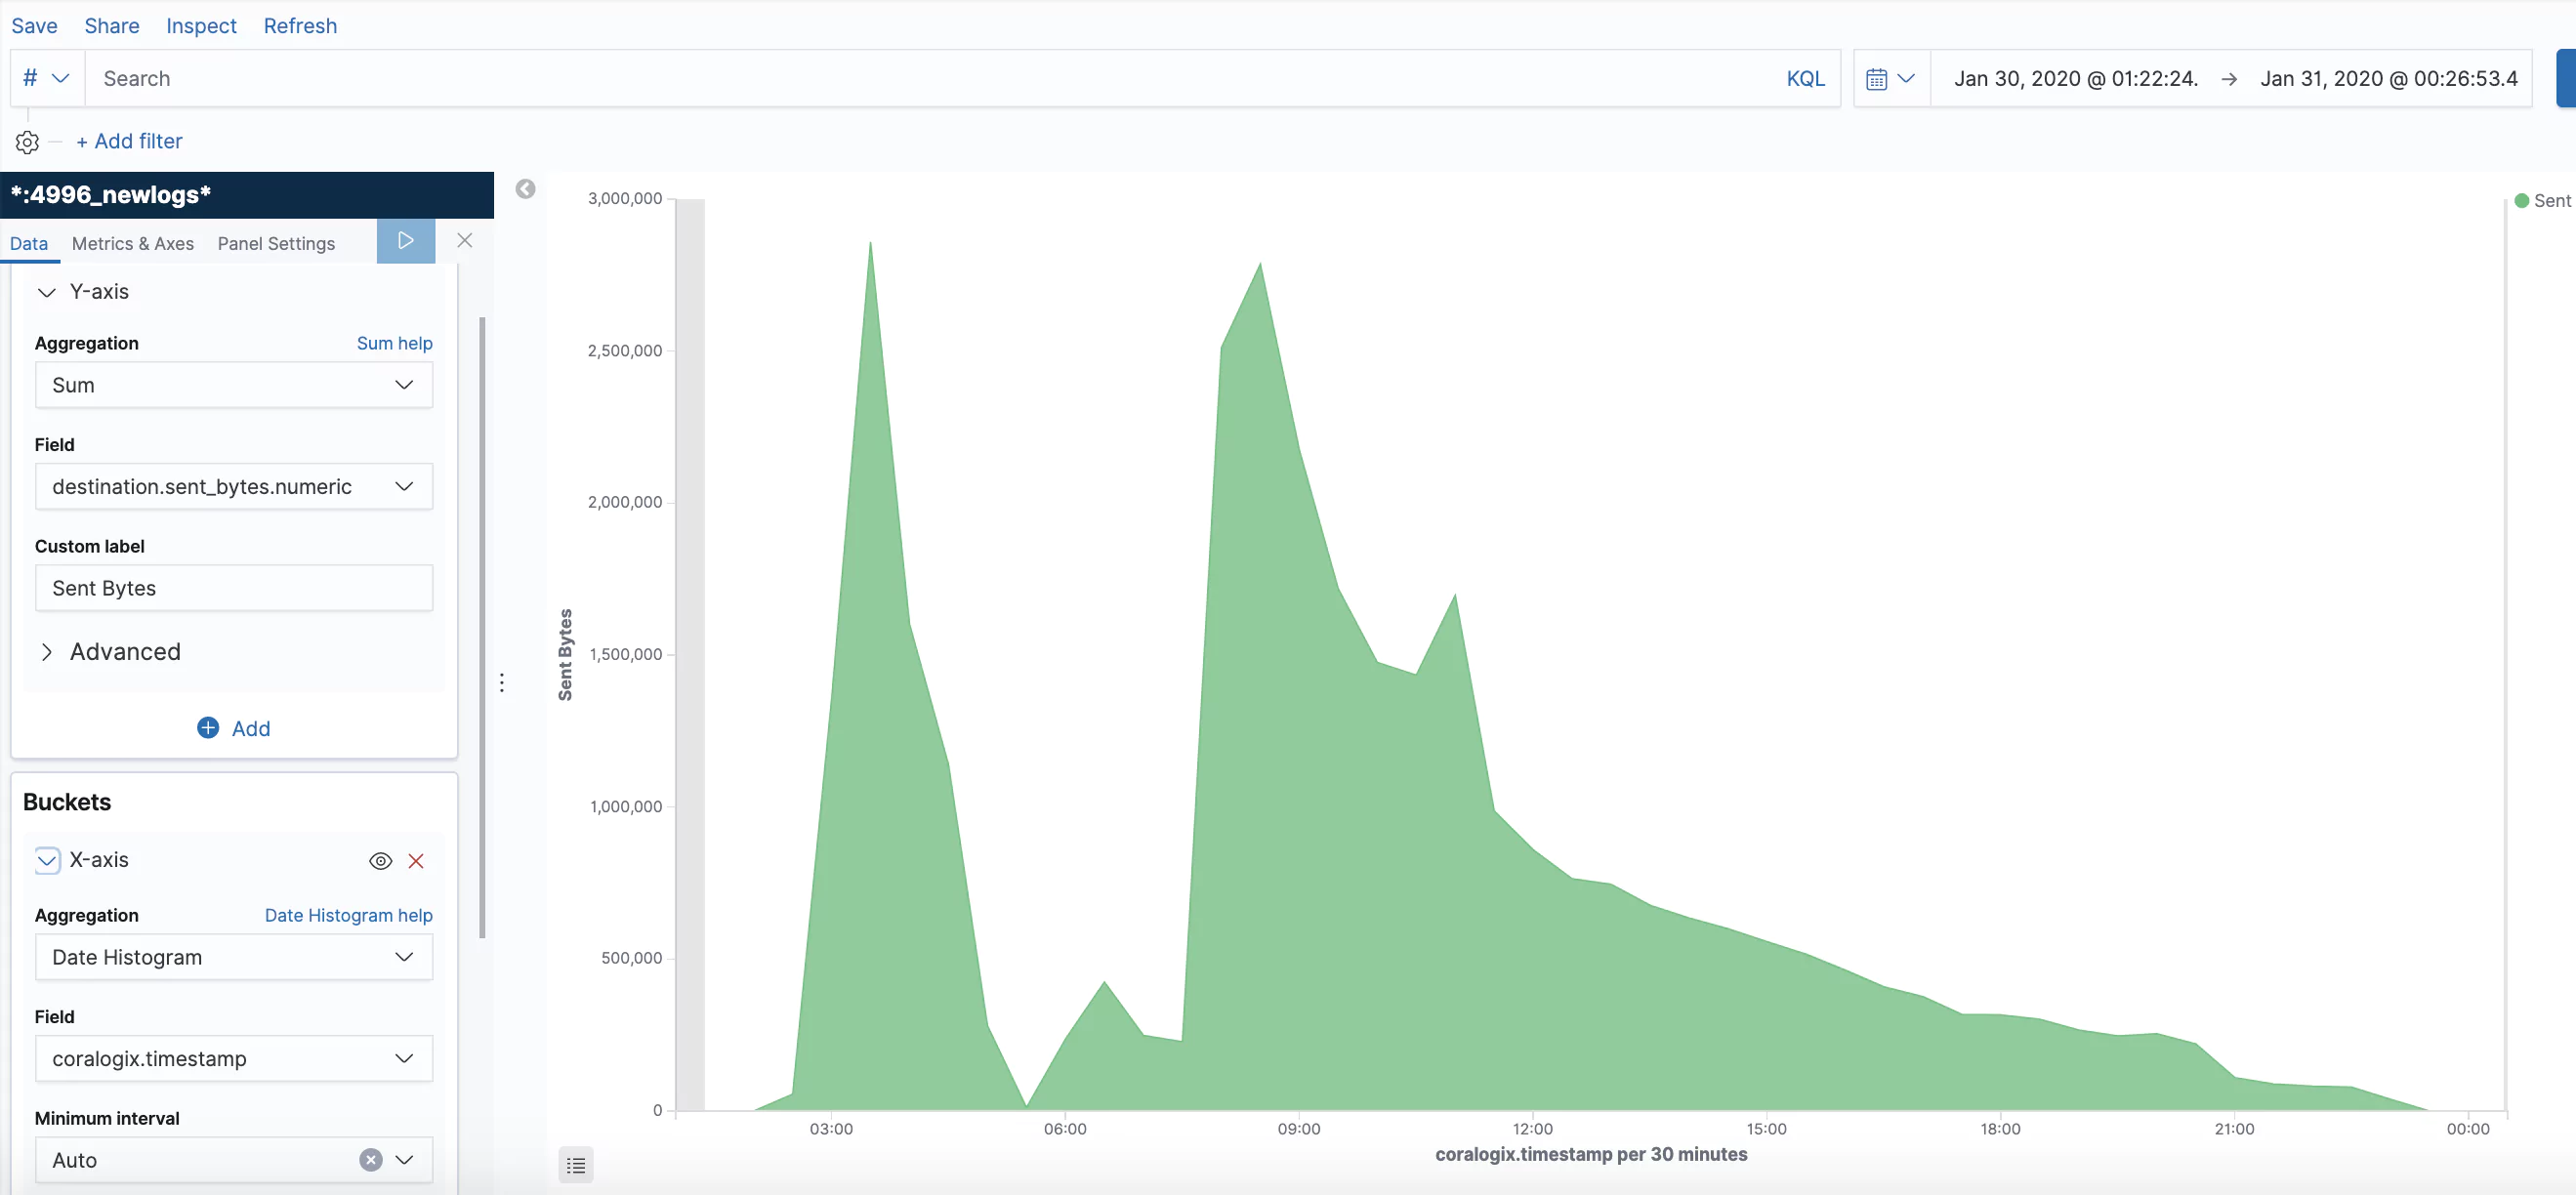
Bytes Sent
Summation of the number of bytes sent.
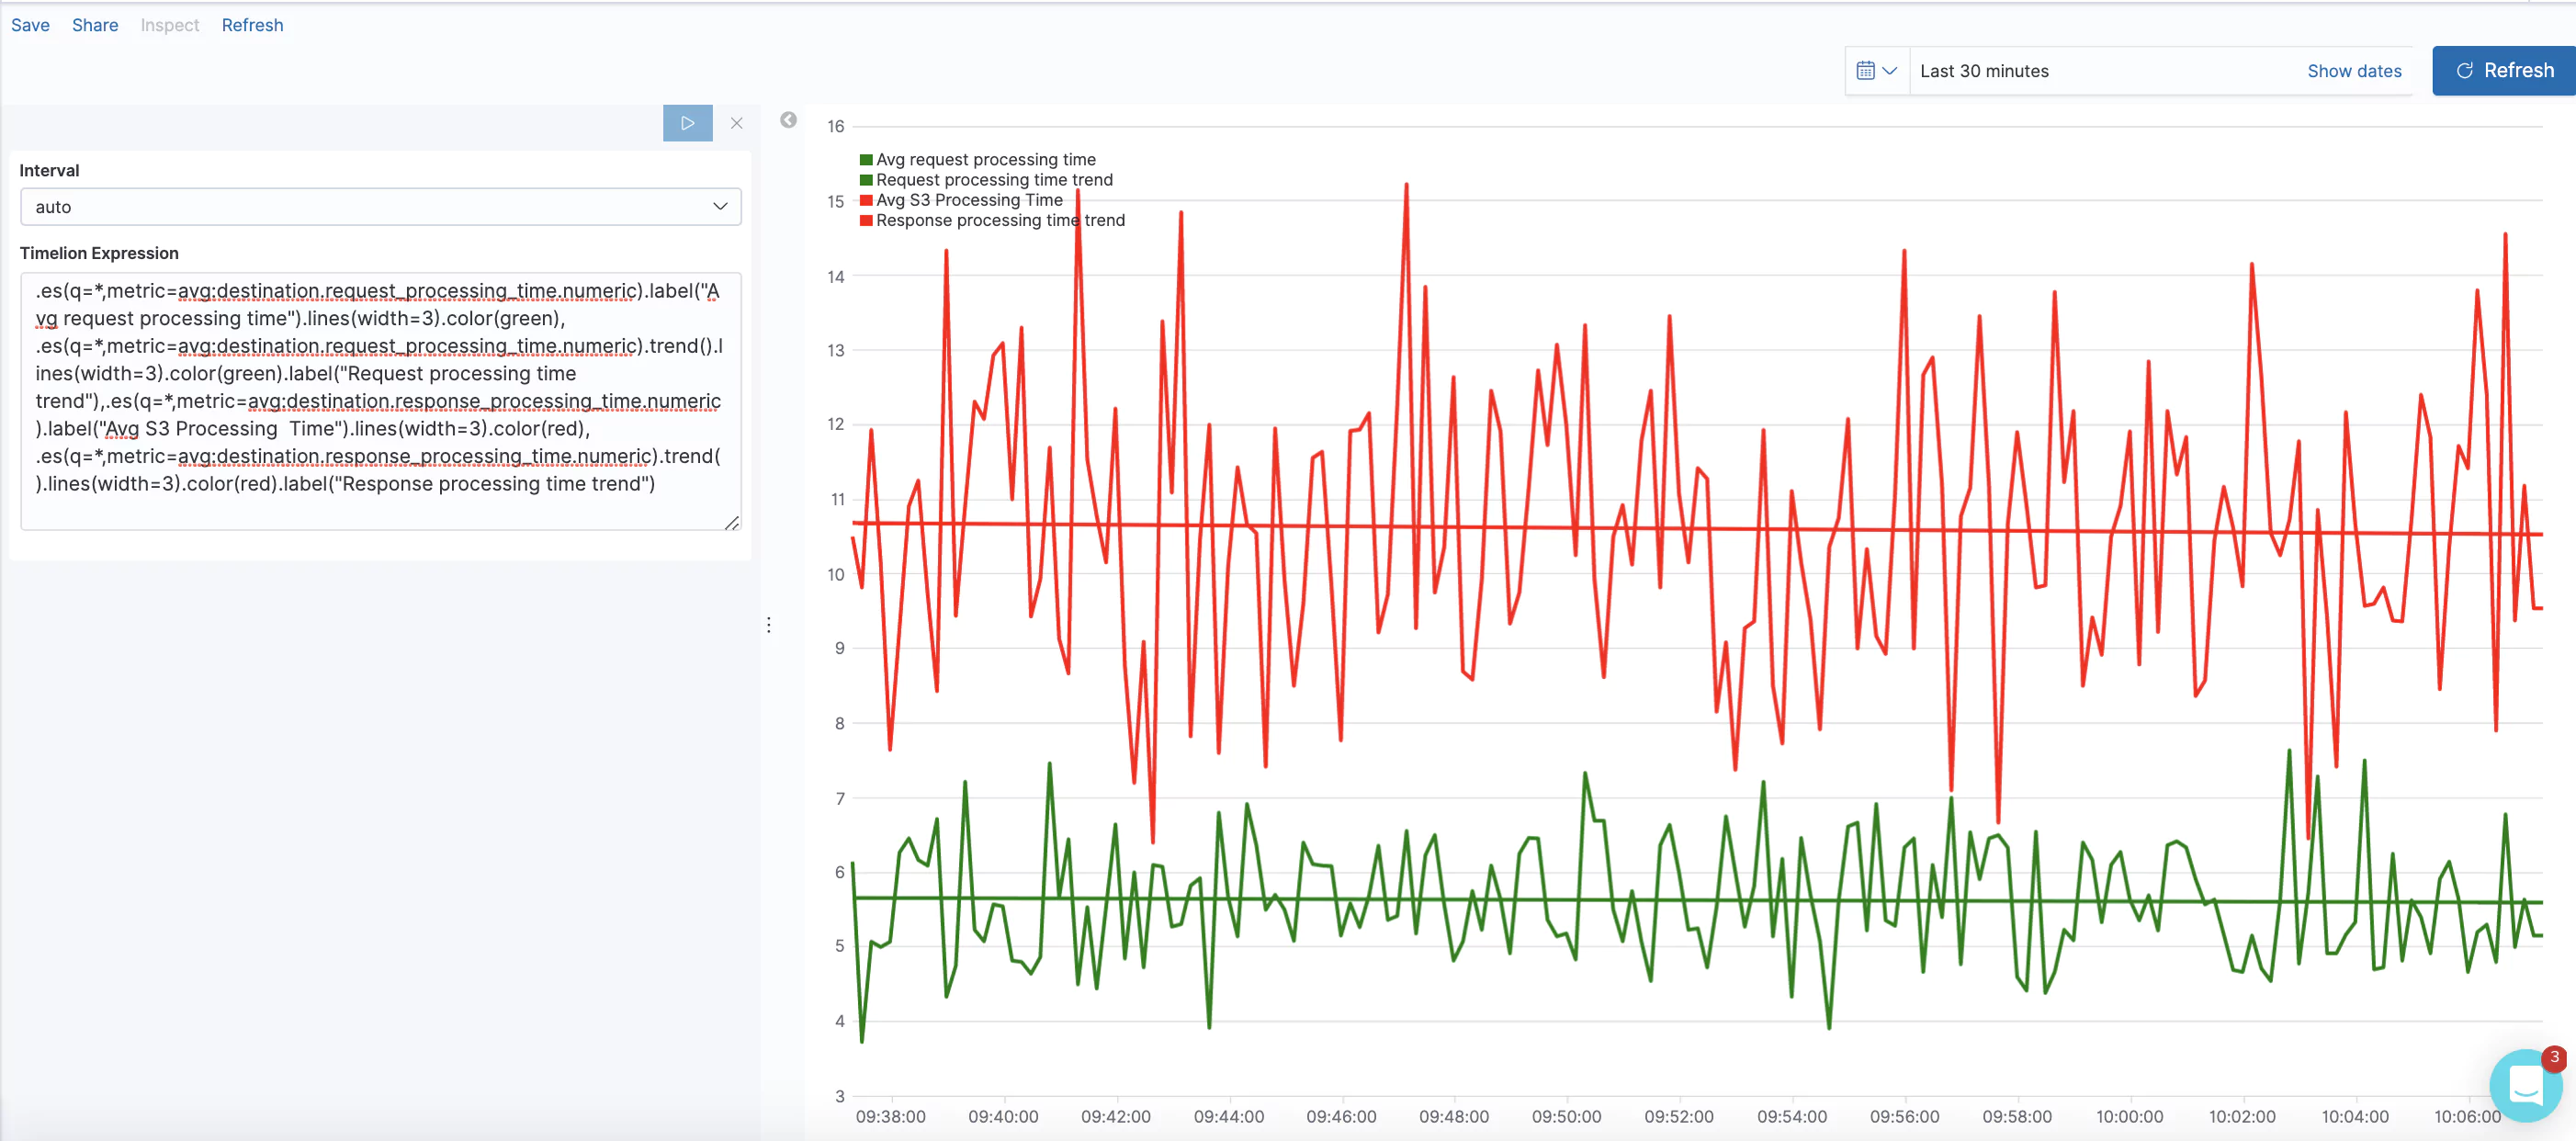
Average Request/Response Processing Time
Request processing time is the total time elapsed from the time the load balancer received the request until the time it sent it to a target. Response processing time is the total time elapsed from the time the load balancer received the response header from the target until it started to send the response to the client. In this visualization, we are using Timelion to track the average over time and generate a trend line.
Timelion expression:
.es(q=*,metric=avg:destination.request_processing_time.numeric).label("Avg request processing time").lines(width=3).color(green), .es(q=*,metric=avg:destination.request_processing_time.numeric).trend().lines(width=3).color(green).label("Avg request processing time trend"),.es(q=*,metric=avg:destination.response_processing_time.numeric).label("Avg response processing Time").lines(width=3).color(red), .es(q=*,metric=avg:destination.response_processing_time.numeric).trend().lines(width=3).color(red).label("Avg response processing time trend")
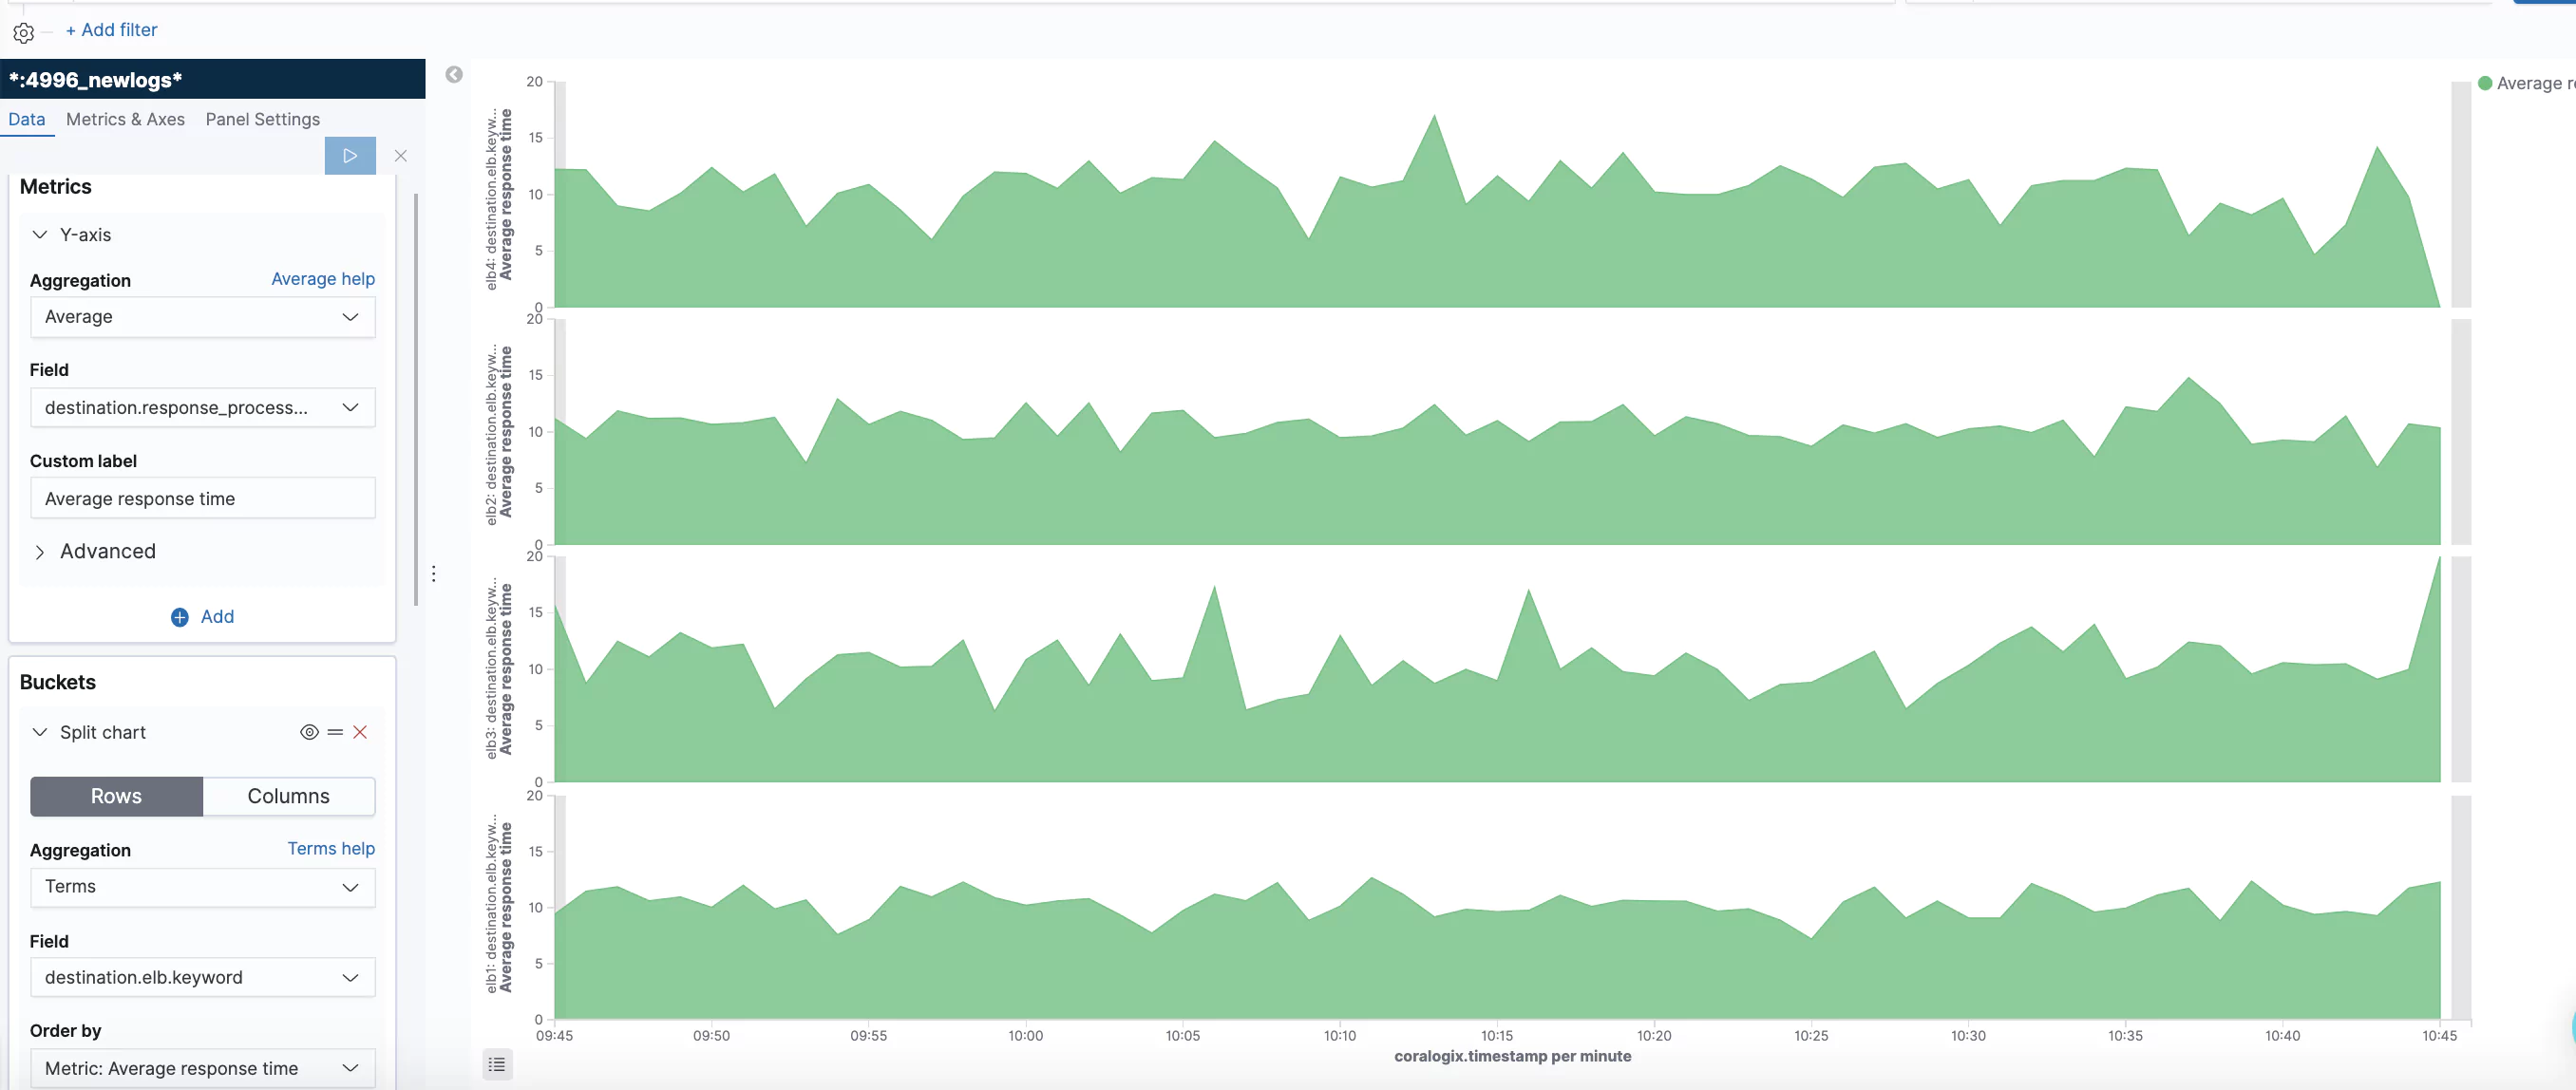
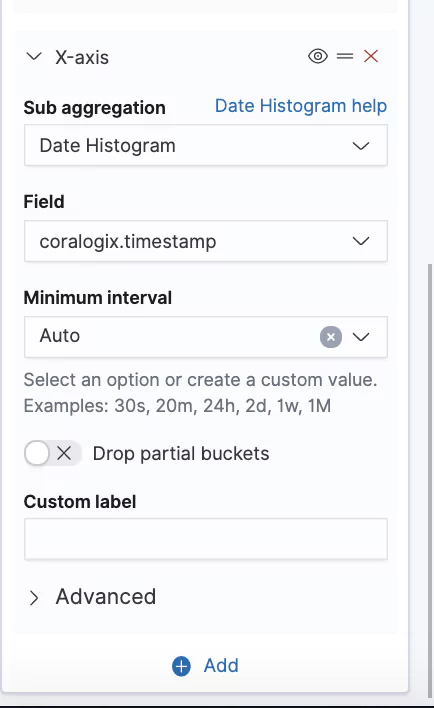
Average Response Processing Time by ELB
In this visualization, we show the average response processing time by ELB. We used the horizontal option. See the definition screens.
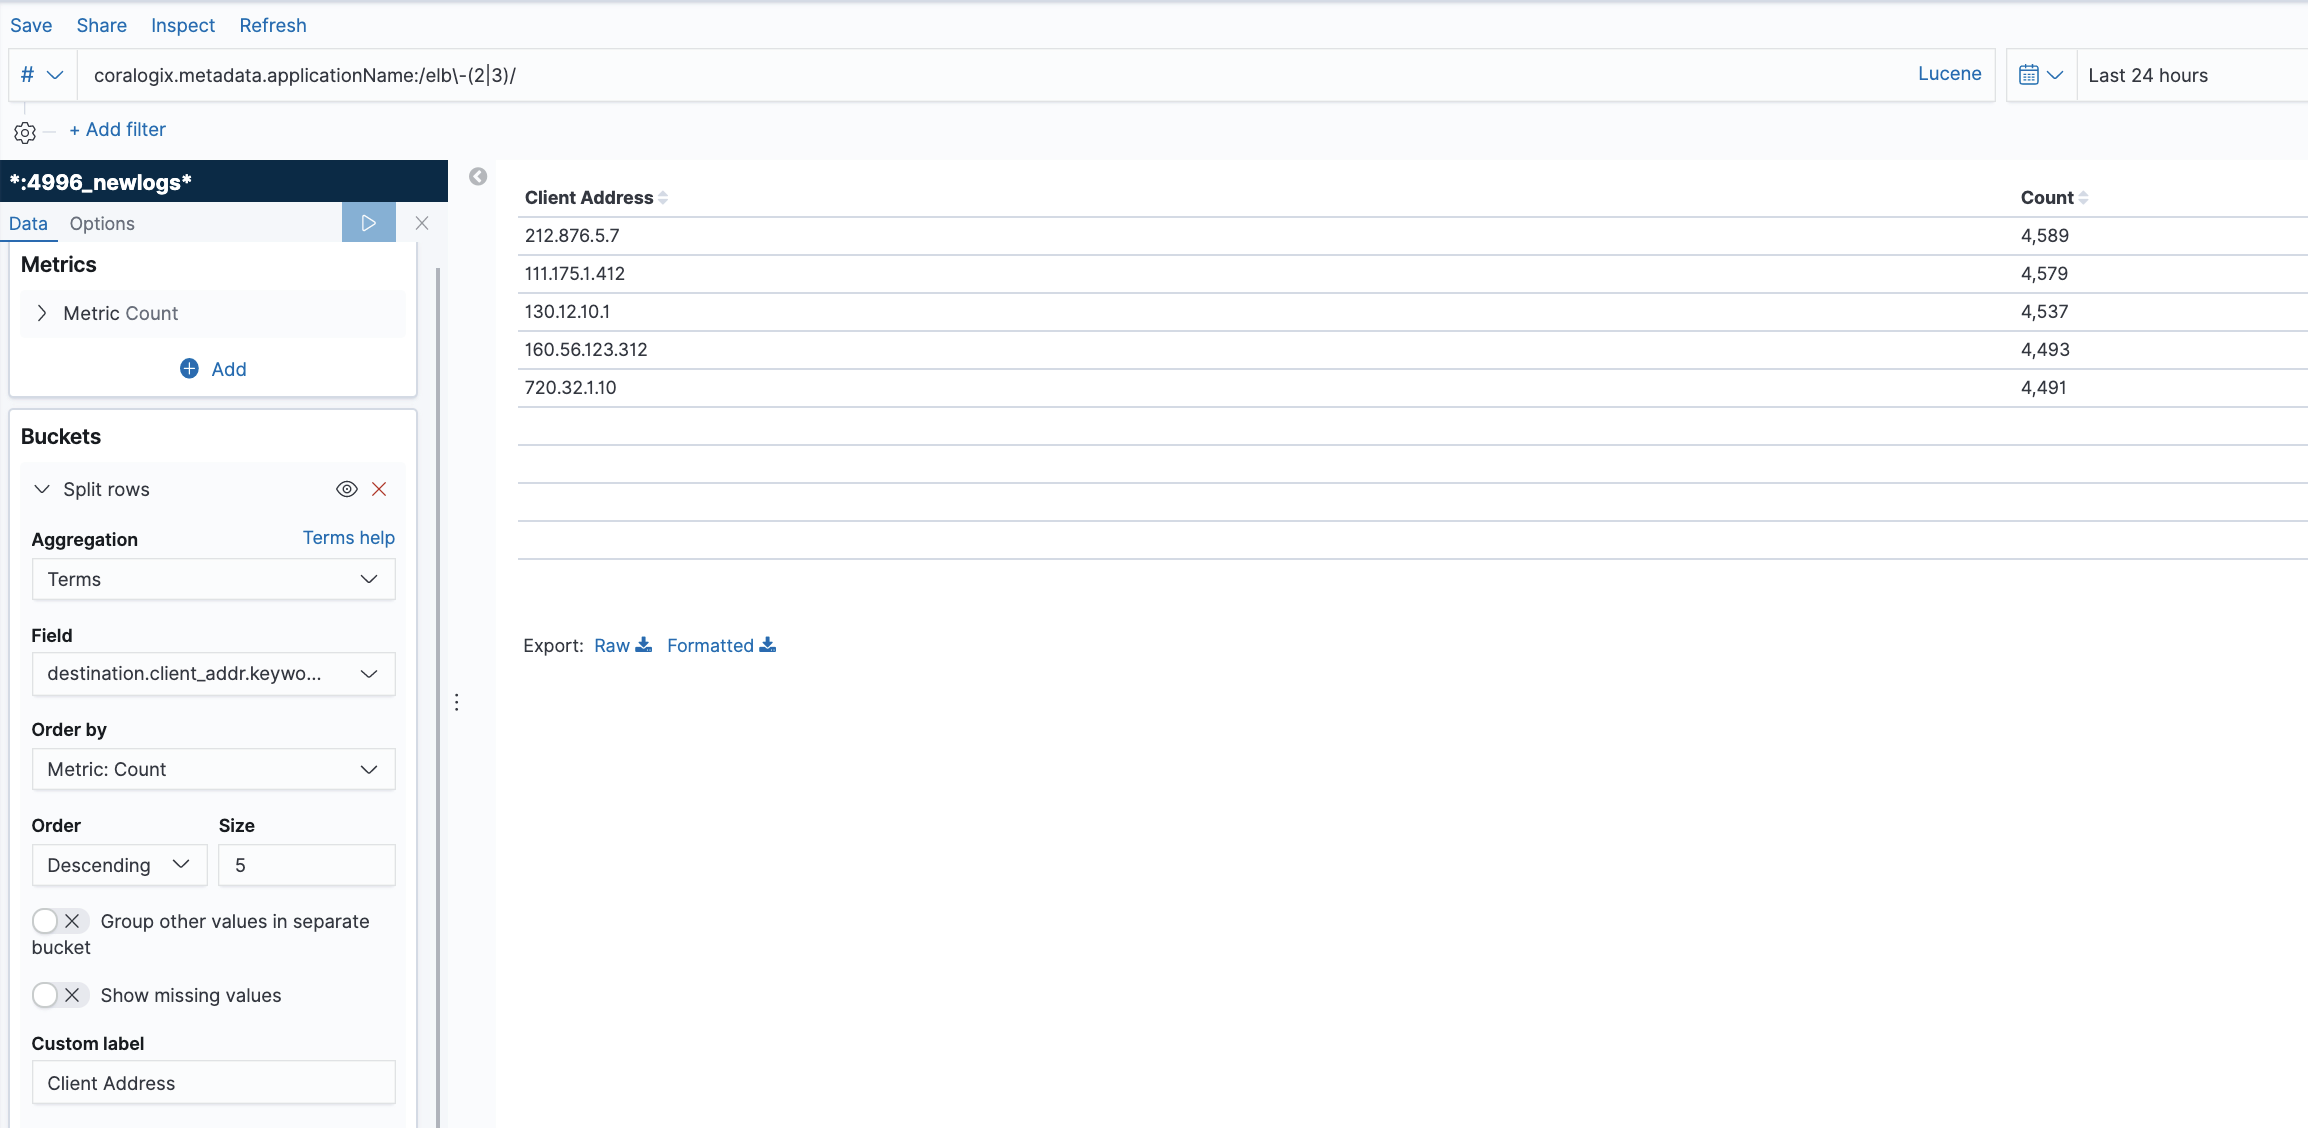
Top Client Requesters for a specific ELB
This table lists the top IP addresses generating requests to specific ELB’s. The ELB’s are separated by the metadata applicationName. This metadata field is assigned to the load balancer when you configure the integration. We created a Kibana filter that looks only at these two devices. You can read about filtering and querying in our tutorial.
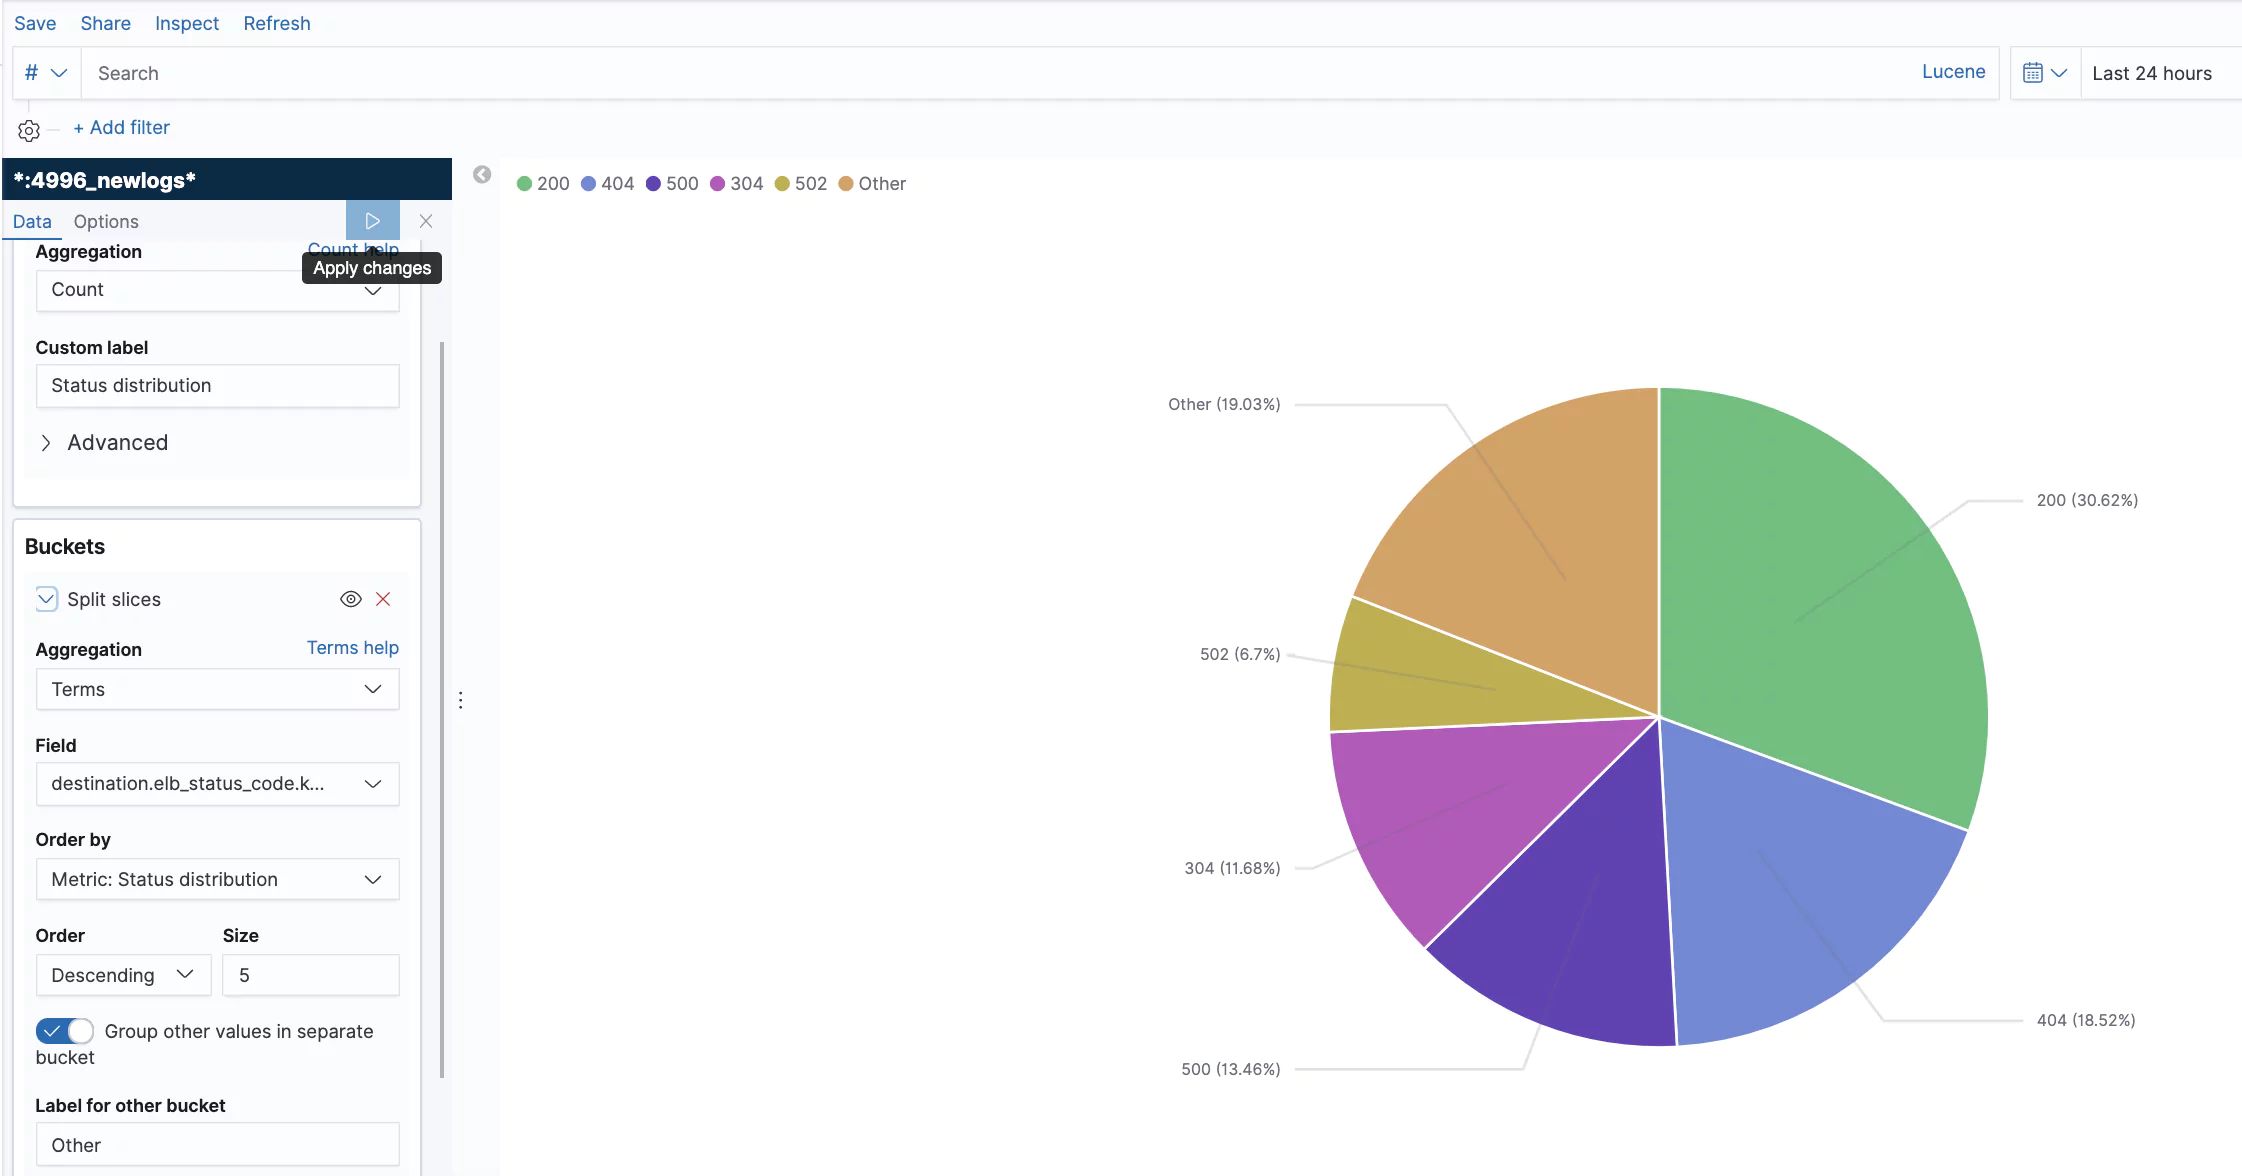
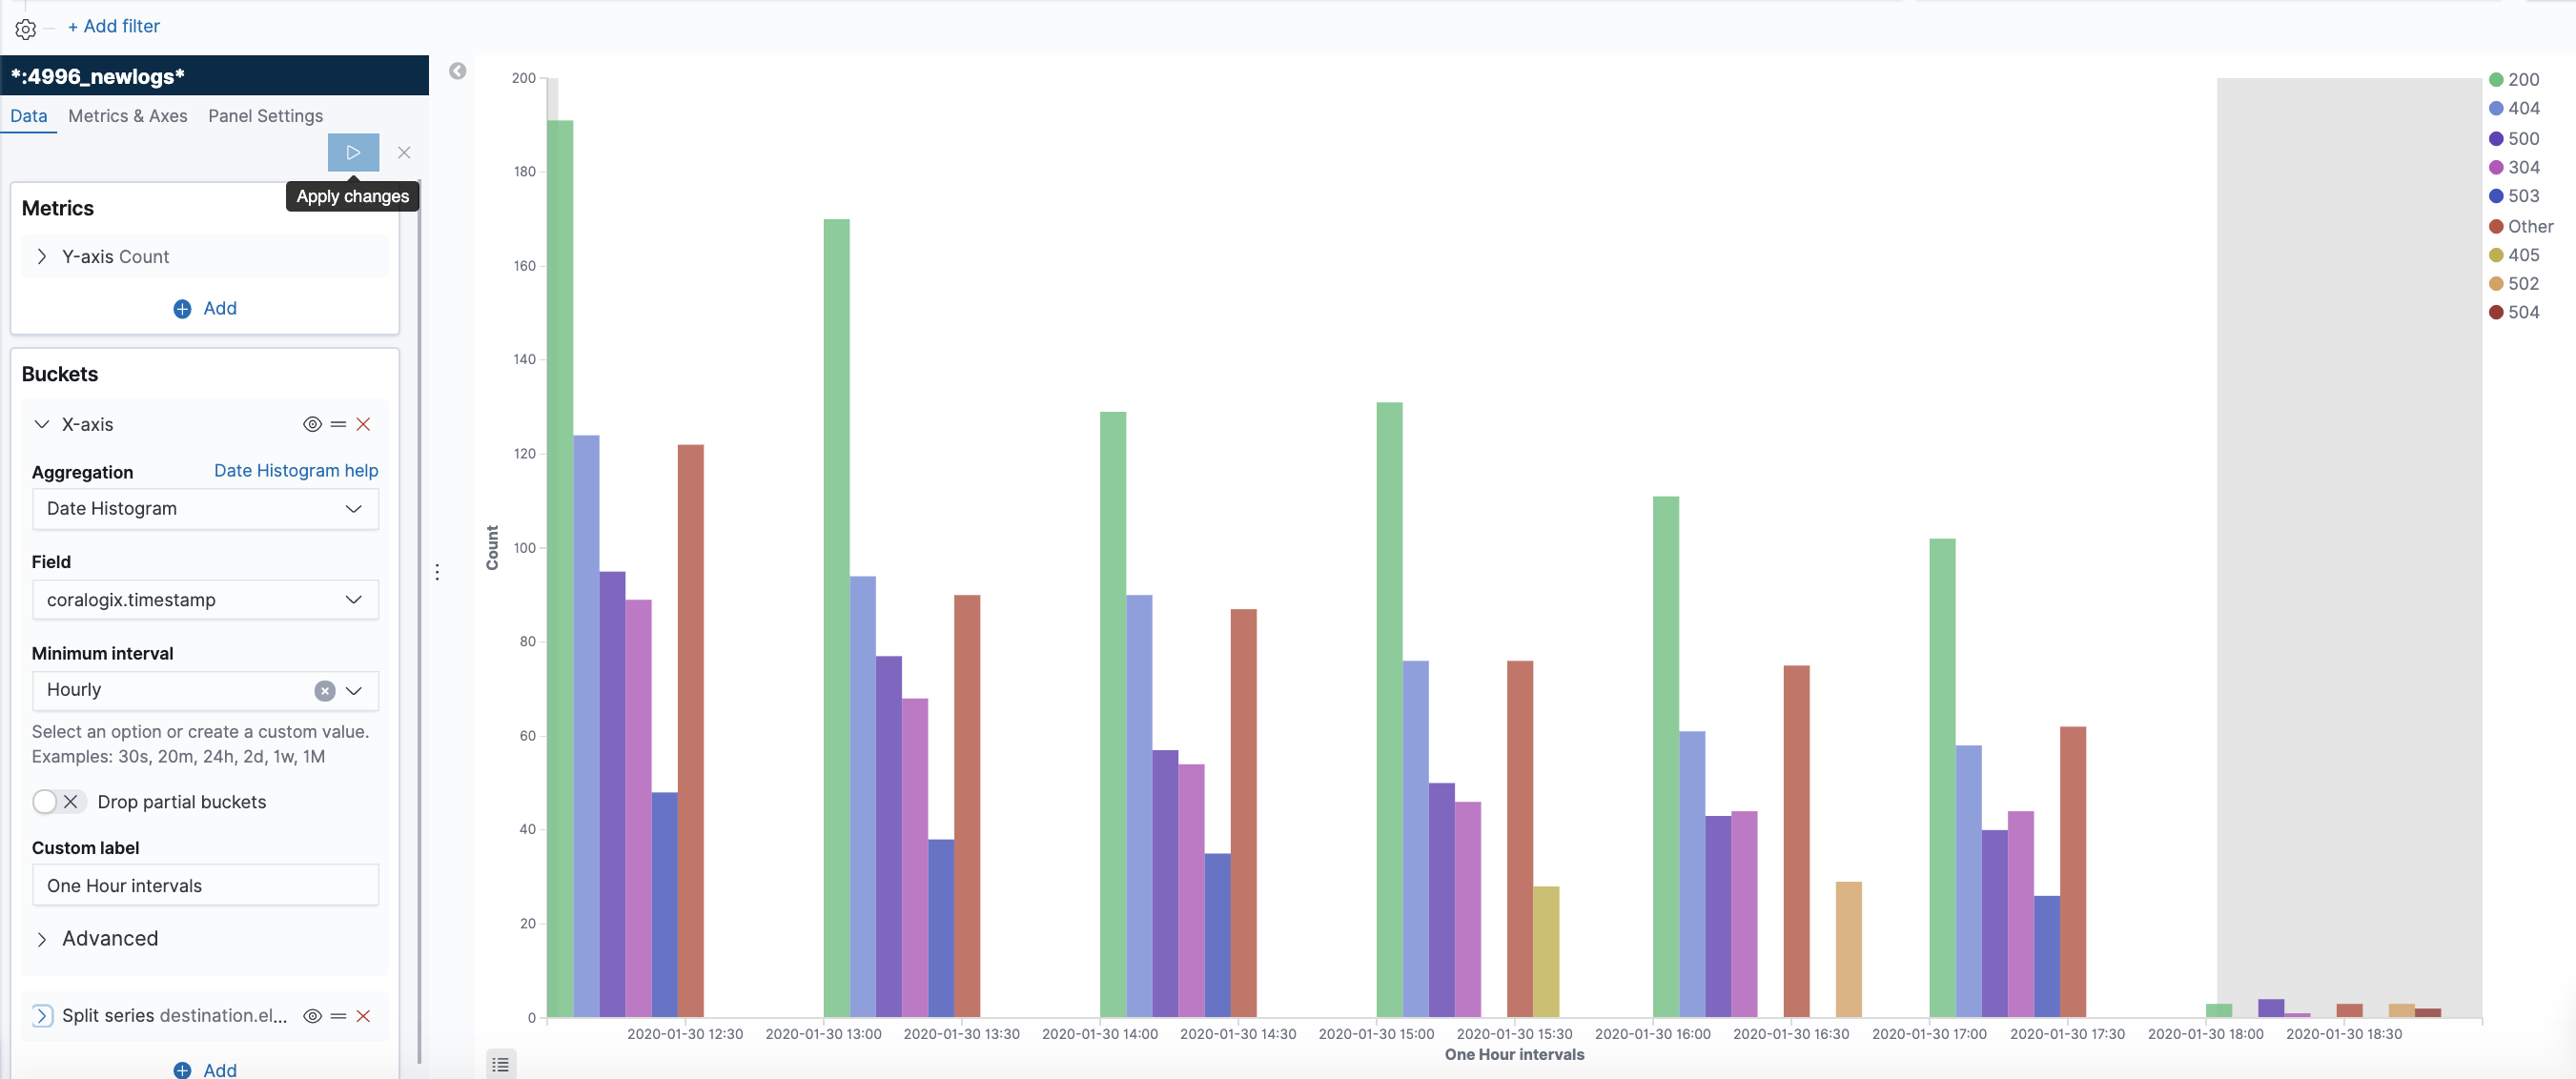
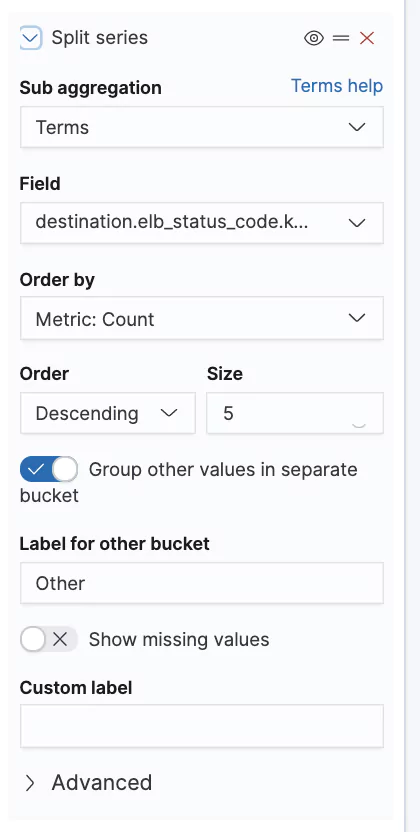
ELB Status Codes
This is an example showing the status code distribution for the last 24 hours.
You can also create a more dynamic representation showing how the distribution behaves over time.
This blog post covered the different types of services that AWS provides under the ELB umbrella, NLB, ALB, and CLB. We focused on the logs these services generate and their structure, and showed some examples of alerts and visualizations that can help you unlock the value of these logs. Remember that every user is unique and has its own use case and data. Your logs might be customized and configured differently and you will most likely have your own requirements. So, you are encouraged to take the methods and concepts showed here and adapt them to your own needs. If you need help or have any questions, don’t hesitate and reach out to [email protected]. You can learn more about unlocking the value embedded in AWS ALB logs and other logs in some of our other blog posts.
Be Our Partner
Complete this form to speak with one of our partner managers.
Thank You
Someone from our team will reach out shortly. Talk to you soon!
 The new standard of observability is here. Discover Olly, the industry’s first