The new standard of observability is here. Discover Olly, the industry’s first

What is Filebeat?
Filebeat, an Elastic Beat that’s based on the libbeat framework from Elastic, is a lightweight shipper for forwarding and centralizing log data. Installed as an agent on your servers, Filebeat monitors the log files or locations that you specify, collects log events, and forwards them either to Elasticsearch for indexing or to Logstash for further processing.
Filebeat Installation
Filebeat installation instructions can be found at the Elastic website.
Here are Coralogix’s Filebeat installation instructions.
Coralogix also has a Filebeat with K8s option off-the-shelf.
Filebeat Configuration
To configure Filebeat, you edit the configuration file. For rpm and deb, you’ll find the configuration file at this location /etc/filebeat. There’s also a full example configuration file at /etc/filebeat/filebeat.reference.yml that shows all non-deprecated options. The Filebeat configuration file uses YAML for its syntax as it’s easier to read and write than other common data formats like XML or JSON. The syntax includes dictionaries, an unordered collection of name/value pairs, and also supports lists, numbers, strings, and many other data types. All members of the same list or dictionary must have the same indentation level. Lists and dictionaries can also be represented in abbreviated form, which is somewhat similar to JSON using {} for dictionaries and [] for lists. For more info on the config file format.
The Filebeat configuration file consists, mainly, of the following sections. For some more information on how to configure Filebeat.
- The Modules configuration section can help with the collection, parsing, and visualization of common log formats (optional).
- The Inputs section determines the input sources (mandatory as input if not using Module configuration).
- The Processors section is used to configure processing across data exported by Filebeat (optional). You can define a processor globally at the top-level in the configuration or under a specific input so the processor is applied to the data collected for that input.
- The Output section determines the output destination of the processed data.
There are other sections you may include in your YAML such as a Kibana endpoint, internal queue, etc. You may view them and their different options at the configuring Filebeat link. Each of the sections has different options and there are numerous modules to choose from and various input types, different outputs to use, etc…
In this post, I will go over the main sections you may use and focus on giving examples that worked for us here at Coralogix.
Modules
Filebeat modules simplify the collection, parsing, and visualization of common log formats. A module is composed of one or more file sets, each file set contains Filebeat input configurations, Elasticsearch Ingest Node pipeline definition, Fields definitions, and Sample Kibana dashboards (when available). See here for more information on Filebeat modules.
Inputs
If you are not using modules, you need to configure the Filebeat manually. You do so by specifying a list of input under the filebeat.inputs section of the filebeat.yml to tell Filebeat where to locate and how to process the input data. There are different types of inputs you may use with Filebeat, you can learn more about the different options in the Configure inputs doc. In the following example, I am using the Log input type with some common options:
#=========================== Filebeat inputs =============================

# List of inputs to fetch data.
filebeat.inputs:
#------------------------------ Log input --------------------------------
- type: log

  # Change to true to enable this input configuration.
  enabled: true

  # Paths that should be crawled and fetched. Glob based paths.
  # To fetch all ".log" files from a specific level of subdirectories /var/log/*/*.log can be used.
  # For each file found under this path, a harvester is started.
  # Make sure no file is defined twice as this can lead to unexpected behaviour.
  paths:
    - "/var/log/nginx/access*.log"
    #- c:programdataelasticsearchlogs*

  # Configure the file encoding for reading files with international characters following the W3C recommendation for HTML5 (https://www.w3.org/TR/encoding).
  # Some sample encodings:
  #   plain, utf-8, utf-16be-bom, utf-16be, utf-16le, big5, gb18030, gbk,
  #    hz-gb-2312, euc-kr, euc-jp, iso-2022-jp, shift-jis, ...
  encoding: plain

  # Include lines. A list of regular expressions to match. It exports the lines that are matching any regular expression from the list.
  # The include_lines is called before exclude_lines. By default, all the lines are exported.
  include_lines: ['^ERR', '^WARN']

  # Exclude lines. A list of regular expressions to match. It drops the lines that are matching any regular expression from the list.
  # The include_lines is called before exclude_lines. By default, no lines are dropped.
  exclude_lines: ['^DBG']

  # Exclude files. A list of regular expressions to match. Filebeat drops the files that are matching any regular expression from the list.
  # By default, no files are dropped.
  exclude_files: ['1.log
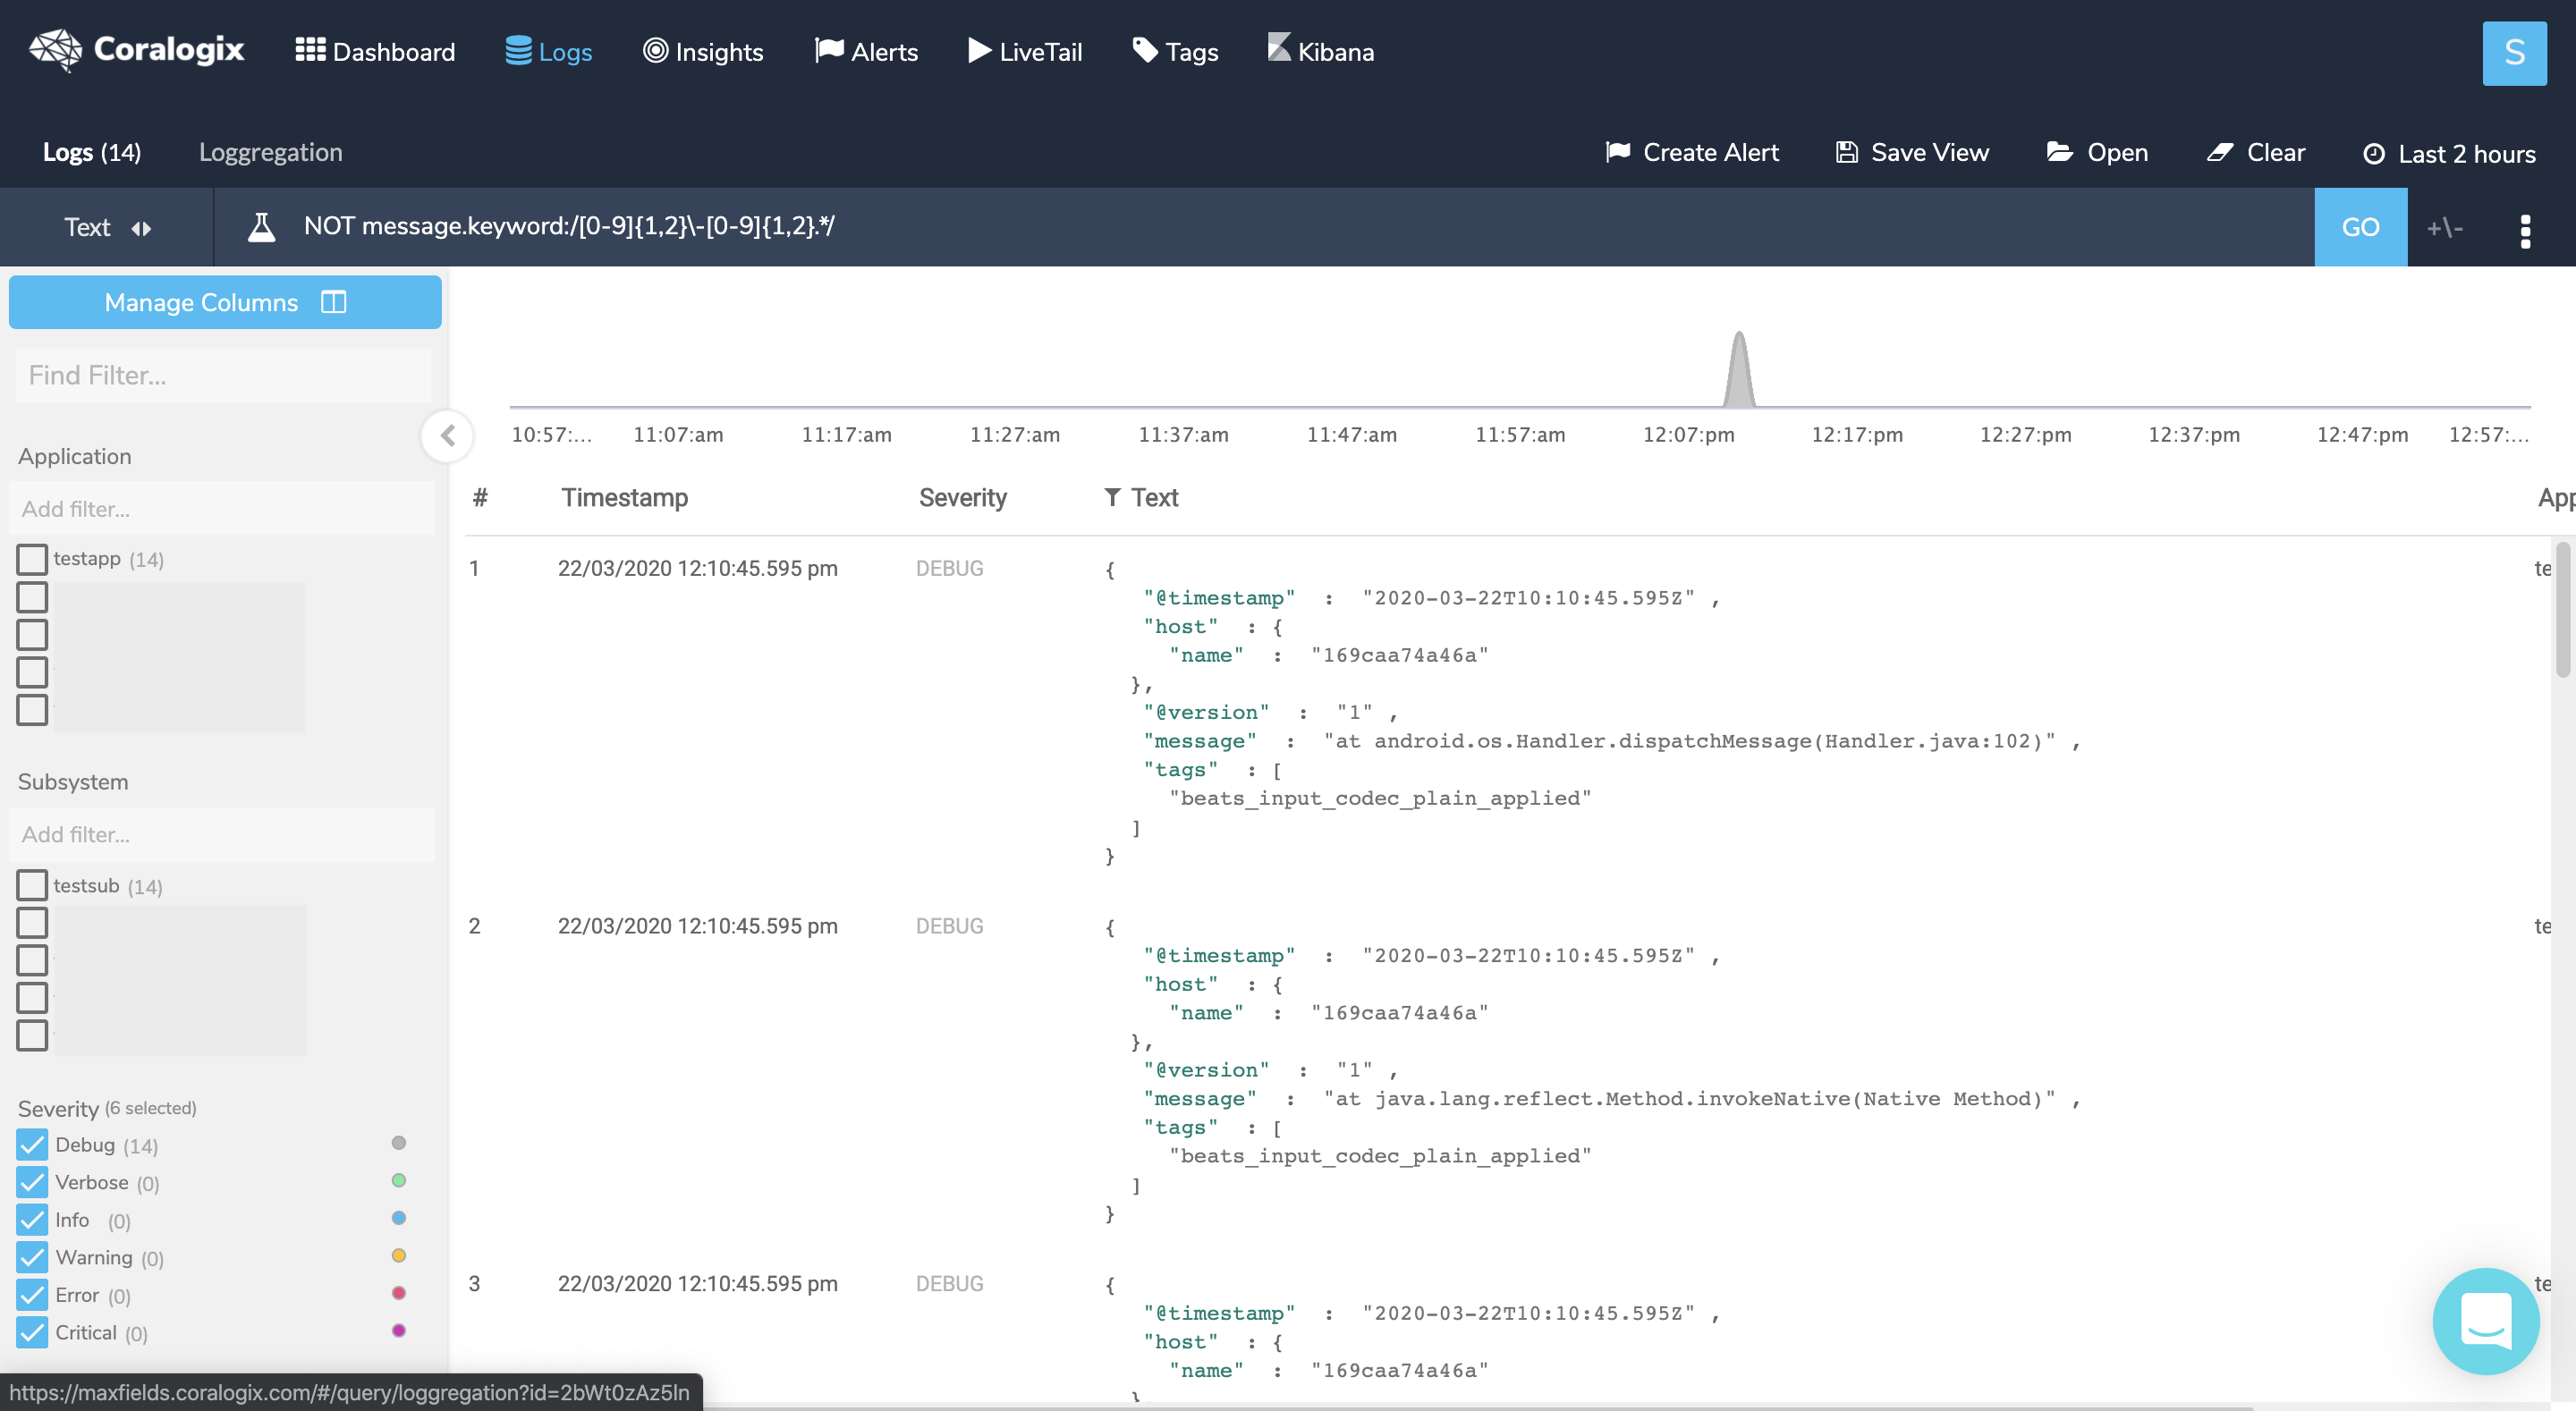
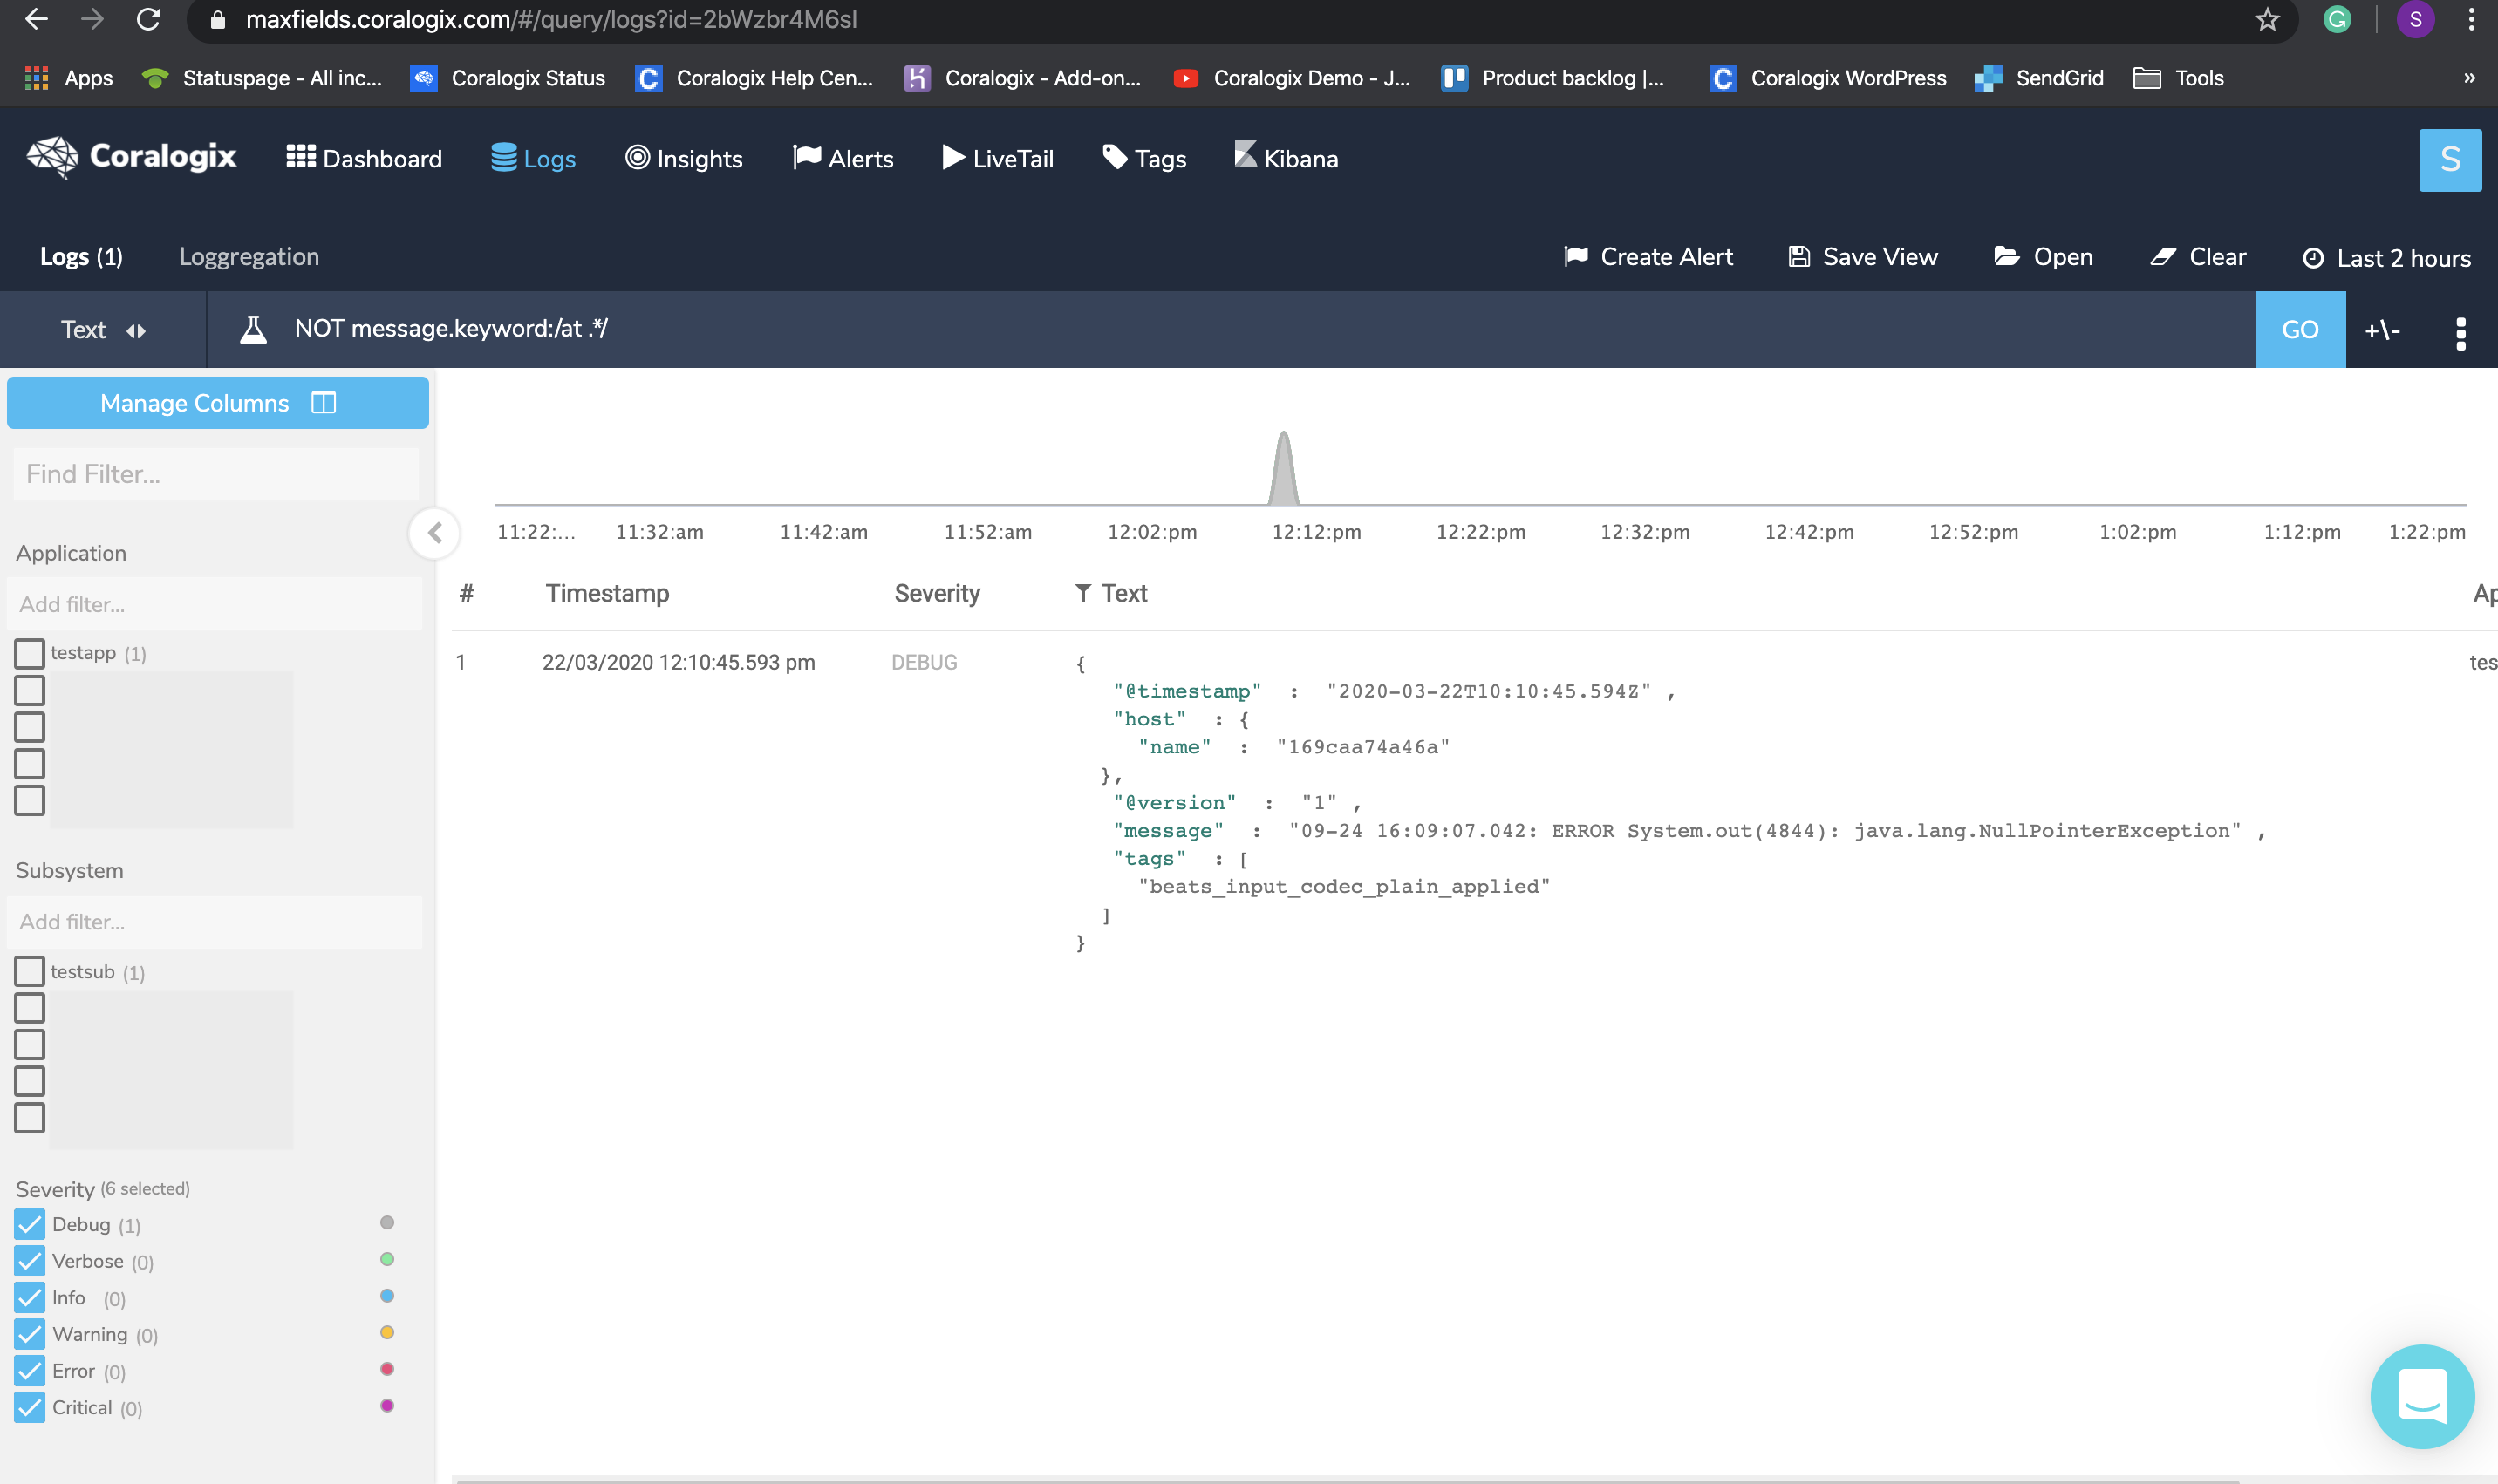
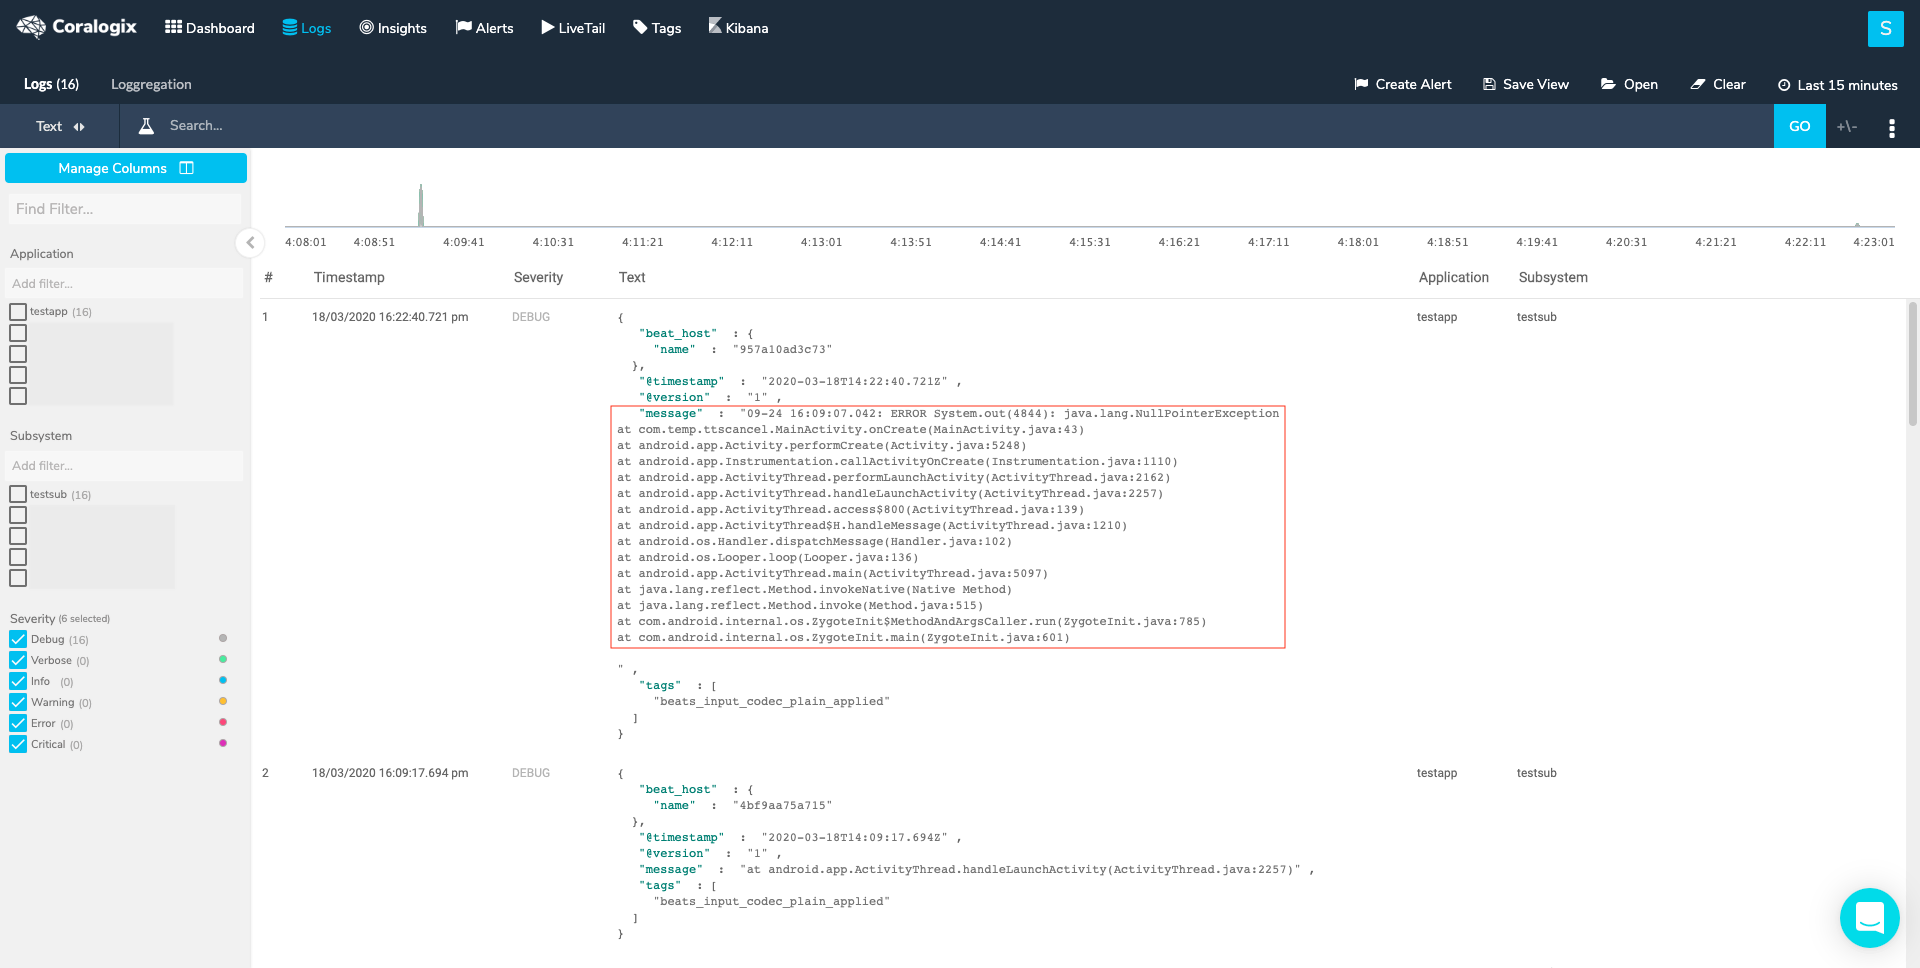
There are some more options to this input type as you can observe in the full example config file. You must state of course the path/s for your files and if you send your logs to Coralogix, field options must be used. Other than that the most common option is the Multiline option since it lets you merge log messages that span across lines (e.g. Java stack traces) according to your definition. Filebeat, by default, splits between these log lines in a file once it encounters n. You may include several "- type: log" sections in the input if you want to have different multiline patterns for different file sets or if you want to send your logs to Coralogix with several different application/subsystem names or even send to multiple Coralogix teams, all in the same YAML configuration.
Filebeat Processors
Filebeat processors are components used within Filebeat to enhance or manipulate the data being collected before it’s sent to the output destination, like Elasticsearch or Logstash. They allow for the modification of data at the edge, where Filebeat is running. Filebeat processors can perform a wide range of operations such as extracting fields, adding metadata, filtering out unwanted information, and handling multiline patterns. This makes them very useful for preprocessing log data, ensuring that only relevant, structured, and enriched data is forwarded, which simplifies downstream processing and analysis.
The libbeat library provides processors for reducing the number of exported fields, performing additional processing and decoding, etc… Each Filebeat processor receives an event, applies a defined action to the event, and returns the event. If you define a list of processors, they are executed in the order they are defined in the Filebeat configuration file. This is an example of several processors configured. For more information on filtering and enhancing your data.
# ================================= Processors =================================

# Processors are used to reduce the number of fields in the exported event or to
# enhance the event with external metadata. This section defines a list of
# processors that are applied one by one and the first one receives the initial
# event:
#
#   event -> filter1 -> event1 -> filter2 ->event2 ...
#
# The supported processors are drop_fields, drop_event, include_fields,
# decode_json_fields, and add_cloud_metadata.
#
# For example, you can use the following processors to keep the fields that
# contain CPU load percentages, but remove the fields that contain CPU ticks
# values:
#
processors:
  - include_fields:
      fields: ["cpu"]
  - drop_fields:
      fields: ["cpu.user", "cpu.system"]
#
# The following example drops the events that have the HTTP response code 200:
#
processors:
  - drop_event:
      when:
        equals:
          http.code: 200
#
# The following example renames the field a to b:
#
processors:
  - rename:
      fields:
        - from: "a"
          to: "b"
#
# The following example enriches each event with the machine's local time zone
# offset from UTC.
#
processors:
  - add_locale:
      format: offset
#
# The following example enriches each event with host metadata.
#
processors:
  - add_host_metadata: ~
#
# The following example decodes fields containing JSON strings
# and replaces the strings with valid JSON objects.
#
processors:
  - decode_json_fields:
      fields: ["field1", "field2", ...]
      process_array: false
      max_depth: 1
      target: ""
      overwrite_keys: false
#
# The following example copies the value of message to message_copied
#
processors:
  - copy_fields:
      fields:
        - from: message
          to: message_copied
      fail_on_error: true
      ignore_missing: false
#
# The following example preserves the raw message under event_original, which then cutted at 1024 bytes
#
processors:
  - copy_fields:
      fields:
        - from: message
          to: event_original
      fail_on_error: false
      ignore_missing: true
  - truncate_fields:
      fields:
        - event_original
      max_bytes: 1024
      fail_on_error: false
      ignore_missing: true
#
# The following example URL-decodes the value of field1 to field2
#
processors:
  - urldecode:
      fields:
        - from: "field1"
          to: "field2"
      ignore_missing: false
      fail_on_error: true
#
# The following example is a great method to enable sampling in Filebeat, using Script processor
#
processors:
  - script:
      lang: javascript
      id: my_filter
      source: >
        function process(event) {
            if (Math.floor(Math.random() * 100) < 50) {
              event.Cancel();
            }
        }
Filebeat offers more types of processors as you can see here and you may also include conditions in your processor definition. If you use Coralogix, you have an alternative to Filebeat Processors, to some extent, as you can set different kinds of parsing rules through the Coralogix UI instead. If you are maintaining your own ELK stack or other 3rd party logging tool you should check for processors when you have any need for parsing.
Output
You configure Filebeat to write to a specific output by setting options in the Outputs section of the filebeat.yml config file. Only a single output may be defined. In this example, I am using the Logstash output. This is the required option if you wish to send your logs to your Coralogix account, using Filebeat. For more output options.
# ------------------------------ Logstash Output -------------------------------
output.logstash:
  # Boolean flag to enable or disable the output module.
  enabled: true

  # The Logstash hosts
  hosts: ["localhost:5044"]

  # Configure escaping HTML symbols in strings.
  escape_html: true

  # Number of workers per Logstash host.
  worker: 1

  # Optionally load-balance events between Logstash hosts. Default is false.
  loadbalance: false

  # The maximum number of seconds to wait before attempting to connect to
  # Logstash after a network error. The default is 60s.
  backoff.max: 60s

  # Optional index name. The default index name is set to filebeat
  # in all lowercase.
  index: 'filebeat'

  # The number of times to retry publishing an event after a publishing failure.
  # After the specified number of retries, the events are typically dropped.
  # Some Beats, such as Filebeat and Winlogbeat, ignore the max_retries setting
  # and retry until all events are published.  Set max_retries to a value less
  # than 0 to retry until all events are published. The default is 3.
  max_retries: 3

  # The maximum number of events to bulk in a single Logstash request. The
  # default is 2048.
  bulk_max_size: 2048

  # The number of seconds to wait for responses from the Logstash server before
  # timing out. The default is 30s.
  timeout: 30s
This example only shows some of the configuration options for the Logstash output, there are more. It’s important to note that when using Coralogix, you specify the following Logstash host: logstashserver.coralogixstg.wpengine.com:5044 under hosts and that some other options are redundant, such as index name, as it is auto-defined by us.
At this point, we have enough Filebeat knowledge to start exploring some actual configuration files. They are commented and you can use them as references to get additional information about different plugins and parameters or to learn more about Filebeat.
Filebeat Configuration Examples
Example 1
This example uses a simple log input, forwarding only errors and critical log lines to Coralogix’s Logstash server (output). The Chosen application name is “prd” and the subsystem is “app”, you may later filter logs based on these metadata fields. You may add any other custom fields to your logs in order to have more filter options.
# ============================== Filebeat Inputs ===============================

filebeat.inputs:
# Use the log input to read lines from log files
- type: log
  # Path of files
  paths:
  - "/var/log/application.log"
  # Include lines. A list of regular expressions to match. It exports the lines that are
  # matching any regular expression from the list. The include_lines is called before
  # exclude_lines. By default, all the lines are exported.
  include_lines: ['^CRITICAL', '^ERROR', '^ERR']
  # Generally, When set to true, the custom fields are stored as top-level fields in the output document instead of being grouped under a fields sub-dictionary.
  # In Coralogix it's a bit different, if you want to add custom fields then you must set fields under root true.
  # This will also add all metadata from fielbeat similar to the native use of this option.
  fields_under_root: true
  # These are the required fields for our integration with filebeat
  fields:
    PRIVATE_KEY: "xxxxxxxx-xxxx-xxxx-xxxx-xxxxxxxxxxxx"
    COMPANY_ID: xxxx
    APP_NAME: "prd"
    SUB_SYSTEM: "app"
    # Custom field
    filename: "application.log"

# ================================= Logstash output =================================

output.logstash:
  enabled: true
  # output to Coralogix Logstash server
  hosts: ["logstashserver.coralogixstg.wpengine.com:5044"]
Example 2
This example uses a log input, forwarding JSON log lines to Coralogix’s Logstash server (output), using Decode JSON options. The application name is determined by the value of one of the JSON log keys, this is done within the processors’ section.
# ============================== Filebeat Inputs ===============================

filebeat.inputs:
# Use the log input to read lines from log files
- type: log
  # Path of files
  paths:
  - "/var/log/filebeat/test.log"
  # These are the required fields for our integration with filebeat
  fields:
    PRIVATE_KEY: "xxxxxxxx-xxxx-xxxx-xxxx-xxxxxxxxxxxx"
    COMPANY_ID: xxxx
    APP_NAME: "test"
  # Generally, When set to true, the custom fields are stored as top-level fields in the output document instead of being grouped under a fields sub-dictionary. In Coralogix we are using it in a different way, if you want to add custom fields then you must set fields under root true. This will also add all metadata from fielbeat.
  fields_under_root: true
  # Decode JSON options. Enable this if your logs are structured in JSON.
  json:
    # JSON key on which to apply the line filtering and multiline settings. This key
    # must be top level and its value must be string, otherwise it is ignored. If
    # no text key is defined, the line filtering and multiline features cannot be used.
    message_key: "text"
    # By default, the decoded JSON is placed under a "json" key in the output document.
    # If you enable this setting, the keys are copied top level in the output document.
    keys_under_root: true
    # If keys_under_root and this setting are enabled, then the values from the decoded
    # JSON object overwrite the fields that Filebeat normally adds (type, source, offset, etc.)
    # in case of conflicts.
    overwrite_keys: true
    # If this setting is enabled, Filebeat adds a "error.message" and "error.key: json" key in case of JSON
    # unmarshaling errors or when a text key is defined in the configuration but cannot
    # be used.
    add_error_key: false

# ================================= Processors =================================

processors:
  # This processor will extract the value from a JSON key into Coralogix subsystem name
  - copy_fields:
      fields:
        - from: company
          to: SUB_SYSTEM
      fail_on_error: false
      ignore_missing: true

# ================================= Logstash output =================================

output.logstash:
  enabled: true
  # output to Coralogix Logstash server
  hosts: ["logstashserver.coralogixstg.wpengine.com:5044"]
Example 3
This example uses a log input, forwarding Ngnix access log lines, adding a custom “user” field with Coralogix as value, and a multiline pattern to make sure that multiline log lines (logs that span over few lines separated by n, similar to Java stack traces) will be merged into single log events. The processors’ section drops a few Filebeat metadata fields we are not interested in and the output is set to console so we will see our logs in the stdout.
# ============================== Filebeat Inputs ===============================

filebeat.inputs:
# Use the log input to read lines from log files
- type: log
  # Path of files
  paths:
  - "/var/log/filebeat/access.log"
  # Adding custom fields
  fields:
    user: "coralogix"
  # When set to true, the custom fields are stored as top-level fields in the output document instead of being grouped under a fields sub-dictionary.
  fields_under_root: true

  # Set multiline pattern - This form of multiline will append Consecutive lines that don’t match the pattern to the previous line that does match
  multiline:
    pattern: '^[0-9]{1,3}.[0-9]{1,3}.[0-9]{1,3}.[0-9]{1,3}'
    negate: true
    match: after

# ================================= Processors =================================

processors:
  - drop_fields:
      fields: ["input", "beat_host", "ecs", "agent", "tags", "offset"]
      ignore_missing: true

# ================================= Console output =================================

output.console:
  pretty: true
Example 4
This example uses a Redis slowlog input, forwarding entries from Redis slowlogs to Coralogix’s Logstash server (output) with a secured connection after downloading Coralogix’s SSL certificate.
# ============================== Filebeat Inputs ===============================

filebeat.inputs:
- type: redis
  # List of hosts to pool to retrieve the slow log information.
  hosts: ["localhost:6379"]
  # How often the input checks for redis slow log.
  scan_frequency: 10s
  # Redis AUTH password. Empty by default.
  password: "${redis_pwd}"
  # These are the required fields for our integration with filebeat
  fields:
    PRIVATE_KEY: "xxxxxxxx-xxxx-xxxx-xxxx-xxxxxxxxxxxx"
    COMPANY_ID: xxxx
    APP_NAME: "filebeat"
    SUB_SYSTEM: "redis"
  # Generally, When set to true, the custom fields are stored as top-level fields in the output document instead of being grouped under a fields sub-dictionary. In Coralogix we are using it in a different way, if you want to add custom fields then you must set fields under root true. This will also add all metadata from fielbeat.
  fields_under_root: true

# ================================= Logstash output =================================

output.logstash:
  enabled: true
  # output to Coralogix Logstash server
  # If you want to use an encrypted connection, you need to add our certificates as described in our filebeat tutorial
  hosts: ["logstashserver.coralogixstg.wpengine.com:5015"]
  tls.certificate_authorities: ["<path to folder with certificates>/ca.crt"]
  ssl.certificate_authorities: ["<path to folder with certificates>/ca.crt"]
] # Optional additional fields. These fields can be freely picked to add additional information to the crawled log files for filtering # These 4 fields, in particular, are required for Coralogix integration with filebeat to work. fields: PRIVATE_KEY: "xxxxxxxx-xxxx-xxxx-xxxx-xxxxxxxxxxxx" COMPANY_ID: XXXX APP_NAME: "ngnix" SUB_SYSTEM: "ngnix" #level: info #site: 1 # Set to true to store the additional fields as top level fields instead # of under the "fields" sub-dictionary. In case of name conflicts with the # fields added by Filebeat itself, the custom fields overwrite the default # fields. # In Coralogix we are using it in a different way, if you want to add custom fields then you must set fields under root true. This will also add all metadata from filebeat. fields_under_root: true ### JSON configuration # Decode JSON options. Enable this if your logs are structured in JSON. # JSON key on which to apply the line filtering and multiline settings. This key # must be top level and its value must be string, otherwise it is ignored. If # no text key is defined, the line filtering and multiline features cannot be used. json.message_key: "message" # By default, the decoded JSON is placed under a "json" key in the output document. # If you enable this setting, the keys are copied top level in the output document. json.keys_under_root: true # If keys_under_root and this setting are enabled, then the values from the decoded # JSON object overwrite the fields that Filebeat normally adds (type, source, offset, etc.) # in case of conflicts. json.overwrite_keys: true # If this setting is enabled, Filebeat adds a "error.message" and "error.key: json" key in case of JSON # unmarshaling errors or when a text key is defined in the configuration but cannot # be used. json.add_error_key: false ### Multiline options # Multiline can be used for log messages spanning multiple lines. This is common # for Java Stack Traces or C-Line Continuation multiline: # The regexp Pattern that has to be matched. pattern: '^[0-9]{1,3}.[0-9]{1,3}.[0-9]{1,3}.[0-9]{1,3}' # Defines if the pattern set under pattern should be negated or not. Default is false. negate: true # Match can be set to "after" or "before". It is used to define if lines should be append to a pattern # that was (not) matched before or after or as long as a pattern is not matched based on negate. # Note: After is the equivalent to previous and before is the equivalent to to next in Logstash match: after # The maximum number of lines that are combined to one event. # In case there are more the max_lines the additional lines are discarded. # Default is 500 max_lines: 500 # After the defined timeout, an multiline event is sent even if no new pattern was found to start a new event # Default is 5s. timeout: 5s
There are some more options to this input type as you can observe in the full example config file. You must state of course the path/s for your files and if you send your logs to Coralogix, field options must be used. Other than that the most common option is the Multiline option since it lets you merge log messages that span across lines (e.g. Java stack traces) according to your definition. Filebeat, by default, splits between these log lines in a file once it encounters n. You may include several "- type: log" sections in the input if you want to have different multiline patterns for different file sets or if you want to send your logs to Coralogix with several different application/subsystem names or even send to multiple Coralogix teams, all in the same YAML configuration.
Processors
You can use Processors in order to process events before they are sent to the configured output. The libbeat library provides processors for reducing the number of exported fields, performing additional processing and decoding, etc… Each processor receives an event, applies a defined action to the event, and returns the event. If you define a list of processors, they are executed in the order they are defined in the Filebeat configuration file. This is an example of several processors configured. For more information on filtering and enhancing your data.
Filebeat offers more types of processors as you can see here and you may also include conditions in your processor definition. If you use Coralogix, you have an alternative to Filebeat Processors, to some extent, as you can set different kinds of parsing rules through the Coralogix UI instead. If you are maintaining your own ELK stack or other 3rd party logging tool you should check for processors when you have any need for parsing.
Output
You configure Filebeat to write to a specific output by setting options in the Outputs section of the filebeat.yml config file. Only a single output may be defined. In this example, I am using the Logstash output. This is the required option if you wish to send your logs to your Coralogix account, using Filebeat. For more output options.
This example only shows some of the configuration options for the Logstash output, there are more. It’s important to note that when using Coralogix, you specify the following Logstash host: logstashserver.coralogixstg.wpengine.com:5044 under hosts and that some other options are redundant, such as index name, as it is auto-defined by us.
At this point, we have enough Filebeat knowledge to start exploring some actual configuration files. They are commented and you can use them as references to get additional information about different plugins and parameters or to learn more about Filebeat.