Optimized Traffic Mirroring Examples – Part 2

In a previous post, we looked at an example of a fictional bookstore company and recommended mirroring strategies for that specific scenario. In this post, we’ll be looking at a fictional bank and recommended mirroring strategies for their network traffic.

For a list of the most commonly used strategies, check out our traffic mirroring tutorial.

GoldenBank

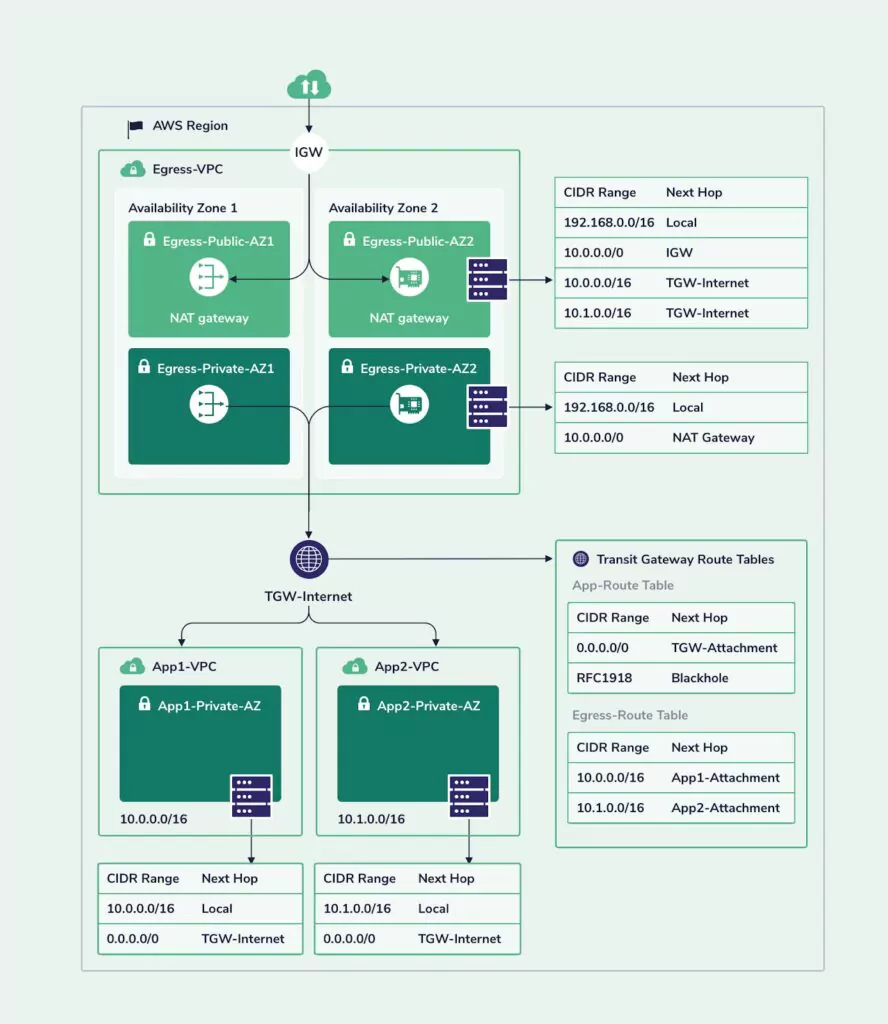
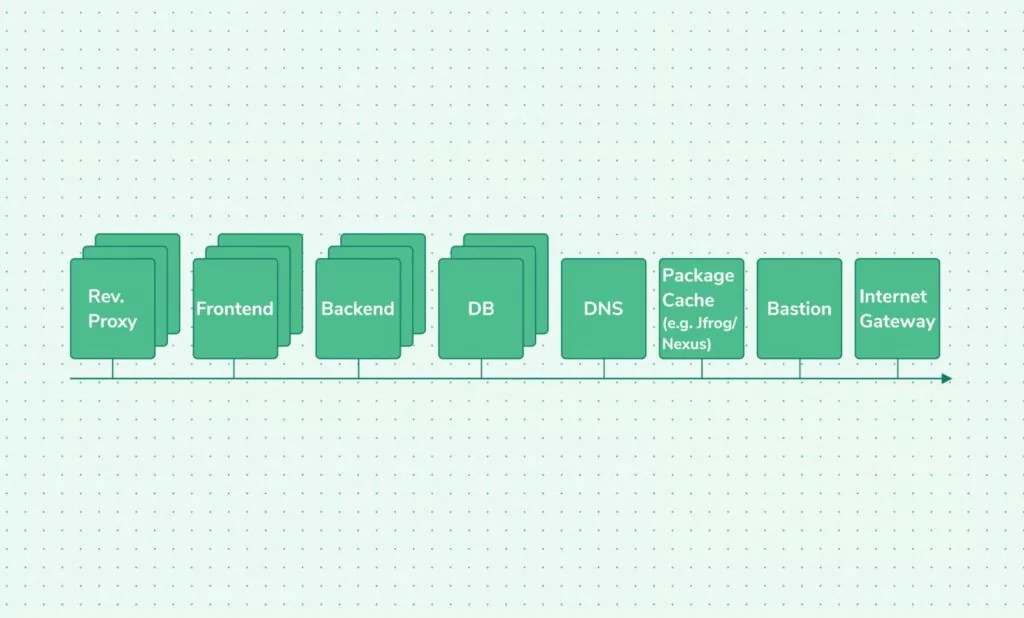
In this scenario, the client is running two different services, in two different private VPCs. The two VPCs cannot communicate with each other. The reverse proxies handle the majority of the traffic and perform basic request validations such as URIs and web methods and possibly also parameters type validation and then forward the request to the frontend servers.

Unlike the previous scenario, the connection between the reverse proxy and the frontend servers is also encrypted in TLS. The frontend servers perform business context validation of the requests and then process them by sending requests to the backend servers.
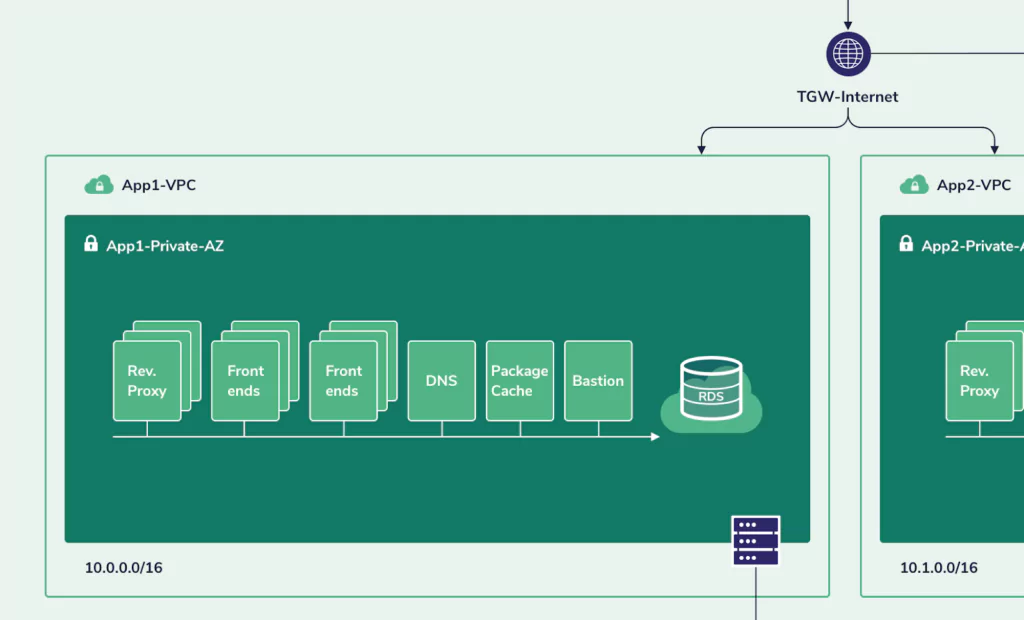
Close-up App1

Close-up App2

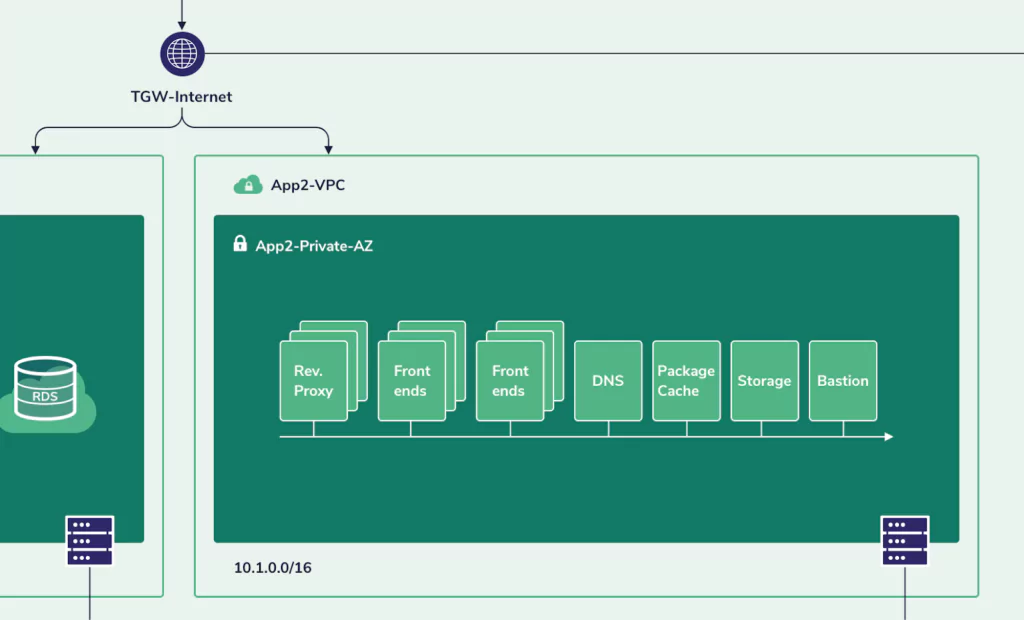
The backend servers in app1 rely on a storage server, while the backend servers of app2 rely on an AWS RDS service.

Following are the details of the security groups of all instances in both applications’ VPCs:

VPC App1

Rev Proxy

(No public IP)

FromToServiceStatus
anyanyHTTP/tcpAllow
anyanyHTTPS/tcpAllow
10.0.0.0/16FrontendHTTPS/tcpAllow
10.0.0.0/16anyNTP/udpAllow
BastionanySSH/tcpAllow
10.0.0.0/16DNSDNS/udpAllow
10.0.0.0/16Packages CacheHTTP/tcp, HTTPS/tcpAllow

Frontend

(No public IP)

FromToServiceStatus
Rev. Proxy10.0.0.0/16HTTPS/tcpAllow
10.0.0.0/16BackendCustom ports setAllow
10.0.0.0/16anyNTP/udpAllow
BastionanySSH/tcpAllow
10.0.0.0/16DNSDNS/udpAllow
10.0.0.0/16Packages CacheHTTP/tcp, HTTPS/tcpAllow

Backend

(No Public IP)

FromToServiceStatus
Frontend10.0.0.0/16Custom ports setAllow
10.0.0.0/16StorageNFS/udpAllow
10.0.0.0/16StorageNFS/tcpAllow
10.0.0.0/16anyNTP/udpAllow
BastionanySSH/tcpAllow
10.0.0.0/16DNSDNS/udpAllow
10.0.0.0/16Packages CacheHTTP/tcp, HTTPS/tcpAllow

Storage

(No Public IP)

FromToServiceStatus
Backend10.0.0.0/16NFS/udpAllow
Backend10.0.0.0/16NFS/tcpAllow
10.0.0.0/16anyNTP/udpAllow
BastionanySSH/tcpAllow
10.0.0.0/16DNSDNS/udpAllow
10.0.0.0/16Packages CacheHTTP/tcp, HTTPS/tcpAllow

DNS

(No Public IP)

FromToServiceStatus
10.0.0.0/16anyDNS/udpAllow
10.0.0.0/16anyNTP/udpAllow
BastionanySSH/tcpAllow
10.0.0.0/16Packages CacheHTTP/tcp, HTTPS/tcpAllow

Package Cache

(No Public IP)

10.0.0.0/16anyHTTP/tcp, HTTPS/tcpAllow
10.0.0.0/16anyNTP/udpAllow
BastionanySSH/tcpAllow
10.0.0.0/16DNSDNS/udpAllow

Here are our visibility recommendations for similar networks:

Reverse Proxies and Front-end servers

Outbound

Rule numberDescriptionRule actionProtocolSource port rangeDestination port rangeSource CIDR blockDestination CIDR block
100Monitor everything *acceptAll protocols0.0.0.0/00.0.0.0/0

* Even though most of the traffic is encrypted since it would include responses to client requests, the outbound traffic is still extremely valuable. It can indicate the size of the data being sent to the client and assist in detecting large data leaks, it can detect connections originating from the reverse proxy itself and help detect command and control connections, it can also detect connections or connection attempts to other servers other than the frontend servers which can detect lateral movement.

Inbound

Rule numberDescriptionRule actionProtocolSource port rangeDestination port rangeSource CIDR blockDestination CIDR block
100Drop HTTPS*rejectTCP4430.0.0.0/010.0.0.0/16
200Monitor everything elseacceptAll protocols0.0.0.0/00.0.0.0/0

* Since the incoming traffic on HTTPS is encrypted, the only thing it can indicate is its volume over time which can indicate certain types of DoS or DDoS and also the validity of the certificates used. So if the traffic volume is expected to be high, we would recommend excluding this traffic.

Backend servers

Since the frontend servers are contacting these servers with requests that are supposed to be valid after the checks done by the proxy and frontend servers, the traffic volume is expected to be significantly lower than traffic volume to the proxy and frontend servers.

Also, since this is the last chance to detect malicious traffic before it reaches the database, we believe that all traffic from these servers should be mirrored. However, if this is still too expensive for your organization, we would recommend that you use the following mirroring configuration to at least be able to tell if a backend server is behaving abnormally which may indicate that it has already been breached:

Outbound

Rule numberDescriptionRule actionProtocolSource port rangeDestination port rangeSource CIDR blockDestination CIDR block
100Exclude file service activity **rejectTCPNFS10.0.0.0/1610.0.0.0/16
200Exclude file service activity **rejectUDPNFS10.0.0.0/1610.0.0.0/16
300Monitor everything *acceptAll protocols0.0.0.0/00.0.0.0/0

* – Although this rule will also mirror the server’s responses to frontend requests we do recommend that you mirror it since it might also contain HTTPS connections initiated by malware running on the proxy servers to command and control servers. Also, this might include unintended responses that will indicate that an attack (such as XSS or SQL Injection) took place.

** – Since the filesystem activity is usually heavy, we would recommend you avoid mirroring this type of traffic unless it is highly valuable in your application or network architecture.

Inbound

Rule numberDescriptionRule actionProtocolSource port rangeDestination port rangeSource CIDR blockDestination CIDR block
100Monitor everything elseacceptAll protocols0.0.0.0/00.0.0.0/0

Storage Servers

Outbound

Rule numberDescriptionRule actionProtocolSource port rangeDestination port rangeSource CIDR blockDestination CIDR block
100Exclude file service activity *rejectTCPNFS10.0.0.0/1610.0.0.0/16
200Exclude file service activity *rejectUDPNFS10.0.0.0/1610.0.0.0/16
300Monitor everythingacceptAll protocols0.0.0.0/00.0.0.0/0

DNS server

Since this server generates a very minimal amount of traffic that is so extremely valuable for detecting so many types of attacks we recommend that you would mirror all traffic in and out of this server.

Package cache server

Since this server is responsible for packages installations on all other servers, the data from and to this server can answer questions like who installed what and when, which can be crucial in a forensic investigation and for detecting installation of malicious tools on the server.

Also, the traffic volume from and to this server is expected to be quite low. Therefore, we recommend that you would mirror all traffic in and out of this server.

Bastion server

Since this server is serving as the only way to manage all other servers, provided that it is being used to update the code on the various servers, install required packages, etc., the traffic volume should be relatively low and the value of the data it can provide is extremely high and therefore we recommend that you would mirror all traffic in and out of this server.

VPC App2

Rev Proxy

(No Public IP)

anyanyHTTP/tcpAllow
anyanyHTTPS/tcpAllow
10.1.0.0/16FrontendHTTPS/tcpAllow
10.1.0.0/16anyNTP/udpAllow
BastionanySSH/tcpAllow
10.1.0.0/16DNSDNS/udpAllow
10.1.0.0/16Packages CacheHTTP/tcp, HTTPS/tcpAllow

Frontend

(No Public IP)

Rev. Proxy10.1.0.0/16HTTPS/tcpAllow
10.1.0.0/16BackendCustom ports setAllow
10.1.0.0/16anyNTP/udpAllow
BastionanySSH/tcpAllow
10.1.0.0/16DNSDNS/udpAllow
10.1.0.0/16Packages CacheHTTP/tcp, HTTPS/tcpAllow

Backend

(No Public IP)

Frontend10.0.0.0/16Custom ports setAllow
10.1.0.0/16RDSDB portsAllow
10.1.0.0/16anyNTP/udpAllow
BastionanySSH/tcpAllow
10.1.0.0/16DNSDNS/udpAllow
10.1.0.0/16Packages CacheHTTP/tcp, HTTPS/tcpAllow

RDS

(No Public IP)

Backend10.1.0.0/16DB portsAllow
10.1.0.0/16anyNTP/udpAllow
BastionanySSH/tcpAllow
10.1.0.0/16DNSDNS/udpAllow
10.1.0.0/16Packages CacheHTTP/tcp, HTTPS/tcpAllow

DNS

(No Public IP)

10.1.0.0/16anyDNS/udpAllow
10.1.0.0/16anyNTP/udpAllow
BastionanySSH/tcpAllow
10.1.0.0/16Packages CacheHTTP/tcp, HTTPS/tcpAllow

Package Cache

(No Public IP)

10.1.0.0/16anyHTTP/tcp, HTTPS/tcpAllow
10.1.0.0/16anyNTP/udpAllow
BastionanySSH/tcpAllow
10.1.0.0/16DNSDNS/udpAllow

This network architecture is quite complex and would require an approach that would combine multiple data sources to provide proper security for it. In addition, it involves traffic that is completely encrypted, storage servers that are contacted via encrypted connections, and also AWS services that cannot be mirrored to the STA.

Here are our visibility recommendations for similar networks:

Reverse Proxies and Front-end servers

Outbound

Rule numberDescriptionRule actionProtocolSource port rangeDestination port rangeSource CIDR blockDestination CIDR block
100Monitor everything *acceptAll protocols0.0.0.0/00.0.0.0/0

* Even though most of the traffic is encrypted since it would include responses to clients requests, the outbound traffic is still extremely valuable. It can indicate the size of the data being sent to the client and assist in detecting large data leaks, it can detect connections originating from the reverse proxy itself and help detect command and control connections, it can also detect connections or connection attempts to other servers other than the frontend servers which can detect lateral movement.

Inbound

Rule numberDescriptionRule actionProtocolSource port rangeDestination port rangeSource CIDR blockDestination CIDR block
100Drop HTTPS*rejectTCP4430.0.0.0/010.1.0.0/16
200Monitor everything elseacceptAll protocols0.0.0.0/00.0.0.0/0

* Since the incoming traffic on HTTPS is encrypted, the only thing it can indicate is its volume over time which can indicate certain types of DoS or DDoS and also the validity of the certificates used. So if the traffic volume is expected to be high, we would recommend excluding this traffic.

Backend servers

Outbound

Rule numberDescriptionRule actionProtocolSource port rangeDestination port rangeSource CIDR blockDestination CIDR block
100Monitor everything *acceptAll protocols0.0.0.0/00.0.0.0/0

* – Since this server is expected to communicate with the RDS service, we would recommend mirroring all the traffic from this instance as this will allow the detection of database-related attacks. In addition, the RDS security group should be configured to allow connections only from the backend server (this can be more strict by configuring the RDS itself to allow connections only if they were identified by a certificate that exists only on the backend server) and an alert should be defined in Coralogix based on CloudTrail logs that would fire if the security group is modified.

Also, by forwarding the database logs from the RDS instance, an alert should be defined in Coralogix so it would be triggered if the database detects connections from other IPs.

Inbound

Since the traffic volume here should be quite low due to the validations done by the proxies and front-end servers, and due to the fact that this is the last point we can tap into the data before it is saved into the DB we recommend that you mirror all incoming traffic from this server

Rule numberDescriptionRule actionProtocolSource port rangeDestination port rangeSource CIDR blockDestination CIDR block
100Monitor everything *acceptAll protocols0.0.0.0/00.0.0.0/0

DNS server

Since this server generates a very minimal amount of traffic that is so extremely valuable for detecting so many types of attacks we recommend that you mirror all traffic in and out of this server.

Package cache server

Since this server is responsible for packages installations on all other servers, the data from and to this server can answer questions like who installed what when, which can be crucial in a forensic investigation and for detecting installation of malicious tools on the server. Also, the traffic volume from and to this server is expected to be quite low. Therefore, we recommend that you mirror all traffic in and out of this server.

Bastion server

Since this server is serving as the only way to manage all other servers, provided that it is being used to update the code on the various servers, install required packages, etc., the traffic volume should be relatively low and the value of the data it can provide is extremely high and therefore we recommend that you mirror all traffic in and out of this server.

Summary

Just like in any other field of security, there is no real right or wrong here, it’s more a matter of whether or not it is worth the trade-off in particular cases. There are several strategies that can be taken to minimize the overall cost of the AWS traffic monitoring solution and still get acceptable results.

For a list of the most commonly used strategies, check out our traffic mirroring tutorial.

Optimized Security Traffic Mirroring Examples – Part 1

You have to capture everything to investigate security issues thoroughly, right? More often than not, data that at one time was labeled irrelevant and thrown away is found to be the missing piece of the puzzle when investigating a malicious attacker or the source of an information leak.

So, you need to capture every network packet. As ideal as this might be, capturing every packet from every workstation and every server in every branch office is usually impractical and too expensive, especially for larger organizations. 

In this post, we’ll look at an example of a fictional bookstore company and the recommended mirroring strategies for that specific scenario. 

For a list of the most commonly used strategies, check out our traffic mirroring tutorial.

MyBookStore Company

This example represents a simple books store. The frontend servers hold the code for handling customers’ requests for searching and purchasing books, all the system’s data is stored in the database servers. Currently, the throughput to the website is not extremely high but is expected to grow significantly in the upcoming months due to the new year’s sales.

The network diagram above describes a typical network of a SaaS service. It’s a collection of reverse proxies that handle HTTPS encryption and client connections after basic validation, such as URIs paths and sometimes even parameters and HTTP methods. They  then send the HTTP requests as HTTP to the frontend servers, making requests to their backend servers that process the data and update or query the DB servers and return the requested result.

Security groups and public IP configuration

The following table represents the network security measures indicated by the allowed connections in and out of each server shown on the diagram.

Rev Proxy

(With public IP)

FromToServiceStatus
anyanyHTTP/tcpAllow
anyanyHTTPS/tcpAllow
192.168.1.0/24FrontendHTTP/tcpAllow
192.168.1.0/24anyNTP/udpAllow
BastionanySSH/tcpAllow
192.168.1.0/24DNSDNS/udpAllow
192.168.1.0/24Packages CacheHTTP/tcp, HTTPS/tcpAllow

Frontend

(No public IP)

FromToServiceStatus
Rev. Proxy192.168.1.0/24HTTP/tcpAllow
192.168.1.0/24BackendSet of custom portsAllow
192.168.1.0/24anyNTP/udpAllow
Bastion192.168.1.0/24SSH/tcpAllow
192.168.1.0/24DNSDNS/udpAllow
192.168.1.0/24Packages CacheHTTP/tcp, HTTPS/tcpAllow

Backend

(No public IP)

FromToServiceStatus
Frontend192.168.1.0/24Set of custom portsAllow
192.168.1.0/24DBDB PortsAllow
192.168.1.0/24anyNTP/udpAllow
Bastion192.168.1.0/24SSH/tcpAllow
192.168.1.0/24DNSDNS/udpAllow
192.168.1.0/24Packages CacheHTTP/tcp, HTTPS/tcpAllow

DB

(No public IP)

FromToServiceStatus
Backend192.168.1.0/24DB ports/tcpAllow
192.168.1.0/24anyNTP/udpAllow
Bastion192.168.1.0/24SSH/tcpAllow
192.168.1.0/24DNSDNS/udpAllow
192.168.1.0/24Packages CacheHTTP/tcp, HTTPS/tcpAllow

DNS

(No public IP)

FromToServiceStatus
192.168.1.0/24DNSDNS/udpAllow
192.168.1.0/24anyNTP/udpAllow
192.168.1.0/24anyDNS/udpAllow
Bastion192.168.1.0/24SSH/tcpAllow
192.168.1.0/24Packages CacheHTTP/tcp, HTTPS/tcpAllow

Packages Cache

(No public IP)

FromToServiceStatus
192.168.1.0/24anyHTTP/tcp, HTTPS/tcpAllow
192.168.1.0/24anyNTP/udpAllow
192.168.1.0/24anyDNS/udpAllow
Bastion192.168.1.0/24SSH/tcpAllow

Bastion

(With public IP)

FromToServiceStatus
Well defined set of IP addresses192.168.1.0/24SSH/tcpAllow
192.168.1.0/24anyNTP/udpAllow
192.168.1.0/24DNSDNS/udpAllow
192.168.1.0/24Packages CacheHTTP/tcp, HTTPS/tcpAllow

In this setup, the only servers that are exposed to the Internet and expected to be reachable by other servers on the Internet are the proxy servers and the bastion server. All other servers do not have a public IP address assigned to them. 

All DNS queries are expected to be sent to the local DNS server, resolving them against other DNS servers on the Internet.

Package installations and updates for all the servers on this network are expected to be handled against the local packages caching server. So all other servers will not need to access the Internet at all except for time synchronization against public NTP servers.

SSH connections to the servers are expected to happen only via the bastion server and not directly from the Internet.

In this scenario, we would recommend using the following mirroring configuration by server type.

Reverse Proxies

Since these servers are contacted by users from the Internet over a TLS encrypted connection, most of the traffic to it should be on port 443 (HTTPS) and its value to traffic rate ratio is expected to be quite low, we would recommend the following mirror filter configuration:

Outbound

Rule numberDescriptionRule actionProtocolSource port rangeDestination port rangeSource CIDR blockDestination CIDR block
100Monitor everything *acceptAll protocols0.0.0.0/00.0.0.0/0

* Note – Although this rule will also mirror the server’s encrypted responses to the HTTPS requests we do recommend that you mirror it since it might also contain HTTPS connections initiated by malware running on the proxy servers to command and control servers and especially since the traffic volume of the server’s responses is not expected to be extremely high.

Inbound

Rule numberDescriptionRule actionProtocolSource port rangeDestination port rangeSource CIDR blockDestination CIDR block
100Exclude incoming HTTPSrejectTCP4430.0.0.0<your servers subnet>
200Monitor everything elseacceptAll protocols0.0.0.0/00.0.0.0/0

Frontend servers

Since the frontend servers receive the unencrypted traffic they are essentially the first place on the network in which we can detect attacks against the system and therefore their traffic data is very valuable from an information security perspective. 

This is why we believe that you would mirror any traffic from and to these servers. This will, of course, include the valid traffic by the customers. Although this can be extremely valuable for creating a good baseline that can later be used to detect anomalies, it can also be rather expensive for the organization. 

For such cases we would recommend the following mirroring configuration for detecting abnormal behavior of the frontend servers that can indicate a cyberattack that is currently in progress:

Outbound

Rule numberDescriptionRule actionProtocolSource port rangeDestination port rangeSource CIDR blockDestination CIDR block
100Monitor everything *acceptAll protocols0.0.0.0/00.0.0.0/0

* Note – Although this rule will also mirror the server’s responses to the HTTPS requests, we do recommend that you mirror it since it might also contain HTTPS connections initiated by malware running on the proxy servers to command and control servers. Also, this might include unintended responses that will indicate that an attack (such as XSS or SQL Injection) took place.

Inbound

Rule numberDescriptionRule actionProtocolSource port rangeDestination port rangeSource CIDR blockDestination CIDR block
100Exclude incoming HTTPSrejectTCP800.0.0.0/0<your servers subnet>
200Monitor everything elseacceptAll protocols0.0.0.0/00.0.0.0/0

Backend servers

Since the frontend servers are contacting these servers with requests that are supposed to be valid after the checks done by the proxy and frontend servers, the traffic volume is expected to be significantly lower than traffic volume to the proxy and frontend servers.

Also, since this is the last chance to detect malicious traffic before it reaches the database, we believe that all traffic from these servers should be mirrored. However, if this is still too expensive for your organization, we would recommend that you use the following mirroring configuration to at least be able to tell if a backend server is behaving abnormally, which may indicate that it has already been breached:

Outbound

Rule numberDescriptionRule actionProtocolSource port rangeDestination port rangeSource CIDR blockDestination CIDR block
100Monitor everything *acceptAll protocols0.0.0.0/00.0.0.0/0

* Note – Although this rule will also mirror the server’s responses to frontend requests we do recommend that you mirror it since it might also contain HTTPS connections initiated by malware running on the proxy servers to command and control servers. Also, this might include unintended responses that will indicate that an attack (such as XSS or SQL Injection) took place.

Inbound

Rule numberDescriptionRule actionProtocolSource port rangeDestination port rangeSource CIDR blockDestination CIDR block
100Exclude incoming HTTPSrejectTCPSet of custom ports<your servers subnet><your servers subnet>
200Monitor everything elseacceptAll protocols0.0.0.0/00.0.0.0/0

Databases

Since this server is at the heart of the customer’s system, we recommend that you would mirror all traffic in and out of this server.

DNS server

Since this server generates a very minimal amount of traffic that is so extremely valuable for detecting so many types of attacks we recommend that you would mirror all traffic in and out of this server.

Package cache server

Since this server is responsible for packages installations on all other servers, the data from and to this server can answer questions like who installed what and when which can be crucial in a forensic investigation and for detecting installation of malicious tools on the server. Also, the traffic volume from and to this server is expected to be quite low. Therefore, we recommend that you would mirror all traffic in and out of this server.

Bastion server

Since this server is serving as the only way to manage all other servers, provided that it is being used to update the code on the various servers, install required packages, etc., the traffic volume should be relatively low and the value of the data it can provide is extremely high and therefore we recommend that you would mirror all traffic in and out of this server.

Summary

Just like in any other field of security, there is no real right or wrong here, it’s more a matter of whether or not it is worth the trade-off in particular cases. There are several strategies that can be taken to minimize the overall cost of the AWS traffic monitoring solution and still get acceptable results.

For a list of the most commonly used strategies, check out our traffic mirroring tutorial.

Exciting New Features of Coralogix STA

We at Coralogix, believe that cloud security is not a “nice-to-have” feature – something that only large organizations can benefit from or are entitled to have. We believe it’s a basic need that should be solved for organizations of any shape and size. This is why we built the Coralogix Security Traffic Analyzer (STA) tool for packet sniffing and automated analysis. Today we’re announcing several new features to our security product you’ll find interesting.

1. Automatic AWS VPC Traffic Mirroring Configuration Manager

One of the great things about AWS is that everything can scale up and down as much as needed to keep costs at a minimum while not losing any important data. Now we brought this power to the VPC Traffic Mirroring configuration. You can read all about it here.

2. Spot/On-demand Choice

The new installation process of the STA now allows you to choose whether you’d like to run the STA as a spot instance of a spot fleet (for example for testing purposes) or as an on-demand instance. Now the choice is absolutely yours.

3. Configurable Size

Now you can choose the size of the machine that will be used for the STA.  The instance types that are going to be used based on the selected size are listed below:
[table id=40 /]

4. Automated configuration sync to S3

During installation, you can set an S3 bucket for the configuration of the STA, if the bucket is empty, the STA will automatically copy its config files to that bucket, if the bucket contains the STA config files and they have been modified (either manually by you or by a script…) the STA will automatically pull the new configuration and apply it. This configuration includes the following files:
[table id=41 /]
To learn more about how to modify these files see here.

5. Automated upload of .pcap files to S3

During installation, the user can set an S3 bucket that will be used by the STA to upload compressed pcap files of all the traffic that was observed by the STA. The user can then set any lifecycle hook on that bucket for automated cleanup of old pcap files. This bucket will also contain executable files extracted directly from the traffic. These pcap files can be used for many purposes, including forensic investigations, alert tuneups, deeper investigations of applications and services issues, and more.

6. Monitoring

The new STA contains a built-in Prometheus node-exporter that listens on the third network interface on the default port.

7. Domain letter frequency analysis

Many cyber attacks nowadays are using command and control servers, and kill-switches for their malicious code. These usually use machine-generated domain names. We added a new capability to the STA to automatically calculate a score for each domain, parent domain virtual host, certificate CN, etc. based on the frequency of letter combinations that are expected to be rare and letter combinations that are expected to be frequent. This score can be used to detect machine-generated domains in certificates, common names, and DNS requests, and several other locations where the domain name can be found.

8. “Baby Domains”

Employees and even more so, servers that are accessing domains that are “young” in the sense that they were registered only very recently are often good indications of malicious activity. The new version of the STA automatically pulls a list of domains with their creation date and adds the creation date to every domain detected in DNS requests, virtual hosts, and many other fields that contain a domain name. In addition, the new version of the STA contains a special dashboard for displaying such “baby domains” that were accessed by monitored servers and clients.

9. NIST Enrichment

The STA will automatically attempt to detect the software and version on the client and server machines that took part in the communications seen by the STA. Based on that information, the STA will attempt to detect CVEs (Common Vulnerability Enumeration) numbers associated with that software by MITRE and will alert you if a new type of software is found or if a new vulnerable software was detected.

10. Default Alerts

We added a default set of more than 60 alerts that will be added to your account after the installation of the STA. These alerts will help you to get started with the STA and dramatically improve your organization’s security posture. You can read more about these alerts here.

11. Default Dashboards

We added a default set of more than 60 different dashboards to help you slice and dice the data to find your needle in the huge haystack

That’s it for now. We have lots of new exciting features just waiting to be released in the next versions so stay tuned.

What is the Coralogix Security Traffic Analyzer (STA), and Why Do I Need It?

The wide-spread adoption of cloud infrastructure has proven to be highly beneficial, but has also introduced new challenges and added costs – especially when it comes to security.

As organizations migrate to the cloud, they relinquish access to their servers and all information that flows between them and the outside world. This data is fundamental to both security and observability.

Cloud vendors such as AWS are attempting to compensate for this undesirable side effect by creating a selection of services which grant the user access to different parts of the metadata. Unfortunately, the  disparate nature of these services only creates another problem. How do you bring it all together?

The Coralogix Cloud Security solution enables organizations to quickly centralize and improve their security posture, detect threats, and continuously analyze digital forensics without the complexity, long implementation cycles, and high costs of other solutions.

The Security Traffic Analyzer Can Show You Your Metadata

Using the Coralogix Security Traffic Analyzer (STA), you gain access to the tools that you need to analyze, monitor and alert on your data, on demand.

Here’s a list of data types that are available for AWS users:

[table id=43 /]

Well… That doesn’t look very promising, right? This is exactly the reason why we developed the Security Traffic Analyzer (STA).

What can the Security Traffic Analyzer do for you?

Simple Installation

When you install the STA, you get an AWS instance and several other related resources.

Mirror Your Existing VPC Traffic

You can mirror your server traffic to the STA (by using VPC traffic mirroring). The STA will automatically capture, analyze and optionally store the traffic for you while creating meaningful logs in your Coralogix account. You can also create valuable dashboards and alerts. To make it even easier, we created the VPC Traffic Mirroring Configuration Automation handler which automatically updates your mirroring configuration based on instance tags and tag values in your AWS account. This allows you to declaratively define your VPC traffic mirroring configuration.

Machine Learning-Powered Analysis

The STA employs ML-powered algorithms which alert you to potential threats with the complete ability to tune, disable and easily create any type of new alerts.

Automatically Enrich Your Logs

The STA automatically enriches the data passing through it such as domain names, certificate names, and much more by using data from several other data sources. This allows you to create more meaningful alerts and reduce false-positives while not increasing false-negatives.

What are the primary benefits of the Coralogix STA?

Ingest Traffic From Any Source

Connect any source of information to complete your security observability, including Audit logs, Cloudtrail, GuardDuty or any other source. Monitor your security data in one of 100+ pre-built dashboards or easily build your own using our variety of visualization tools and APIs.

Customizable Alerts & Visualizations

The Coralogix Cloud Security solution comes with a predefined set of alerts, dashboards and Suricata rules. Unlike many other solutions on the market today, you maintain the ability to change any or all of them to tailor them to your organization’s needs.

One of the most painful issues that usually deters people from using an IDS solution is that they are notorious for their high false-positive rate, but Coralogix makes it unbelievably easy to solve these kinds of issues. Dynamic ML-powered  alerts, dashboards, and Suricata rules are just a matter of 2-3 clicks and you’re done.

Automated Incident Response

Although Coralogix focuses on detection rather than prevention, it is still possible to achieve both detection and better prevention by integrating Coralogix with any orchestration platform such as Cortex XSOAR and others. 

Optimized Storage Costs

Security logs need to be correlated with packet data in order to provide needed context to perform deep enough investigations. Setting up, processing, and storing packet data can be laborious and cost-prohibitive.

With the Coralogix Optimizer, you can reduce up to 70% of storage costs without sacrificing full security coverage and real-time monitoring. This new model enables you to get all of the benefits of an ML-powered logging solution at only a third of the cost and with more real-time analysis and alerting capabilities than before.

How Does the Coralogix STA Compare to AWS Services?

Here’s a full comparison between the STA and all the other methods discussed in this article:

[table id=44 /]

(1) Will be added soon in upcoming versions

As you can see, the STA is already the most effective solution for gaining back control and access to your metadata. In the upcoming versions, we’ll also improve the level of network visibility by further enriching the data collected, allowing you to make even more fine-grained alerting rules.

Writing Effective Suricata Rules with Examples [Best Practices]

This post will help you write effective Suricata Rules to materially improve your security posture. We’ll begin with a breakdown of how a Rule is constructed and then explore best practices with examples in order to capture as many malicious activities as possible while using as few rules as possible.

Suricata is an open-source network intrusion detection system (NIDS) that provides real-time packet analysis and is part of the Coralogix STA solution. If you’re a Coralogix STA customer,  be sure to also check my earlier post on How to Modify an STA Suricata Rule

Anatomy of Suricata Rules

Before diving into the different strategies for writing your best Suricata rules, let’s start off by dissecting an example Suricata Rule:

alert tcp $EXTERNAL_NET any -> 10.200.0.0/24 80 (msg:"WEB-IIS CodeRed v2 root.exe access"; flow:to_server,established; uricontent:"/root.exe"; nocase; classtype:web application-attack; reference:url,www.cert.org/advisories/CA-2001 19.html; sid:1255; rev:7;)

alert: tells Suricata to report this behavior as an alert (it’s mandatory in rules created for the STA).

tcp: means that this rule will only apply to traffic in TCP.

$EXTERNAL_NET: this is a variable defined in Suricata. By default, the variable HOME_NET is defined as any IP within these ranges: 192.168.0.0/16,10.0.0.0/8,172.16.0.0/12 and EXTERNAL_NET is defined as any IP outside of these ranges. You can specify IP addresses either by specifying a single IP like 10.200.0.0, an IP CIDR range like 192.168.0.0/16 or a list of IPs like [192.168.0.0/16,10.0.0.0/8]. Just note that spaces within the list are not allowed.

any: in this context, it means “from any source port”, then there’s an arrow ‘->’ which means “a connection to” (there isn’t a ‘<-‘ operator, but you can simply flip the arguments around the operator. You can use the ‘<>’ operator to indicate that the connection direction is irrelevant for this rule), then an IP range which indicates the destination IP address and then the port. You can indicate a port range by using colon like 0:1024 which means 0-1024. In the round parenthesis, there are some directives for setting the alert message, metadata about the rule, as well as additional checks.

msg: is a directive that simply sets the message that will be sent (to Coralogix in the STA case) in case a matching traffic will be detected.

flow: is a directive that indicates whether the content we’re about to define as our signature needs to appear in the communication to the server (“to_server”) or to the client (“to_client”). This can be very useful if, for example, we’d like to detect the server response that indicates that it has been breached.

established: is a directive that will cause Suricata to limit its search for packets matching this signature to packets that are part of established connections only. This is useful to minimize the load on Suricata.

uricontent: is a directive that instructs Suricata to look for a certain text in the normalized HTTP URI content. In this example, we’re looking for a url that is exactly the text “/root.exe”.

nocase: is a directive that indicates that we’d like Suricata to conduct a case insensitive search.

classtype: is a directive that is a metadata attribute indicating which type of activity this rule detects.

reference: is a directive that is a metadata attribute that links to another system for more information. In our example, the value url,<https://….> links to a URL on the Internet.

sid: is a directive that is a metadata attribute that indicates the signature ID. If you are creating your own signature (even if you’re just replacing a built-in rule), use a value above 9,000,000 to prevent a collision with another pre-existing rule.

rev: is a directive that indicates the version of the rule.

There’s a lot more to learn about Suricata rules which supports RegEx parsing, protocol-specific parsing (just like uricontent for HTTP), looking for binary (non-textual) data by using bytes hex values, and much much more. If you’d like to know more you can start here.

Best Practices to Writing Effective Suricata Rules

  1. Target the vulnerability, not the exploit – Avoid writing rules for detecting a specific exploit kit because there are countless exploits for the same vulnerability and we can be sure that new ones are being written as you’re reading this. For example, many of the early signatures for detecting buffer overrun attacks looked like this:
    alert tcp $EXTERNAL_NET any -> $HOME_NET 80 (content:"AAAAAAAAAAAAAA", msg:"Buffer overrun detected.")

    The reason for that is of course that to launch a successful buffer overrun attack, the attacker needs to fill the buffer of a certain variable and add his malicious payload at the end so that it would become executable. The characters he chooses to use to fill the buffer are completely insignificant and indeed, after such signatures appeared, many attack toolkits simply used a different letter or letters to fill the buffer and completely evaded this type of signature detection. A much better way would be to attempt to detect these kind of attacks by detecting incorrect input to fields based on their type and length.

  2. Your peculiarity is your best asset, so use it – Every organization has things that make it unique. Many of these can be quite useful when you try to catch malicious activity in your organization – both external and internal. By using this deep internal knowledge to your advantage, you’ll essentially convert the problem from a technological one to a pure old-school intelligence problem, forcing attackers to have a much more intimate understanding of your organization in order to be able to hide their tracks effectively. These things can be technological in nature or based on your organization’s particular working habits and internal guidelines. Here are some examples:
    • Typical Working Hours: Some organizations I worked at did not allow employees to work from home at all and the majority of employees would have already left the office by 19:00. For similar organizations, it would make sense to set an alert to notify you of connections from the office after a certain hour. An attacker that would install malicious software in your organization would have to know that behavior and tune his malware to communicate with its Command & Control servers at precisely the same time such communications would go unnoticed.
    • Typical Browser: Suppose your organization has decided to use the Brave browser as its main browser and it gets installed on every new corporate laptop automatically and you have removed the desktop shortcuts to IE/Edge browser from all of your corporate laptops. If this is the case, a connection from the organization, both to an internal as well as external addresses that use a different browser such as IE/Edge should be configured to raise an alert.
    • IP Ranges based on Roles: If it’s possible for you to assign different IP ranges for different servers based on their role, for example, to have all DB servers on 192.168.0.0/24, the web servers on 192.168.1.0/24, etc then it would be possible and even easy to set up clever rules based on the expected behavior of your servers based on their role. For example, database servers usually don’t connect to other servers on their own, printers don’t try to connect to your domain controllers, etc.
    • Unusual Connection Attempts: Many organizations use a public share on a file server to help their users share files between them and use network enabled printers to allow their users to print directly from their computers. That means that client computers should not connect to each other, even if you have (wisely) chosen to block such access in a firewall or at the switch, the very attempt to connect from one client to another client computer should raise an alert and be thoroughly investigated.
    • Uncommon Ports: Some organizations use a special library for communication optimizations between services so that all HTTP communication between servers uses a different port than the common ones (such as 80, 443, 8080, etc). In this case, it’s a good idea to create a rule that would be triggered by any communication on these normally common ports.
  3. Honeytokens – In a battle field like the Internet where everyone can be just about anyone, deception, works well for defenders just as well as it does for the attackers, if not better. Tricks like renaming the built in administrator account to a different, less attractive name and creating a new account named Administrator which you’ll never use and create a Suricata rule for detecting if this user name, email or password are ever used on the network. It would be next to impossible for attackers to notice that Suricata has detected their attempts to use the fake administrator user. Another example is to create fake products, customers, users, and credit card records in the database and then matching Suricata rules for detecting them in the network traffic.

We hope you found this information helpful. For more information on the Coralogix STA, check out the latest features we recently released.

How to automate VPC Mirroring for Coralogix STA

After installing the Coralogix Security Traffic Analyzer (STA) and choosing a mirroring strategy suitable for your organization needs (if not, you can start by reading this) the next step would be to set the mirroring configuration in AWS. However, the configuration of VPC Traffic Mirroring in AWS is tedious and cumbersome – it requires you to create a mirror session per network interface of every mirrored instance, and just to add an insult to injury, if that instance terminates for some reason and a new one replaces it you’ll have to re-create the mirroring configuration from scratch. If you, like many others, use auto-scaling groups to automatically scale your services up and down based on the actual need, the situation becomes completely unmanageable.

Luckily for you, we at Coralogix have already prepared a solution for that problem. In the next few lines I’ll present a tool we’ve written to address that specific issue as well as few use-cases for it.

The tool we’ve developed can run as a pod in Kubernetes or inside a Docker container. It is written in Go to be as efficient as possible and will require only minimal set of resources to run properly. While it is running it will read its configuration from a simple JSON file and will select AWS EC2 instances by tags and then will select network interfaces on those instances and will create VPC Traffic Mirroring sessions for each network interface selected to the configured VPC Mirroring Target using the configured VPC Mirroring Filter.

The configuration used in this document will instruct the sta-vpc-mirroring-manager to look for AWS instances that have the tags “sta.coralogixstg.wpengine.com/mirror-filter-id” and “sta.coralogixstg.wpengine.com/mirror-target-id” (regardless of the value of those tags), collect the IDs of their first network interfaces (that are connected as eth0) and attempt to create a mirror session for each network interface collected to the mirror target specified by the tag “sta.coralogixstg.wpengine.com/mirror-target-id” using the filter ID specified by the tag “sta.coralogixstg.wpengine.com/mirror-filter-id” on the instance that network interface is connected to.

To function properly, the instance hosting this pod should have an IAM role attached to it (or the AWS credentials provided to this pod/container should contain a default profile) with the following permissions:

  1. ec2:Describe* on *
  2. elasticloadbalancing:Describe* on *
  3. autoscaling:Describe* on *
  4. ec2:ModifyTrafficMirrorSession on *
  5. ec2:DeleteTrafficMirrorSession on *
  6. ec2:CreateTrafficMirrorSession on *

Installation

This tool can be installed either as a kubernetes pod or a docker container. Here are the detailed instructions for installing it:

Installation as a docker container:

  1. To download the docker image use the following command:
    docker pull coralogixrepo/sta-vpc-mirroring-config-manager:latest
  2. On the docker host, create a config file for the tool with the following content (if you would like the tool to report to the log what is about to be done without actually modifying anything set “dry_run” to true):
    {
      "service_config": {
        "rules_evaluation_interval": 10000,
        "metrics_exporter_port": ":8080",
        "dry_run": false
      },
      "rules": [
        {
          "conditions": [
            {
              "type": "tag-exists",
              "tag_name": "sta.coralogixstg.wpengine.com/mirror-target-id"
            },
            {
              "type": "tag-exists",
              "tag_name": "sta.coralogixstg.wpengine.com/mirror-filter-id"
            }
          ],
          "source_nics_matching": [
            {
              "type": "by-nic-index",
              "nic_index": 0
            }
          ],
          "traffic_filters": [
            {
              "type": "by-instance-tag-value",
              "tag_name": "sta.coralogixstg.wpengine.com/mirror-filter-id"
            }
          ],
          "mirror_target": {
            "type": "by-instance-tag-value",
            "tag_name": "sta.coralogixstg.wpengine.com/mirror-target-id"
          }
        }
      ]
    }
    
  3. Use the following command to start the container:
    docker run -d 
       -p <prometheus_exporter_port>:8080 
       -v <local_path_to_config_file>:/etc/sta-pmm/sta-pmm.conf 
       -v <local_path_to_aws_profile>/.aws:/root/.aws 
       -e "STA_PM_CONFIG_FILE=/etc/sta-pmm/sta-pmm.conf" 
       coralogixrepo/sta-vpc-mirroring-config-manager:latest

Installation as a Kubernetes deployment:

    1. Use the following config map and deployment configurations:
      apiVersion: v1
      kind: ConfigMap
      data:
        sta-pmm.conf: |
          {
            "service_config": {
              "rules_evaluation_interval": 10000,
              "metrics_exporter_port": 8080,
              "dry_run": true
            },
            "rules": [
              {
                "conditions": [
                  {
                    "type": "tag-exists",
                    "tag_name": "sta.coralogixstg.wpengine.com/mirror-target-id"
                  },
                  {
                    "type": "tag-exists",
                    "tag_name": "sta.coralogixstg.wpengine.com/mirror-filter-id"
                  }
                ],
                "source_nics_matching": [
                  {
                    "type": "by-nic-index",
                    "nic_index": 0
                  }
                ],
                "traffic_filters": [
                  {
                    "type": "by-instance-tag-value",
                    "tag_name": "sta.coralogixstg.wpengine.com/mirror-filter-id"
                  }
                ],
                "mirror_target": {
                  "type": "by-instance-tag-value",
                  "tag_name": "sta.coralogixstg.wpengine.com/mirror-target-id"
                }
              }
            ]
          }
      
      metadata:
        labels:
          app.kubernetes.io/component: sta-pmm
          app.kubernetes.io/name: sta-pmm
          app.kubernetes.io/part-of: coralogix
          app.kubernetes.io/version: '1.0.0-2'
        name: sta-pmm
        namespace: coralogix
      
      ----------
      apiVersion: apps/v1
      kind: Deployment
      metadata:
        labels:
          app.kubernetes.io/component: sta-pmm
          app.kubernetes.io/name: sta-pmm
          app.kubernetes.io/part-of: coralogix
          app.kubernetes.io/version: '1.0.0-2'
        name: sta-pmm
        namespace: coralogix
      spec:
        selector:
          matchLabels:
            app.kubernetes.io/component: sta-pmm
            app.kubernetes.io/name: sta-pmm
            app.kubernetes.io/part-of: coralogix
        template:
          metadata:
            labels:
              app.kubernetes.io/component: sta-pmm
              app.kubernetes.io/name: sta-pmm
              app.kubernetes.io/part-of: coralogix
              app.kubernetes.io/version: '1.0.0-2'
            name: sta-pmm
          spec:
            containers:
              - env:
                  - name: STA_PM_CONFIG_FILE
                    value: /etc/sta-pmm/sta-pmm.conf
                  - name: AWS_ACCESS_KEY_ID
                    value: XXXXXXXXXXXXXXXXXXXXXXXXXXXXXX
                  - name: AWS_SECRET_ACCESS_KEY
                    value: XXXXXXXXXXXXXXXXXXXXXXXXXXXXXX
                image: coralogixrepo/sta-vpc-mirroring-config-manager:latest
                imagePullPolicy: IfNotPresent
                livenessProbe:
                  httpGet:
                    path: "/"
                    port: 8080
                  initialDelaySeconds: 5
                  timeoutSeconds: 1
                name: sta-pmm
                ports:
                  - containerPort: 8080
                    name: sta-pmm-prometheus-exporter
                    protocol: TCP
                volumeMounts:
                  - mountPath: /etc/sta-pmm/sta-pmm.conf
                    name: sta-pmm-config
                    subPath: sta-pmm.conf
            volumes:
              - configMap:
                  name: sta-pmm-config
                name: sta-pmm-config
      

Configuration

To configure instances for mirroring, all you have to do is to make sure that the instances you would like their traffic to be mirrored to your STA, will have the tags “sta.coralogixstg.wpengine.com/mirror-filter-id” and “sta.coralogixstg.wpengine.com/mirror-target-id” pointing at the correct IDs of the mirror filter and target respectively. To find out the IDs of the mirror target and mirror filter that were created as part of the installation of the STA, enter the CloudFormation Stacks page in AWS Console and search for “TrafficMirrorTarget” and for “TrafficMirrorFilter” in the Resources tab:

To assign different mirroring policy to different instances, for example to mirror traffic on port 80 from some instances and mirror traffic on port 53 from other instances, simply create a VPC Traffic Mirror Filter manually with the correct filtering rules (just like in a firewall) and assign its ID to the “sta.coralogixstg.wpengine.com/mirror-filter-id” tag of the relevant instances.

Pro Tip: You can use AWS “Resource Groups & Tag Editor” to quickly assign tags to multiple instances based on an arbitrary criteria.

Good luck!