Using Auditbeat to protect your critical infrastructure

What are Beats
Beats are lightweight, purpose-built agents that acquire data and then feed it to Elasticsearch. Beats use the libbeat framework that makes it easy to create customized beats for any type of data you’d like to send to Elasticsearch.
What is Auditbeat
Auditbeat is a lightweight shipper from the Beats family that you can install on your servers to audit the activities of users and processes on your systems. AuditBeat comes with different modules that collect file system and security events from various operating systems, such as the Linux Audit framework.
Here are resources on how to install and configure Auditbeat.
In general, Auditbeat sends the state (periodically defined in the configuration) and event information. What it monitors depends on the modules and datasets defined in the configuration (the system module is in an experimental stage as of 1/23/2020).
Auditbeat Log Examples
Depending on the configuration and module, Auditbeat logs can have different fields and structures. Here are a few examples:
Successful Login Event
This log was generated by the system login dataset and describes a successful login event.
{
    "@timestamp": "2017-10-12T08:05:34.853Z",
    "event": {
        "action": "user_login",
        "category": "authentication",
        "dataset": "login",
        "kind": "event",
        "module": "system",
        "origin": "/var/log/wtmp",
        "outcome": "success",
        "type": "authentication_success"
    },
    "message": "Login by user vagrant (UID: 1000) on pts/2 (PID: 14962) from 10.0.2.2 (IP: 10.0.2.2)",
    "process": {
        "pid": 14962
    },
    "service": {
        "type": "system"
    },
    "source": {
        "ip": "10.0.2.2"
    },
    "user": {
        "id": 1000,
        "name": "vagrant",
        "terminal": "pts/2"
    }
}
User Added to System
This log is generated by the system user dataset and describes a user being added to the system.
{
    "@timestamp": "2017-10-12T08:05:34.853Z",
    "event": {
        "action": "user_added",
        "dataset": "user",
        "kind": "event",
        "module": "system"
    },
    "message": "New user myuser (UID: 1001, Groups: accounting,docker)",
    "service": {
        "type": "system"
    },
    "system": {
        "audit": {
            "user": {
                "dir": "/home/myuser",
                "gid": "1001",
                "group": [
                    {
                        "gid": "1001",
                        "name": "accounting"
                    },
                    {
                        "gid": "1002",
                        "name": "docker"
                    }
                ],
                "name": "myuser",
                "shell": "/bin/bash",
                "uid": "1001"
            }
        }
    },
    "user": {
        "entity_id": "FgDfgeDptvvfdX+L",
        "id": "1001",
        "name": "admin"
    }
}
Someone Used a Linux Cat Command on a Password File
This log was generated by the auditd module. As you can see from the process.title field, and file.path fields, someone used the Linux Cat command on the password file. The user executing the command can be found under the actor structure, radu with su/sudu command (this is the reason for the secondary value of root).
{
  "@timestamp": "2018-03-30T12:36:07.710Z",
  "user": {
    "sgid": "0",
    "fsuid": "0",
    "gid": "0",
    "name_map": {
      "egid": "root",
      "sgid": "root",
      "suid": "root",
      "uid": "root",
      "auid": "radu",
      "fsgid": "root",
      "fsuid": "root",
      "gid": "root",
      "euid": "root"
    },
    "fsgid": "0",
    "uid": "0",
    "egid": "0",
    "auid": "1000",
    "suid": "0",
    "euid": "0"
  },
  "process": {
    "ppid": "2906",
    "title": "cat /etc/passwd",
    "name": "cat",
    "exe": "/bin/cat",
    "cwd": "/root",
    "pid": "5373"
  },
  "file": {
    "device": "00:00",
    "inode": "3147443",
    "mode": "0644",
    "owner": "root",
    "path": "/etc/passwd",
    "uid": "0",
    "gid": "0",
    "group": "root"
  },
  "beat": {
    "version": "6.2.3",
    "name": "radu-laptop",
    "hostname": "radu-laptop"
  },
  "tags": [
    "passwd"
  ],
  "auditd": {
    "summary": {
      "actor": {
        "primary": "radu",
        "secondary": "root"
      },
      "object": {
        "primary": "/etc/passwd",
        "type": "file"
      },
      "how": "/bin/cat"
    },
    "paths": [
      {
        "dev": "08:01",
        "nametype": "NORMAL",
        "rdev": "00:00",
        "inode": "3147443",
        "item": "0",
        "mode": "0100644",
        "name": "/etc/passwd",
        "ogid": "0",
        "ouid": "0"
      }
    ],
    "sequence": 3029,
    "result": "success",
    "session": "1",
    "data": {
      "a0": "7ffea3df0793",
      "tty": "pts4",
      "a3": "7ffea3dee890",
      "syscall": "open",
      "a1": "0",
      "exit": "3",
      "arch": "x86_64",
      "a2": "1fffffffffff0000"
    }
  },
  "event": {
    "category": "audit-rule",
    "type": "syscall",
    "action": "opened-file",
    "module": "auditd"
  }
}
Alerts
The remainder of this blog will focus on useful alerts that leverage logs shipped through Auditbeat.
Because of the variety of Auditbeat configurations for different environments, your logs may look different and contain different keys. Our intention with this article is to use examples that highlight the wealth of information that exists for Auditbeat logs and how they can be leveraged. Each environment is different both in infrastructure and challenges, so adaptation is expected.
Unauthorized Password File Operation
It goes without saying that security organizations would like to know if a password file was touched by an unauthorized user. In this case, the admin is the only user to access it.
Alert Filter: object.primary: “/etc/passwd” AND NOT auditd.summary.actor.primary:admin
Alert Condition: ‘notify immediately’
The key auditd indicates that the log was generated on a Linux machine. Other OS’s will have a similar log structure but slightly different names.
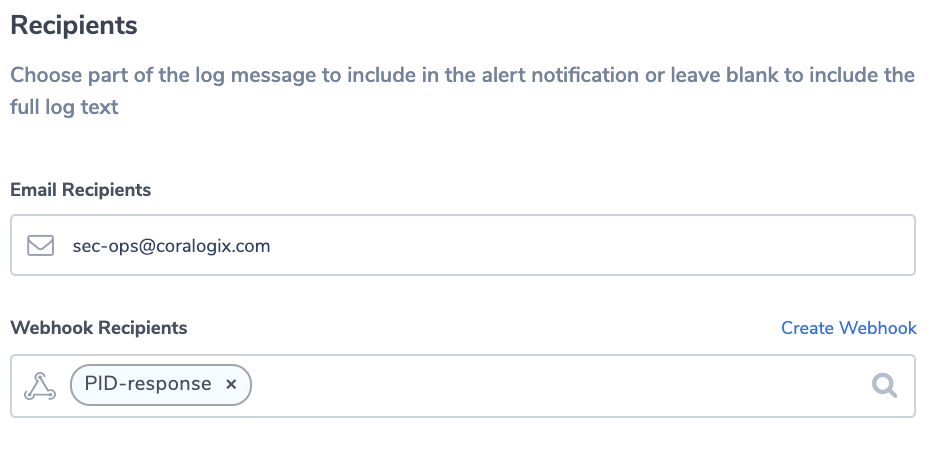
These logs are long, so we configure the notification to include only relevant fields.


User Was Added to a Privileged Group
This alert notifies if a user was added to a specific Linux/Unix group that might have special access privileges.
Alert Filter: event.action:”user_added” AND system.audit.user.gid:1005
Alert Condition: ‘notify immediately’


Too Many Unsuccessful Logins
Many times the security team would like to know if there were too many unsuccessful logins in a time period. ‘Too many’ sounds like an ambiguous term that will be hard to quantify. Coralogix makes it easier. Its ML algorithm can find what is normal for a certain time period and you can simply ask to be alerted if the number of events is more than usual and above a threshold you can set.
Alert Filter: event.action:”user_login” NOT event.outcome:success
Alert Condition: ‘more than usual’


Process Stopped Unexpectedly
System cyber defenses often rely on specific applications and processes. The following alert notifies users if a critical process was stopped. It can happen unintentionally or can indicate an attack.
Alert Filter: process.name:zsec AND event.action:“process_stopped” NOT user.name:adminsec
Alert Condition: ‘notify immediately’


Process ID Mismatch
Another variation or addition to the previous alert can be to compare the process ID to an expected process ID and alert if it changes. A script can query the process ‘sec’ ID regularly and if the process ID is different than expected, an alert will be triggered.
Alert Filter: process.name:zsec AND process.pid:1234
Alert Condition: ‘notify immediately’
In order to deal with pid changes when systems are booting up or added, you can use the Coralogix alerts API to change the alert dynamically. Using the Coralogix custom webhook mechanism, an automated action can be triggered in response to a triggered alert.


Application Dependency Alert
Until now we used event logs that are generated as a result of changes or actions done to the system. This example uses a state type of log, i.e. a periodic snapshot. This alert will trigger if there is a change to the version of a component the application or application security depends on. This alert relies on the system package dataset.
Alert Filter: system.audit.package.name:zsec NOT system.audit.package.version:”1.3.5”
Alert Condition: ‘notify immediately’
Similar To the previous alert, an automated configuration tool could activate a script that uses the Coralogix alerts API to dynamically update the alert configuration with updated version numbers when an upgrade is performed.


Watchdog Alert
This example describes the implementation of a watchdog alert, indicating a malfunction. In this case, the criteria will be the lack of a state system host log. The alert is using ‘the ‘less than’ condition in Coralogix alerts. We rely on the Elasticsearch system host dataset. For the purpose of the example, we will assume that the system host log is sent every 8 minutes. We are using the event.action key to make sure we are using the correct log.
We use 10 minutes as the alert time window to accommodate delays and inaccuracies in generating the watchdog log. You might need to tune it for your system.
Alert Filter: event.action:host AND system.audit.host.hostname:”sec-server”
Alert Condition: ‘less than 1 in 10 minutes’


Outbound Traffic to a Restricted Address
In this example, we use the system socket dataset to identify a server reaching out to a restricted IP address. For the purpose of this example, we assume that permitted addresses are all under the subnet 172.xxx.xxx.xxx.
Alert Filter: event.action:”network_flow” NOT destination.ip:/172.[0-9]{1,3},[0-9]{1,3},[0-9]{1,3}/
Alert Condition: ‘notify immediately’


This blog post explained what are Beats (in logs’ context 🙂 and focused on Auditbeat. It showed examples of Auditbeat’s logs and their structure. We also created some alerts that can help unlock the value of these logs. The universe of Auditbeat’s logs is vast. There are different modules and environments, and not all of them were covered here. Your logs might look different, but the concepts and methods we showed are universal. Adapt them to your own needs. If you need help or have any questions, don’t hesitate and reach out to [email protected]. You can learn more about unlocking the value embedded in AWS and other logs in some of our other blog posts.


