Where is Your Next Release Bottleneck?


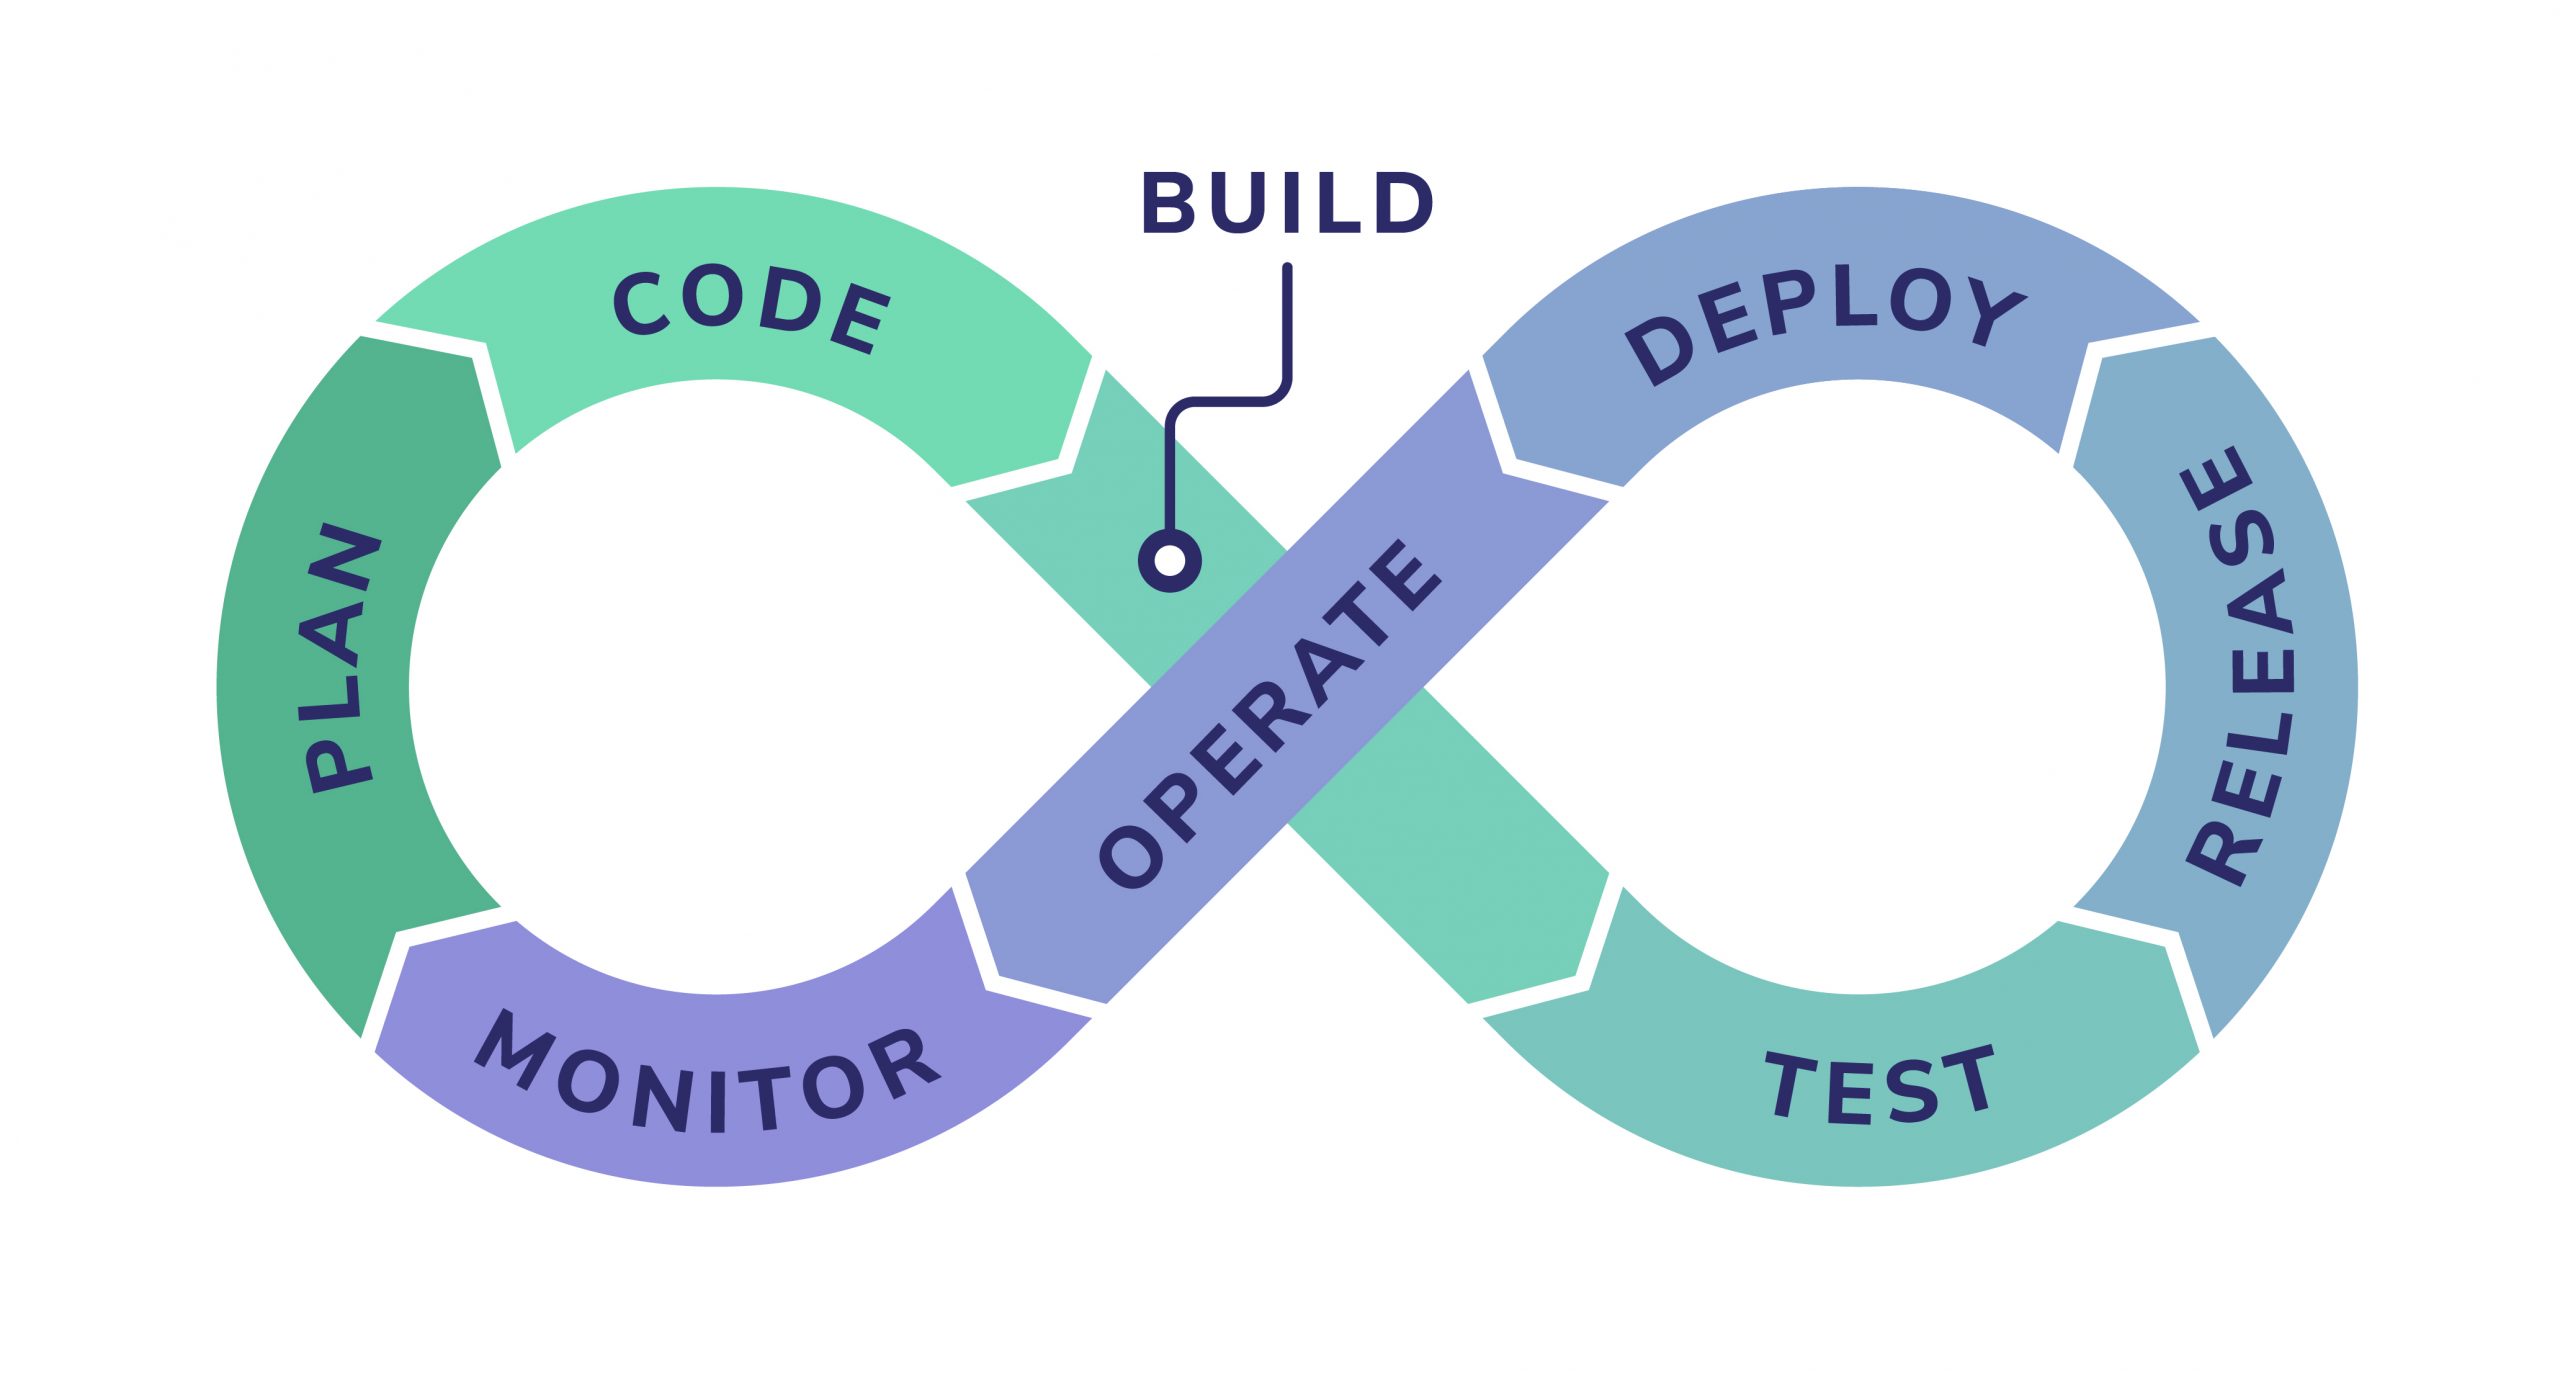
A typical modern DevOps pipeline includes eight major stages, and unfortunately, a release bottleneck can appear at any point:
These may slow down productivity and limit a company’s ability to progress. This could damage their reputation, especially if a bug fix needs to be immediately deployed into production.
This article will cover three key ways using data gathered from your DevOps pipeline can help you find and alleviate bottlenecks in your DevOps pipeline.
1. Increasing the velocity of your team
To improve velocity in DevOps, it’s important to understand the end-to-end application delivery lifecycle to map the time and effort in each phase. This mapping is performed using the data pulled directly and continuously from the tools and systems in the delivery lifecycle. It helps detect and eliminate bottlenecks and ‘waste’ in the overall system.
Teams gather data and metrics from build, configuration, deployment and release tools. This data can contain information such as release details, duration of each phase, whether the phase is successful and more. However, none of these tools paint the whole picture.
By analyzing and monitoring this data in aggregate, DevOps teams benefit from an actionable view of the end-to-end application delivery value stream, both in real-time and historically. This data can be used to streamline or eliminate the bottlenecks that are slowing the next release down and also enable continuous improvement in delivery cycle time.
2. Improving the quality of your code
Analyzing data from the testing performed for a release, enables the DevOps teams to see all the quality issues in new releases and remediate them before implementing into production. Ideally preventing post-implementation fixes.
In modern DevOps environments, most (if not all) of the testing process is achieved with automated testing tools. Different tools are usually used for ‘white box’ testing versus ‘black box’ testing. While the former aims to cover code security, dependencies, comments, policy, quality, and compliance testing, the latter covers functionality, regression, performance, resilience, penetration testing, and meta-analysis like code coverage and test duration.
Again, none of these tools paints the whole picture, but analyzing the aggregate data enables DevOps teams to make faster and better decisions about overall application quality, even across multiple QA teams and tools. This data can even be fed into further automation. For example:
- Notify the development team of failing code which breaks the latest build.
- Send a new code review notification to a different developer or team.
- Push the fix forward into UAT/pre-prod.
- Implement the fix into production.
There are some great static analysis tools that can be integrated into the developers’ pipeline to validate the quality, security, and unit test coverage of the code before it even gets to the testers.
This ability to ‘shift left’ to the Test stage in the DevOps loop (to find and prevent defects early) enables rapid go/no-go decisions based on real-world data. It also dramatically improves the quality of the code that is implemented into production, by ensuring failing or poor quality code is fixed or improved. Therefore reducing ‘defect’ bottlenecks in the codebase.
3. Focusing in on your market
Data analytics from real-world customer experience enables DevOps teams to reliably connect application delivery with business goals. It is critical to connect technology and application delivery with business data. While technical teams need data on timings like website page rendering speeds, the business needs data on the impact of new releases.
This includes metrics like new users / closed accounts, completed sales/items stuck in the shopping cart and income. No single source provides a complete view of this data, as it’s isolated across multiple applications, middleware, web servers, mobile devices, APIs, and more.
Fail Fast, Fail Small, Fail Cheap!
Analyzing and monitoring the aggregate data to generate business-relevant impact metrics enables DevOps teams to:
- Innovate in increments
- Try new things
- Inspect the results
- Compare with business goals
- Iterate quickly
Blocking low-quality releases can ultimately help contain several bottlenecks that are likely to crop up further along in the pipeline. This is the key behind ‘fail fast, fail small, fail cheap’, a core principle behind successful innovation.
Bottlenecks can appear in a release pipeline. Individually, many different tools all paint part of the release picture. But only by analyzing and monitoring data from all these tools can you see a full end-to-end, data-driven approach that can assist in eliminating bottlenecks. This can improve the overall effectiveness of DevOps teams by enabling increased velocity, improved code quality and increased business impact.