Why Do You Need Smarter Alerts?

The way organizations process logs have changed over the past decade. From random files, scattered amongst a handful of virtual machines, to JSON documents effortlessly streamed into platforms. Metrics, too, have seen great strides, as providers expose detailed measurements of every aspect of their system. Traces, too, have become increasingly sophisticated and can now highlight even the most precise details about interactions between our services.
But alerts have remained stationary. The same sorts of alerts, triggered by static thresholds, focused around single components, or siloed into a single data type, have been employed by companies for decades. Now, Coralogix is offering an alternative.
What is the danger of simple alerts?
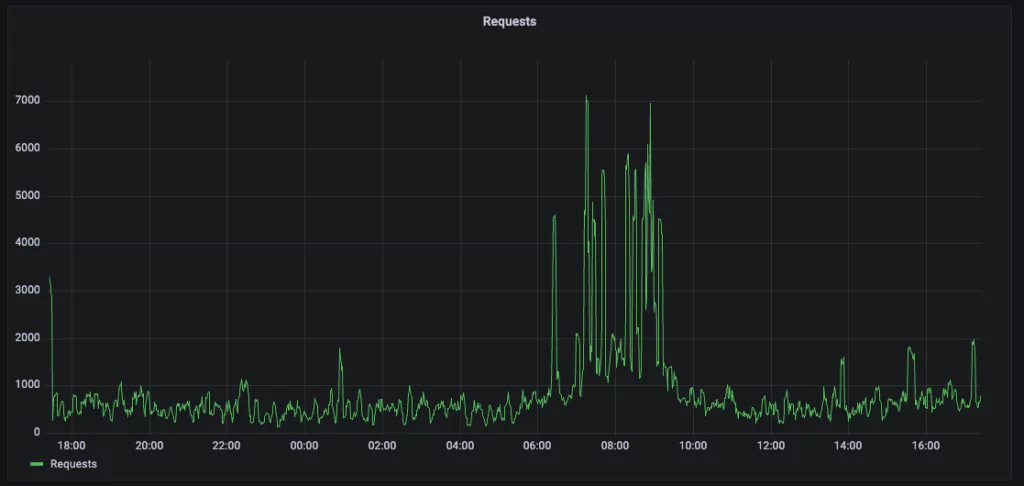
Basic alerts work for basic use cases. Let’s take a look at a simple load graph to illustrate:

As we can see, traffic is relatively stable, except between 06:00 and 10:00. This is the peak time for this service. The network load varies throughout the day, so teams can’t use a basic error count, for example, “more than 30 errors a second,” since 30 errors a second might be too high for quiet times and too low for busy times.
Instead, engineers might use a percentage. Let’s say no more than 1% of errors at any time. That way, a company can tolerate some margin for error while alerting when the alert rate increases. However, 1% of errors at 4 AM means about 2 errors per second. 1% of errors at 9 AM could mean 70 errors a second. In the quest for a static threshold, engineers regularly are forced to hide a great deal of data.
This is the problem with static, simple alerts
Simple alerts are a powerful part of your observability toolkit, but a strategy that only utilizes these static alerts is destined to miss out on two critical perspectives.
1 – “Normal” is not a static threshold
With a simple alerting strategy, you cannot say “anything that isn’t normal” because “normal” is not a static threshold. It’s a calculated value based on your product’s constantly shifting historical performance. Simple alerts struggle with this question because it isn’t a percentage or a basic value you’re looking for – it’s a deviation from a trend. This is more difficult to track with basic alerting.
2 – Your simple alerts will only tell you what you already know
When an engineer defines a static alert, it can only ever tell that engineer what they already know. For example, an engineer might know that a CPU spike between 6 AM and 7 AM shouldn’t happen, so they define an alert for it. Likewise, the memory of the Database should never exceed 95%, so they create an alert for that too. These are called “known knowns.”

The assumption, implicit in a simple alerting strategy, is that everything engineers need to be alerted on is a “known known.” For anyone experienced enough in operating distributed software systems, as most systems now are, this is clearly a false statement. Unexpected unknowns arise constantly. This means that simple alerting strategies are fraught with blind spots.
So how do companies take their alerting to the next level?
The only way that alerting will take its next leap forward is if the industry first answers these two problems. How do we alert without a fixed threshold, and how do we detect the “unknown unknowns?” The answer is clear: our alerts need to become smarter.
Smart alerts can detect if some data point is not typical. For example, if a company is happy to experience an error rate of 1% at 2 AM and 10% at 11 AM, they don’t want to be told every single time this happens, but they do want to be notified when the error rate exceeds 12% at 11 AM. This kind of complex reasoning is not easily accomplished with simple alerts.
Likewise, companies can not afford to assume that they have set up a perfect network of simple alerts that will capture every failure scenario. Those companies need a solution that will tell them about potential failures that they haven’t anticipated ahead of time.
Introducing Coralogix Dynamic Alerts
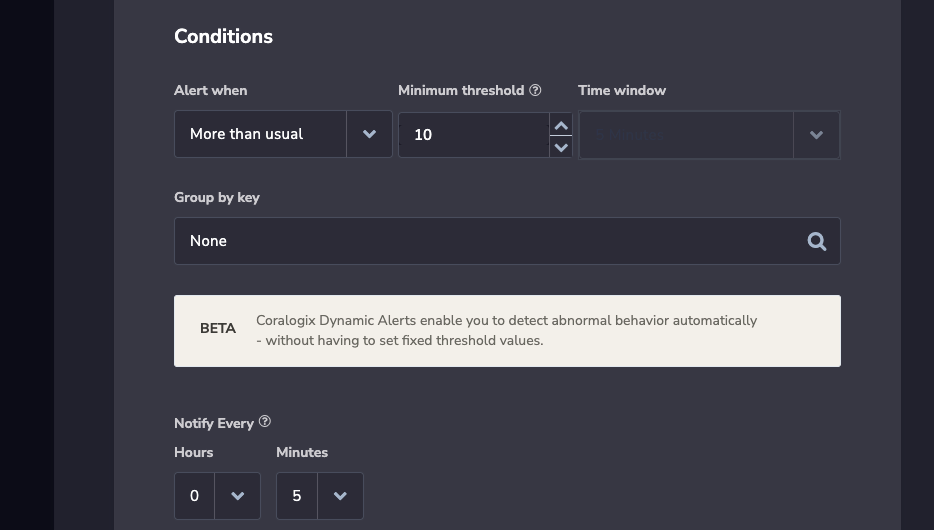
Dynamic alerts are a powerful, machine learning driven feature that will learn the baseline behavior of a system and tell our customers whenever a log or metric deviates from that baseline. This powerful feature allows customers to act on actual incidents in their system without putting up with false positives and alert spam. It detects true abnormalities in your observability data and instantly provides you with actionable insights.


