
10 LLM Observability Tools to Know in 2025

Key Features of LLM Observability Solutions
LLM observability solutions should provide the following capabilities.
Monitoring Model Performance
LLM performance monitoring provides real-time data on response times, latency, and throughput. These metrics help assess if an LLM meets operational requirements and user expectations. For example, monitoring average response time and identifying any latency spikes ensure the model operates within acceptable speed limits, especially under high traffic or diverse input scenarios.
Solutions can also track throughput to determine if server resources and model instances are sufficient to handle user requests. Alerts and dashboards offer visibility into these metrics, enabling teams to detect bottlenecks early and optimize resource allocation to sustain high-performance levels.
Model Health Monitoring
Model health monitoring focuses on maintaining an LLM’s operational soundness and predictive quality over time. This includes detecting changes in accuracy, monitoring for concept drift, and tracking model degradation due to outdated training data. Some observability tools offer automated alerts for retraining when metrics fall below a predefined threshold.
They also monitor data quality and assess potential impacts of environmental changes, such as server updates or API modifications, that might influence the model’s performance. By maintaining a close watch on health metrics, teams ensure LLMs continue to deliver reliable, high-quality outputs.
Debugging and Error Tracking
Debugging and error tracking functions allow for in-depth analysis of model outputs, especially when they deviate from expected behaviors. These features often capture logs of problematic outputs, enabling engineers to trace back the input data or configurations that led to errors or inconsistencies.
Observability tools can detect patterns in errors, such as repeated misunderstandings of certain phrases or topics, helping developers refine prompts, adjust training data, or apply targeted fixes. Debugging and tracking also improve response predictability by highlighting areas where adjustments to the model’s architecture or parameters can address recurrent issues.
Bias and Safety Evaluation
Bias and safety evaluation is critical in ensuring LLMs produce ethical and non-harmful outputs. Observability tools analyze language patterns for harmful content, biased language, or ethically questionable responses, flagging these for further review or automated moderation.
Some solutions apply fairness checks, scanning for biased trends in responses across user demographics or sensitive topics, which can help meet regulatory standards. Bias and safety evaluation features also support ongoing audits of model outputs, helping organizations address issues before they escalate.
Interpretability
Interpretability tools within LLM observability solutions allow developers to understand how models generate outputs by shedding light on internal processing steps. These tools may include visualization of attention weights, token contributions, or word embeddings to clarify which inputs or data points are most influential in the model’s responses.
This transparency supports fine-tuning and debugging efforts, as developers gain insight into why certain outputs are generated. By improving the interpretability of LLMs, teams can also communicate clearer, more trustworthy explanations to end users.
Related content: Read our guide to application performance monitoring
Notable LLM Observability Tools
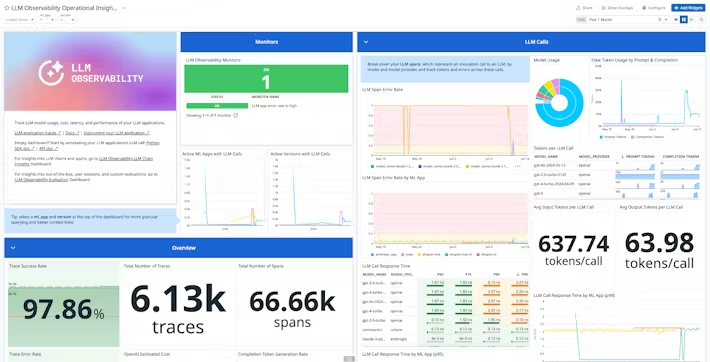
1. Coralogix
Coralogix AI Observability is the first platform to offer AI observability as a distinct product, empowering teams to monitor and optimize LLM applications with ease. Its proactive features deliver live alerts, actionable insights, and root cause analysis for seamless performance and enhanced security.
- Real-time AI observability: Automatically tracks LLM behavior, including errors, token usage, response times, and costs, providing immediate insights without interfering in interactions.
- Span-level tracing: Pinpoints performance bottlenecks with granular visibility into specific spans, enabling developers to quickly identify the source of errors, slowdowns, or other anomalies.
- Custom evaluations and risk detection: Provides specialized tools to detect issues such as prompt injection, hallucinations, and toxicity. Tailor evaluations to focus on critical risks for each project.
- Unified performance and security monitoring: Offers customizable dashboards to track latency, costs, error rates, and security events. Real-time alerts flag suspicious activity, including potential data breaches or compliance violations.
- Proactive anomaly detection: Flags risks early, enabling developers to resolve potential issues before they escalate, ensuring reliability at scale.
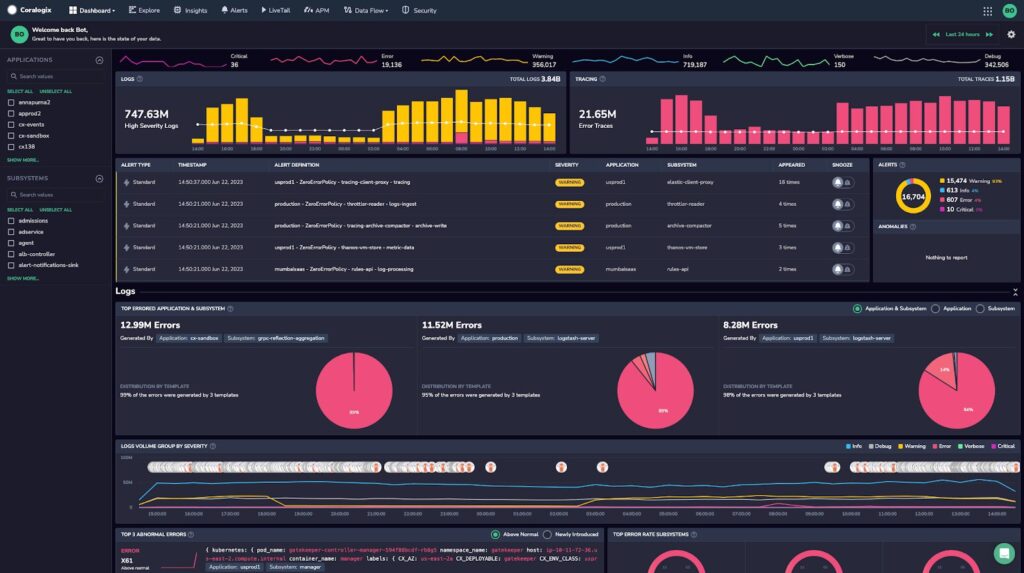
Source: Coralogix
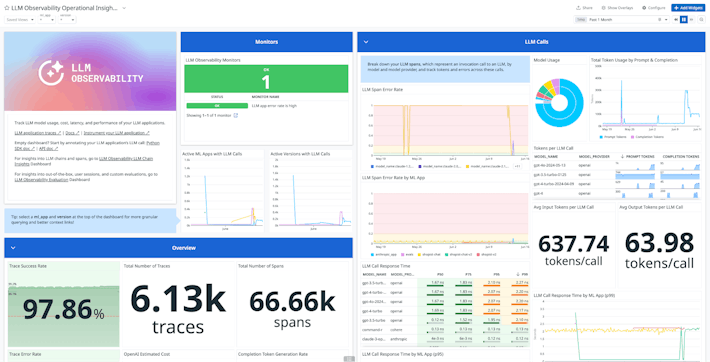
2. Datadog LLM Observability
Datadog LLM Observability is a solution for monitoring, troubleshooting, and securing LLM applications. With end-to-end tracing and evaluation features, it enables teams to pinpoint performance issues, improve response quality, and protect LLM chains from security risks.
License: Commercial
- End-to-end troubleshooting: Provides visibility into each step of the LLM chain, helping developers quickly identify root causes of errors or failed calls. Trace analysis covers inputs, outputs, token usage, and latency.
- Response quality evaluation: Out-of-the-box quality assessments and custom evaluations detect issues like off-topic responses and hallucinations.
- Performance monitoring and cost optimization: Offers a unified dashboard to track essential metrics like cost, latency, and usage. Real-time alerts detect spikes in token usage and latency, and help identify high-cost calls.
- Security and privacy safeguards: Includes built-in scanning for sensitive data to prevent PII, email, and IP leaks, as well as automated detection of prompt injection attempts.
Source: Datadog
3. Langsmith
LangSmith is a platform that supports the entire lifecycle of LLM-powered applications, from development to deployment. Tailored for the challenges of working with LLMs, LangSmith allows teams to debug, monitor, and test LLM applications with deep visibility and precision.
License: MIT
Repo: https://github.com/langchain-ai/langsmith-sdk
GitHub stars: 400+
Contributors: 30+
- Real-time debugging and monitoring: Provides end-to-end visibility of application processes, allowing teams to quickly identify and address issues like errors and performance bottlenecks.
- Traces for collaborative debugging: Offers trace-sharing capabilities, enabling team members, clients, or end users to access and understand model behavior and decision paths easily.
- Prompt Hub for versioning and collaboration: Allows developers and non-engineers alike to create, version, and comment on prompts, fostering better communication and iterative development.
- Annotation queues for feedback: Supports human-in-the-loop feedback by allowing teams to add human labels and annotations to model outputs, improving model accuracy and relevance over time.
- Dataset management: Enables easy construction of datasets from production data or external sources, which can be used for evaluation, few-shot prompting, and fine-tuning.
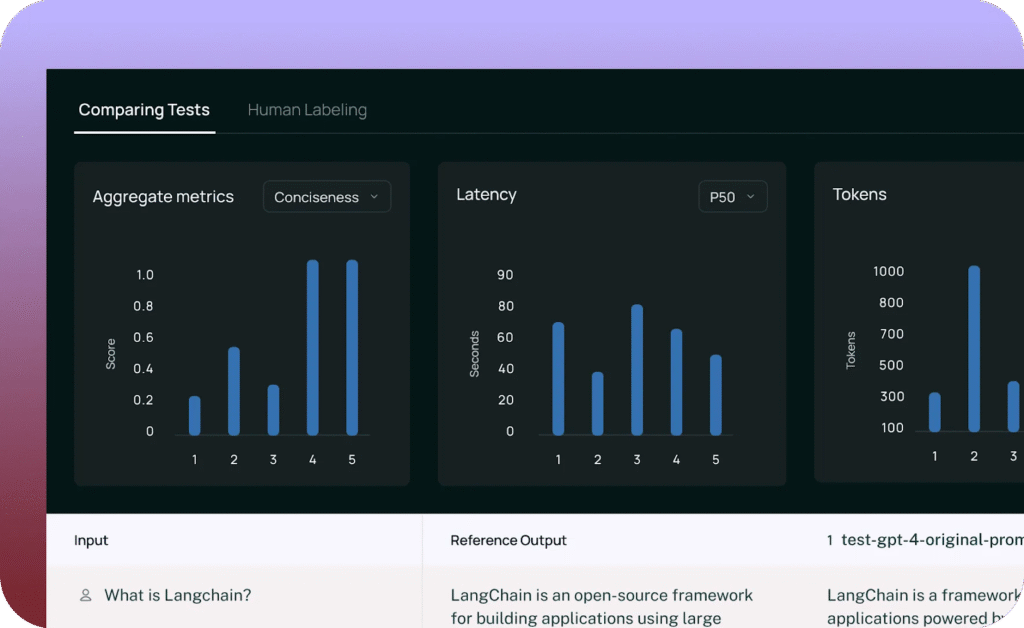
Source: LangSmith
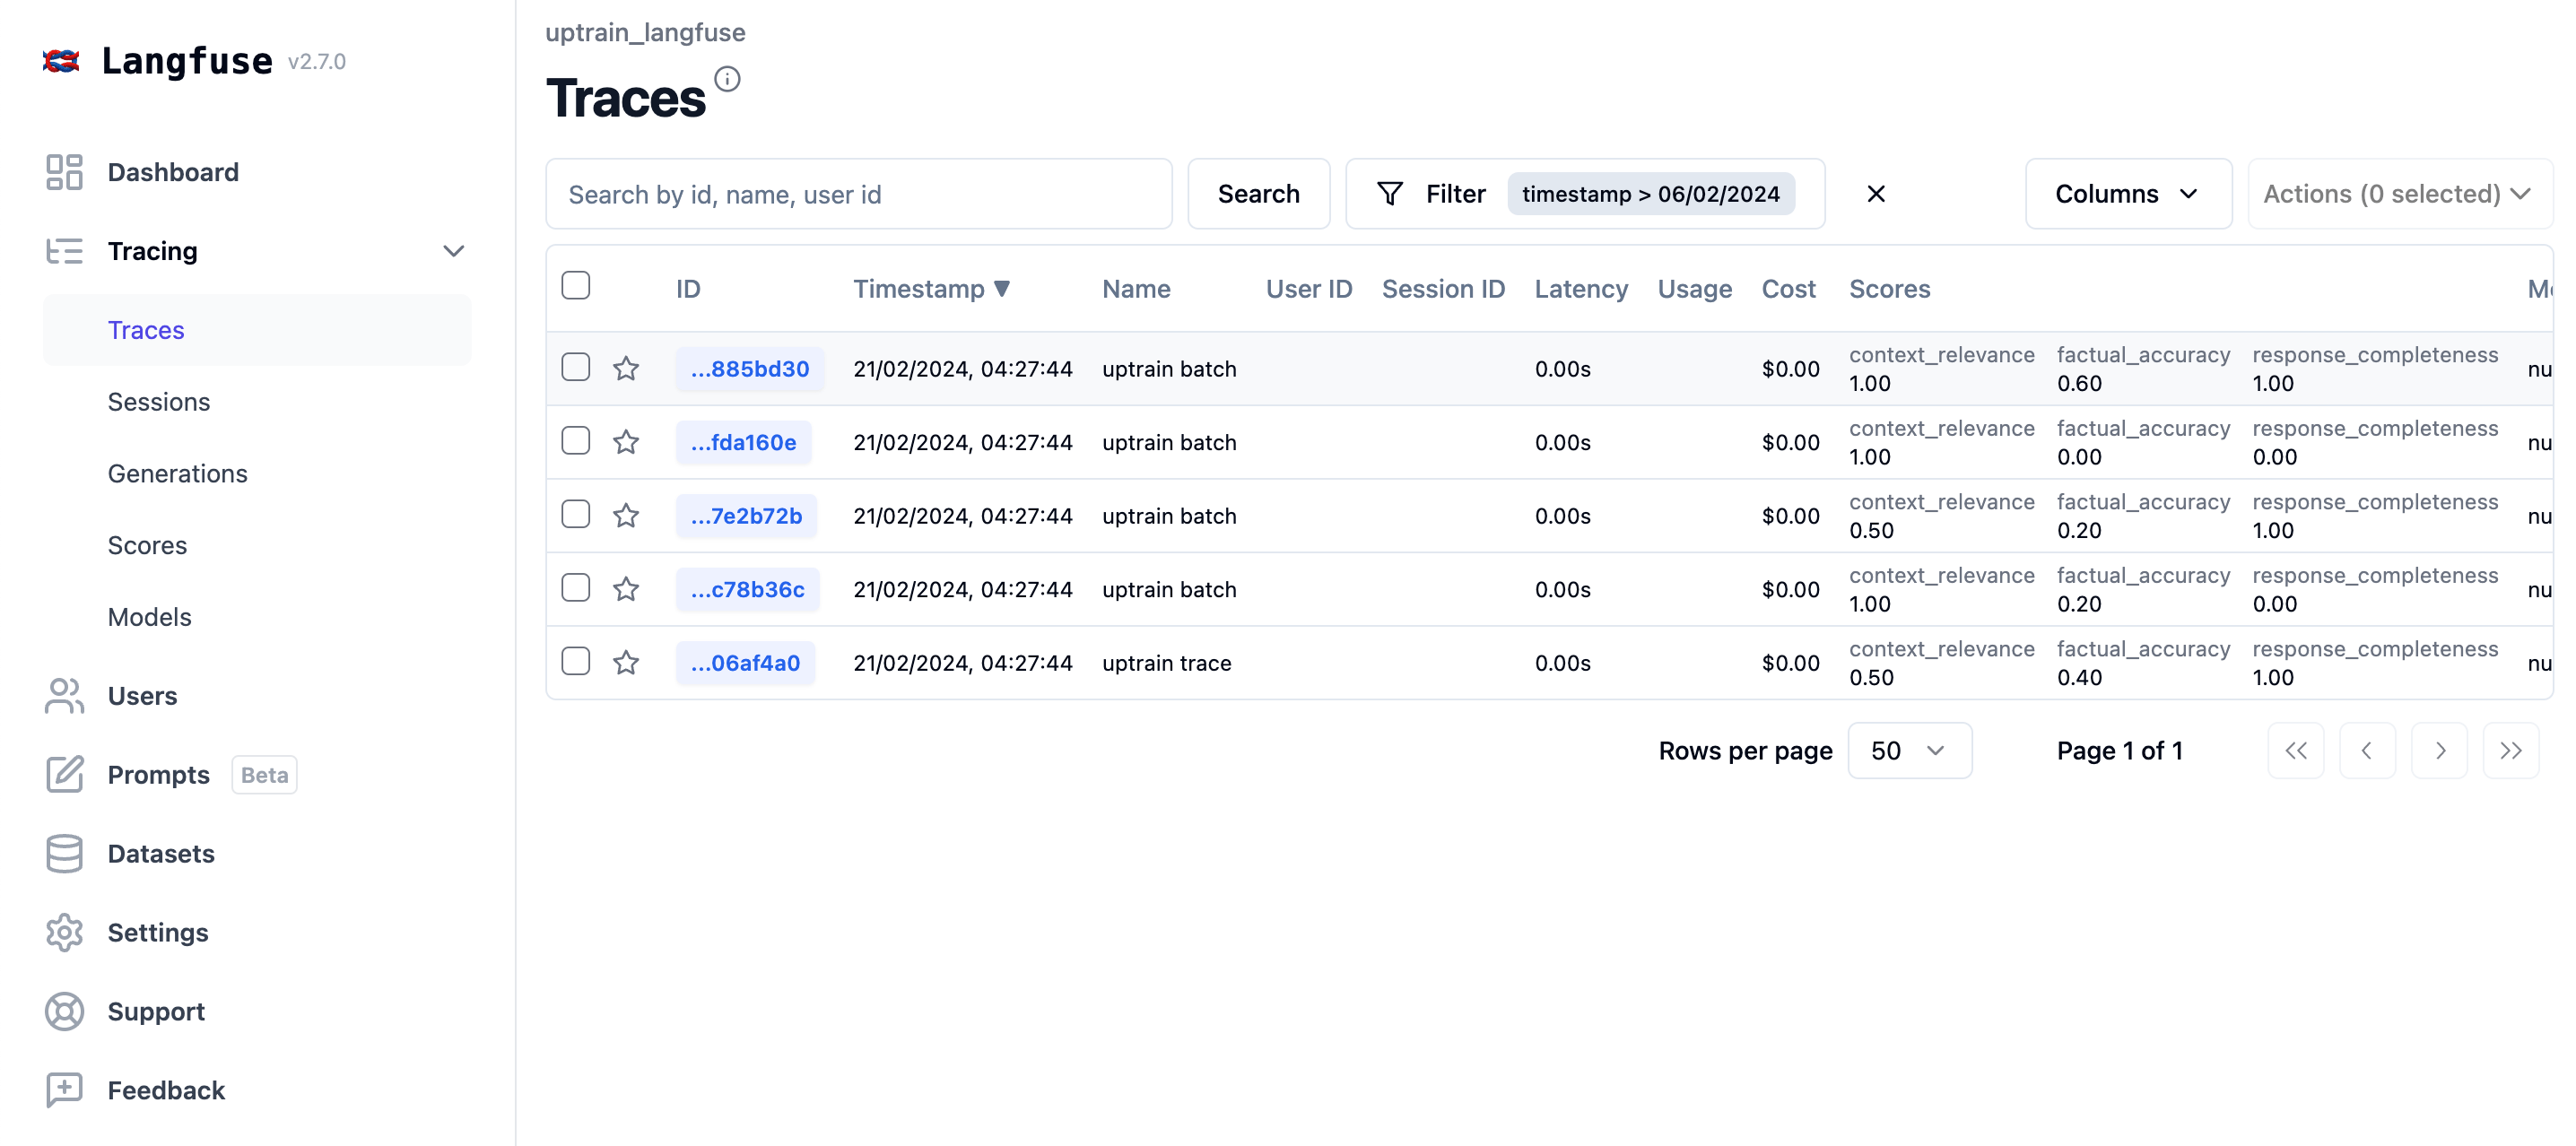
4. Langfuse

Langfuse is an open-source platform for LLM engineering teams to collaboratively debug, analyze, and refine LLM applications. It helps developers monitor application performance, manage prompt workflows, and improve app quality across multiple stages of development.
License: MIT
Repo: https://github.com/langfuse/langfuse
GitHub stars: 6K+
Contributors: 50+
- Complete observability: Tracks all LLM calls and essential application logic through async SDKs in Python and JavaScript, with built-in integrations for OpenAI, LangChain, and LlamaIndex. The platform’s @observe() decorator allows instrumentation, providing real-time insights into application activity.
- Detailed logging and debugging: Enables inspection of complex logs and user sessions, allowing developers to pinpoint issues and analyze model behavior within a single interface.
- Prompt management and testing: Includes tools to manage, version, and deploy prompts, along with an LLM Playground to iteratively test and refine prompt effectiveness.
- Analytics and evaluation: Offers analytics to track metrics such as LLM costs, latency, and output quality. Supports model-based and user-driven evaluations to score LLM completions.
- Experiment tracking and benchmarking: Allows teams to track app versions and conduct pre-deployment testing by benchmarking expected inputs and outputs.
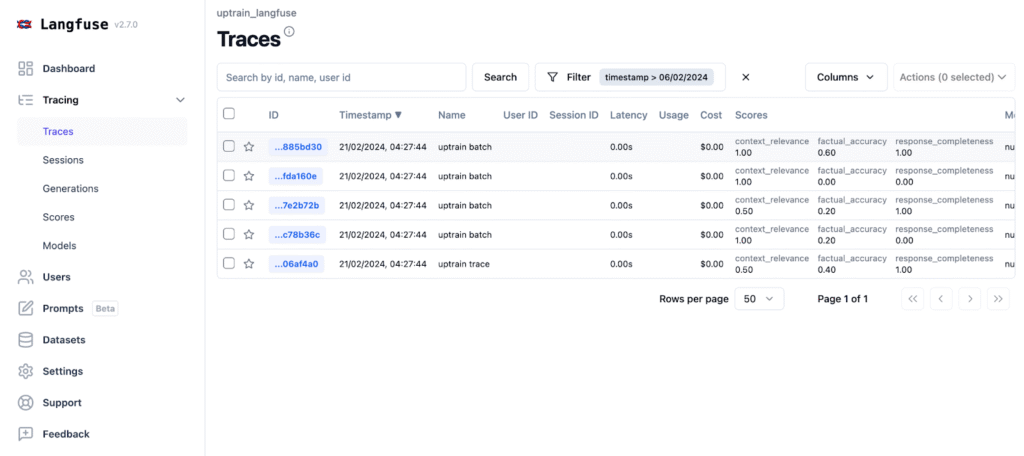
Source: Langfuse
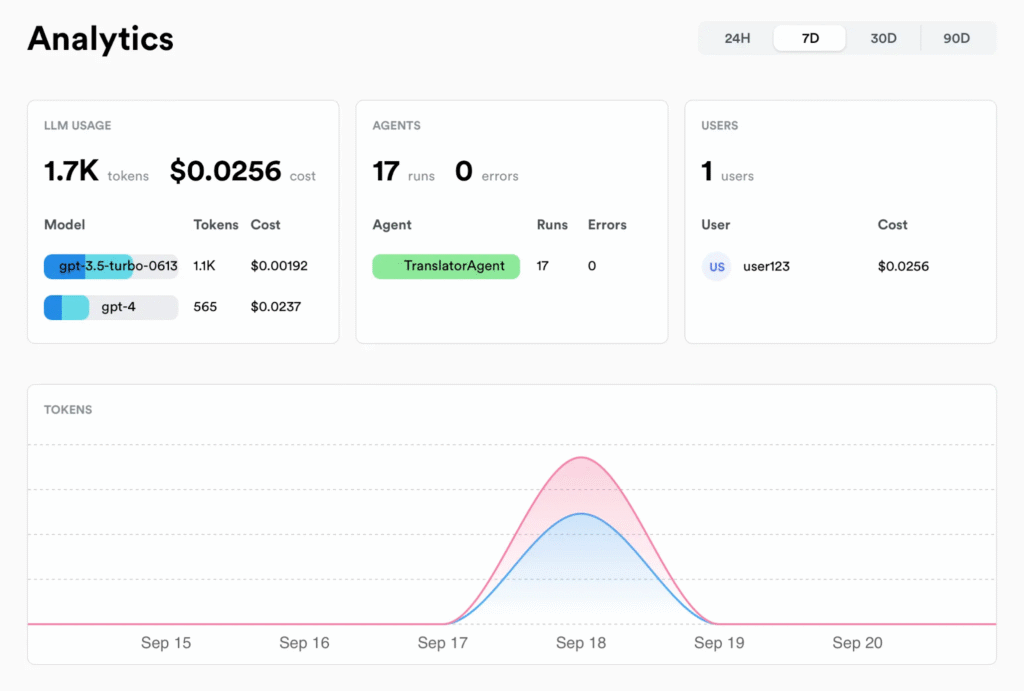
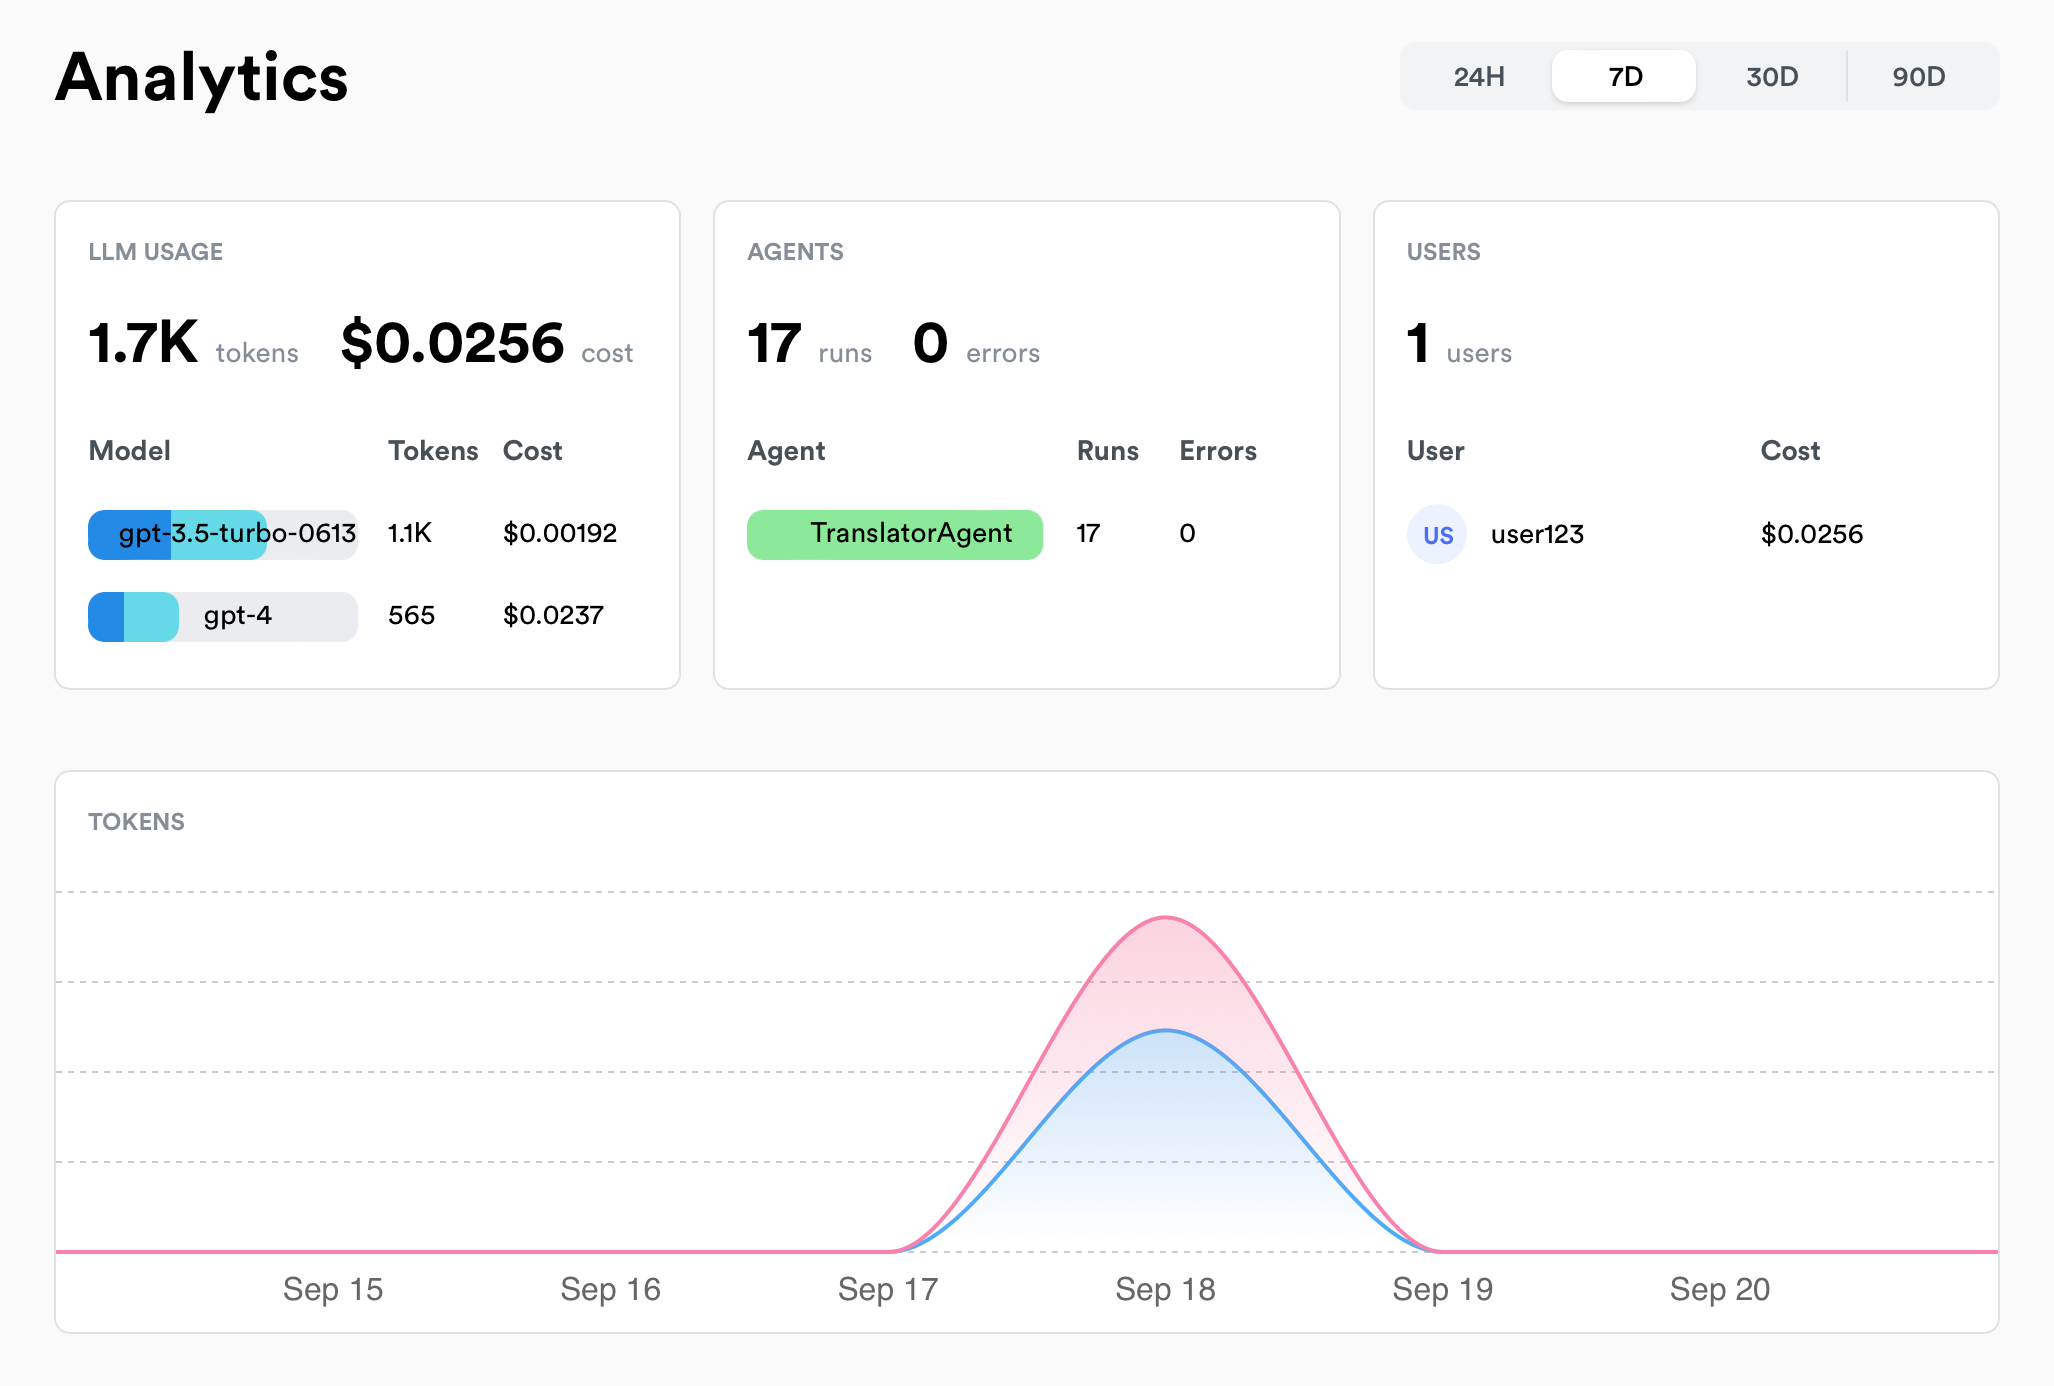
5. Lunary

Lunary is a platform that helps GenAI teams manage, enhance, and secure their LLM-based chatbots. It allows developers to analyze chatbot performance, gain insights into user interactions, and implement safeguards for data protection.
License: Apache-2.0
Repo: https://github.com/lunary-ai/lunary
GitHub stars: 1K+
Contributors: <10
- User interaction replay and analysis: Records user conversations and provides sentiment analysis, allowing developers to review chats and identify knowledge gaps in chatbot responses. Supports feedback collection and topic classification for targeted improvements.
- Integration: Designed for minimal setup, Lunary’s SDKs integrate with any LLM, allowing developers to monitor chatbot activity.
- Enterprise-grade security: Offers SOC 2 Type II and ISO 27001 compliance, LLM firewalls for preventing malicious prompts, PII masking to protect user data, and self-hosted deployment options.
- Real-time analytics and logging: Captures metrics such as usage, latency, costs, errors, and user activity as soon as the SDK is installed. Logs provide in-depth inspection of LLM requests and responses.
- Flexible feedback tracking: Utility wrappers enable automatic tracing of agent behavior, allowing for efficient troubleshooting and refinement of complex chatbot workflows.
Source: Lunary
6. Helicone

Helicone is an open-source observability platform for developers working with LLM applications. It provides tools for logging, monitoring, and debugging, helping teams optimize LLM performance. With support for multiple models and integrations, Helicone enables quick deployment and visibility into model metrics.7. TruLens
License: Apache-2.0
Repo: https://github.com/Helicone/helicone
GitHub stars: 1K+
Contributors: 50+
- Quick integration and cross-platform compatibility: Compatible with leading providers like OpenAI, Azure, Anthropic, and Anyscale. Allows developers to send and monitor events quickly through simple header additions, without requiring an SDK.
- Real-time analytics and cost management: Captures metrics like latency, cost, and time to first token, giving developers insights into operational efficiency and budget impact.
- Prompt management: Offers tools for prompt versioning, testing, and templating, allowing teams to manage and optimize prompt usage across different iterations.
- User and request segmentation: Supports labeling and segmenting requests, enabling analysis of usage patterns and custom properties that improve personalization and performance monitoring.
- Caching and cost optimization: Includes request caching to reduce redundant calls and save on costs.
Source: Helicone
7. TruLens

TruLens is a tool to help developers evaluate and refine their LLM applications through programmatic feedback functions. By objectively measuring output quality, relevance, and safety, TruLens accelerates the evaluation process, enabling rapid iterations and informed decision-making.
License: MIT
Repo: https://github.com/truera/trulens
GitHub stars: 2K+
Contributors: 50+
- Evaluation with feedback functions: Uses feedback functions to evaluate aspects like context relevance, groundedness, answer accuracy, safety, and user sentiment. These functions score LLM outputs based on quality metrics.
- Iterative development: Offers an extensible library of feedback functions that developers can leverage or customize. This enables focused iteration on weak areas by adjusting prompts, model parameters, or configurations.
- Metrics leaderboard: Allows for side-by-side comparison of different LLM versions on a leaderboard, enabling teams to select the best-performing application based on objective metrics.
- Simple integration: Integrates with existing development workflows in a few lines of code. Available via PyPI, the tool is compatible with Python-based LLM applications.
- Scalable programmatic feedback: Provides automated, high-volume feedback in contrast to traditional human evaluation, identifying areas for improvement quickly.
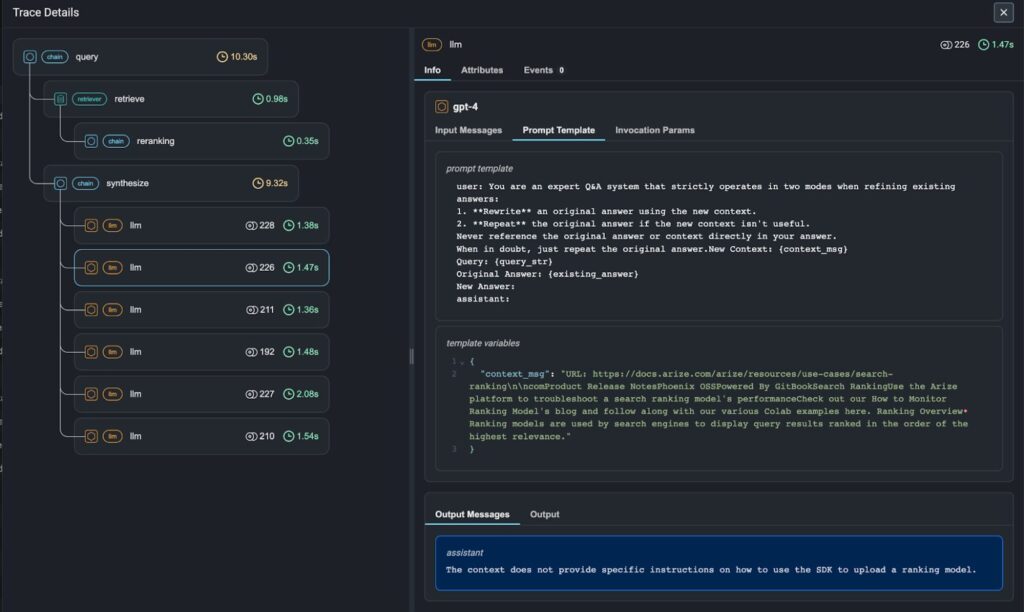
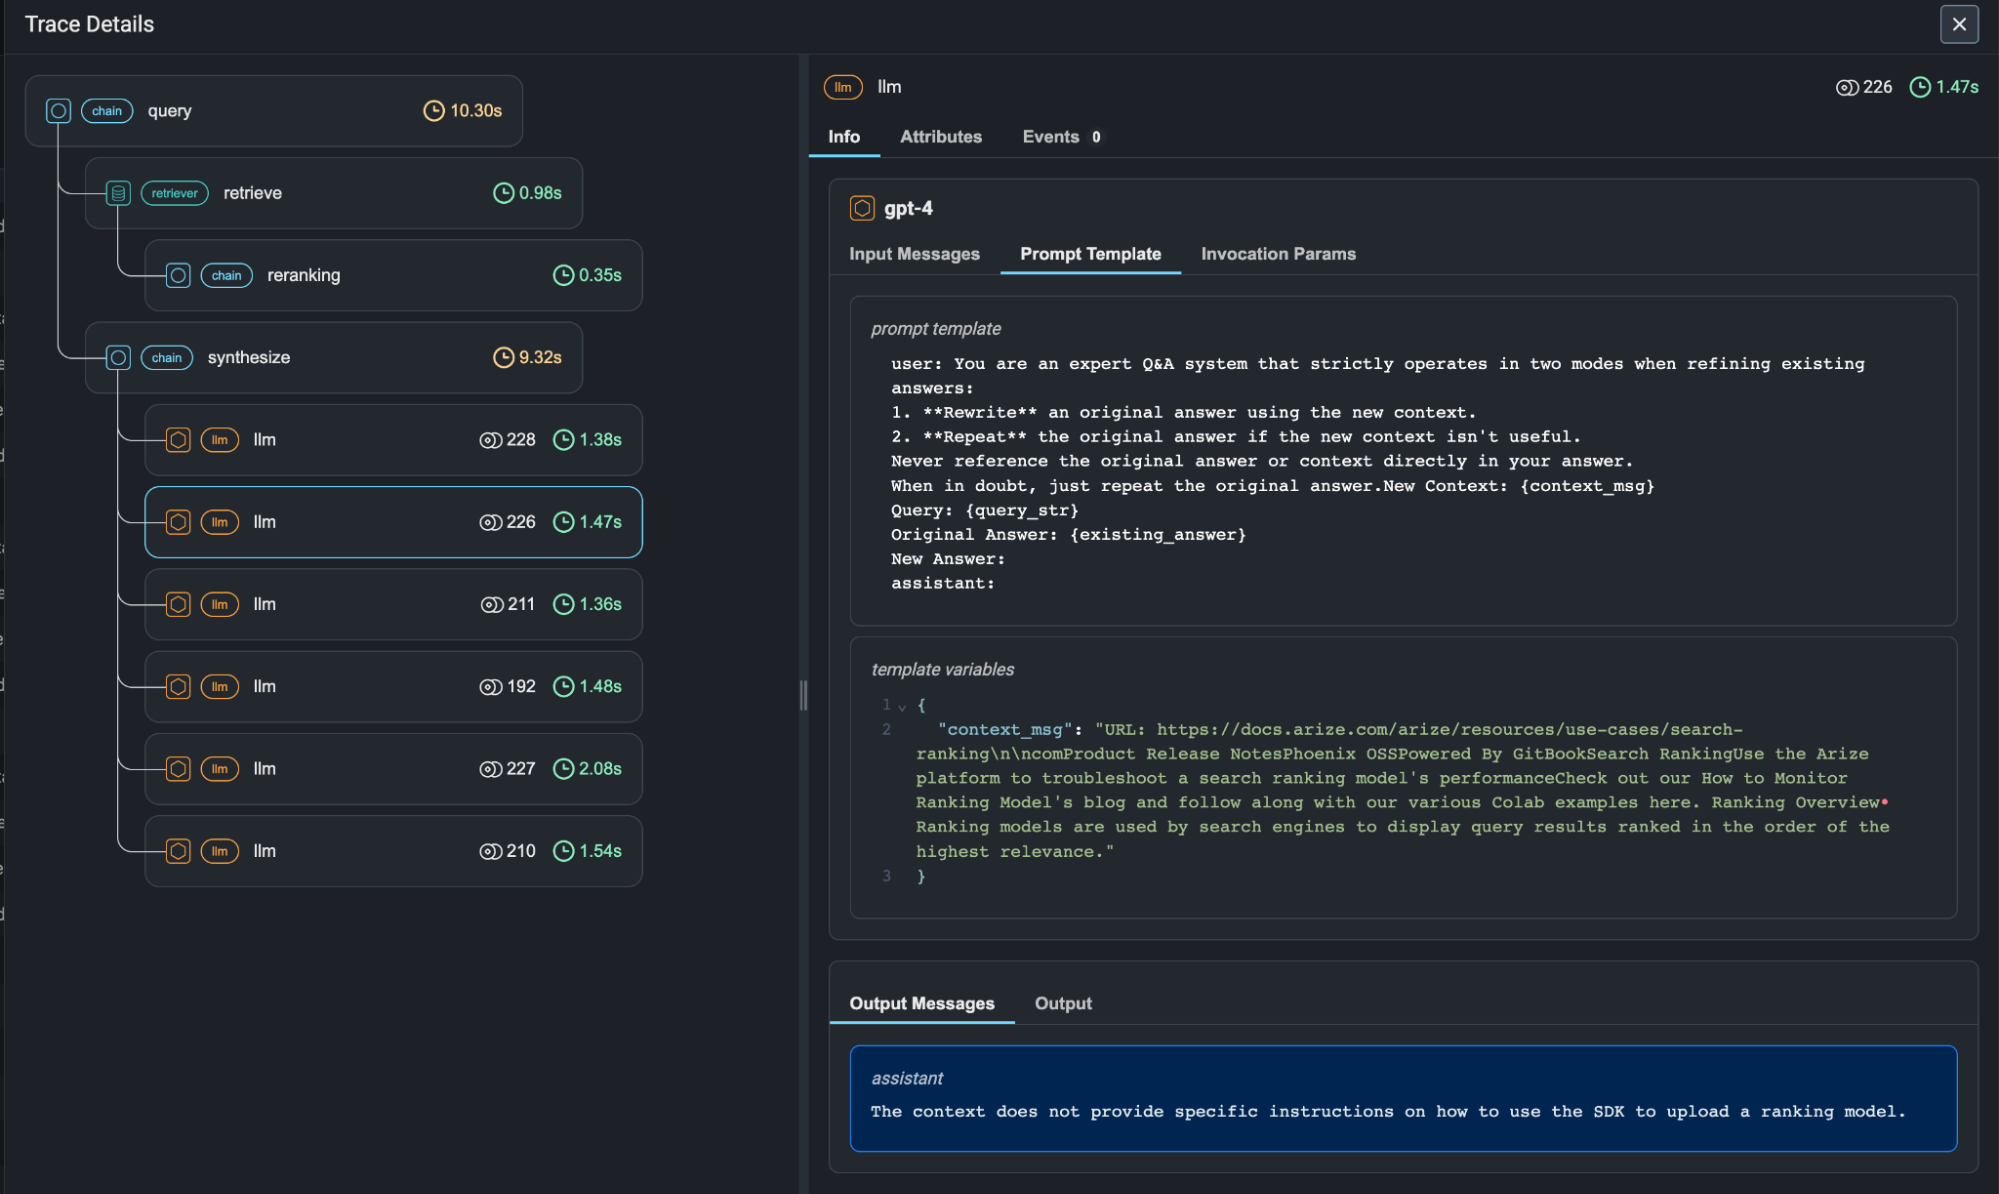
8. Arize Phoenix

Arize Phoenix is an open-source tool that allows developers to trace, evaluate, and enhance generative AI applications. Built on OpenTelemetry, Phoenix provides integration and vendor-agnostic tracing for LLM workflows.
License: ELv2
Repo: https://github.com/Arize-ai/phoenix
GitHub stars: 3K+
Contributors: 60+
- Automated tracing and session monitoring: Offers out-of-the-box tracing capabilities that automatically collect data from user queries, responses, and system performance metrics.
- Simple evaluation framework: Features pre-tested evaluation templates that can be customized for various tasks, enabling quick and accurate assessments of metrics like faithfulness, correctness, and response relevance.
- Dataset creation for prompt testing: Allows developers to save, curate, and manage datasets for prompt iteration and template testing.
- Prompt and variable management: Provides tools to test and iterate on prompt variables, ensuring that adjustments to prompts are thoroughly tested against data sets before deployment.
- Data clustering and benchmarking: Uses embeddings to group semantically similar questions, responses, or content chunks, helping to identify areas of low performance and enabling targeted improvements through retrieval-augmented generation (RAG) analysis.
Source: Arize AI
9. Traceloop OpenLLMetry

Traceloop OpenLLMetry is an extension suite built on OpenTelemetry to provide full observability over LLM applications. Designed to integrate with popular observability tools like Datadog, Honeycomb, and Grafana, OpenLLMetry offers end-to-end monitoring for LLMs, databases, and application frameworks.
License: Apache-2.0
Repo: https://github.com/traceloop/openllmetry
GitHub stars: 3K+
Contributors: 50+
- OpenTelemetry integration: Can connect with existing observability stacks, enabling unified monitoring without disrupting current workflows. If OpenTelemetry is already set up, additional OpenLLMetry instrumentation can be easily added.
- LLM and vector DB instrumentation: Custom-built to capture metrics for LLM providers like OpenAI, Anthropic, and HuggingFace, as well as vector databases like Pinecone, Chroma, and Qdrant.
- SDK for easy setup: The Traceloop SDK simplifies initialization with minimal setup, enabling rapid deployment.
- Wide range of observability destinations: Supports integration with platforms such as Datadog, New Relic, Splunk, and IBM Instana, as well as OpenTelemetry Collector.
- Framework compatibility: Supports popular frameworks for LLM workflows, including LangChain, LlamaIndex, and Haystack.
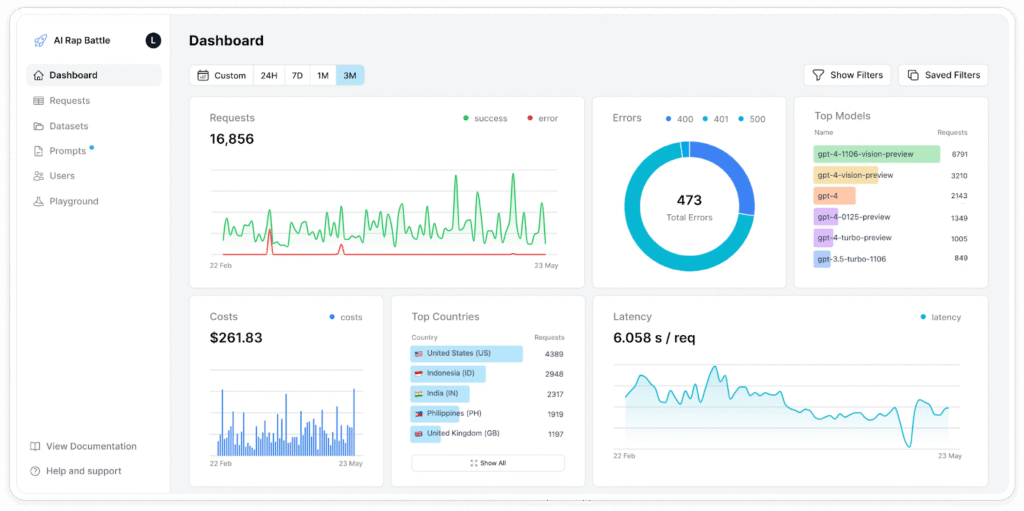
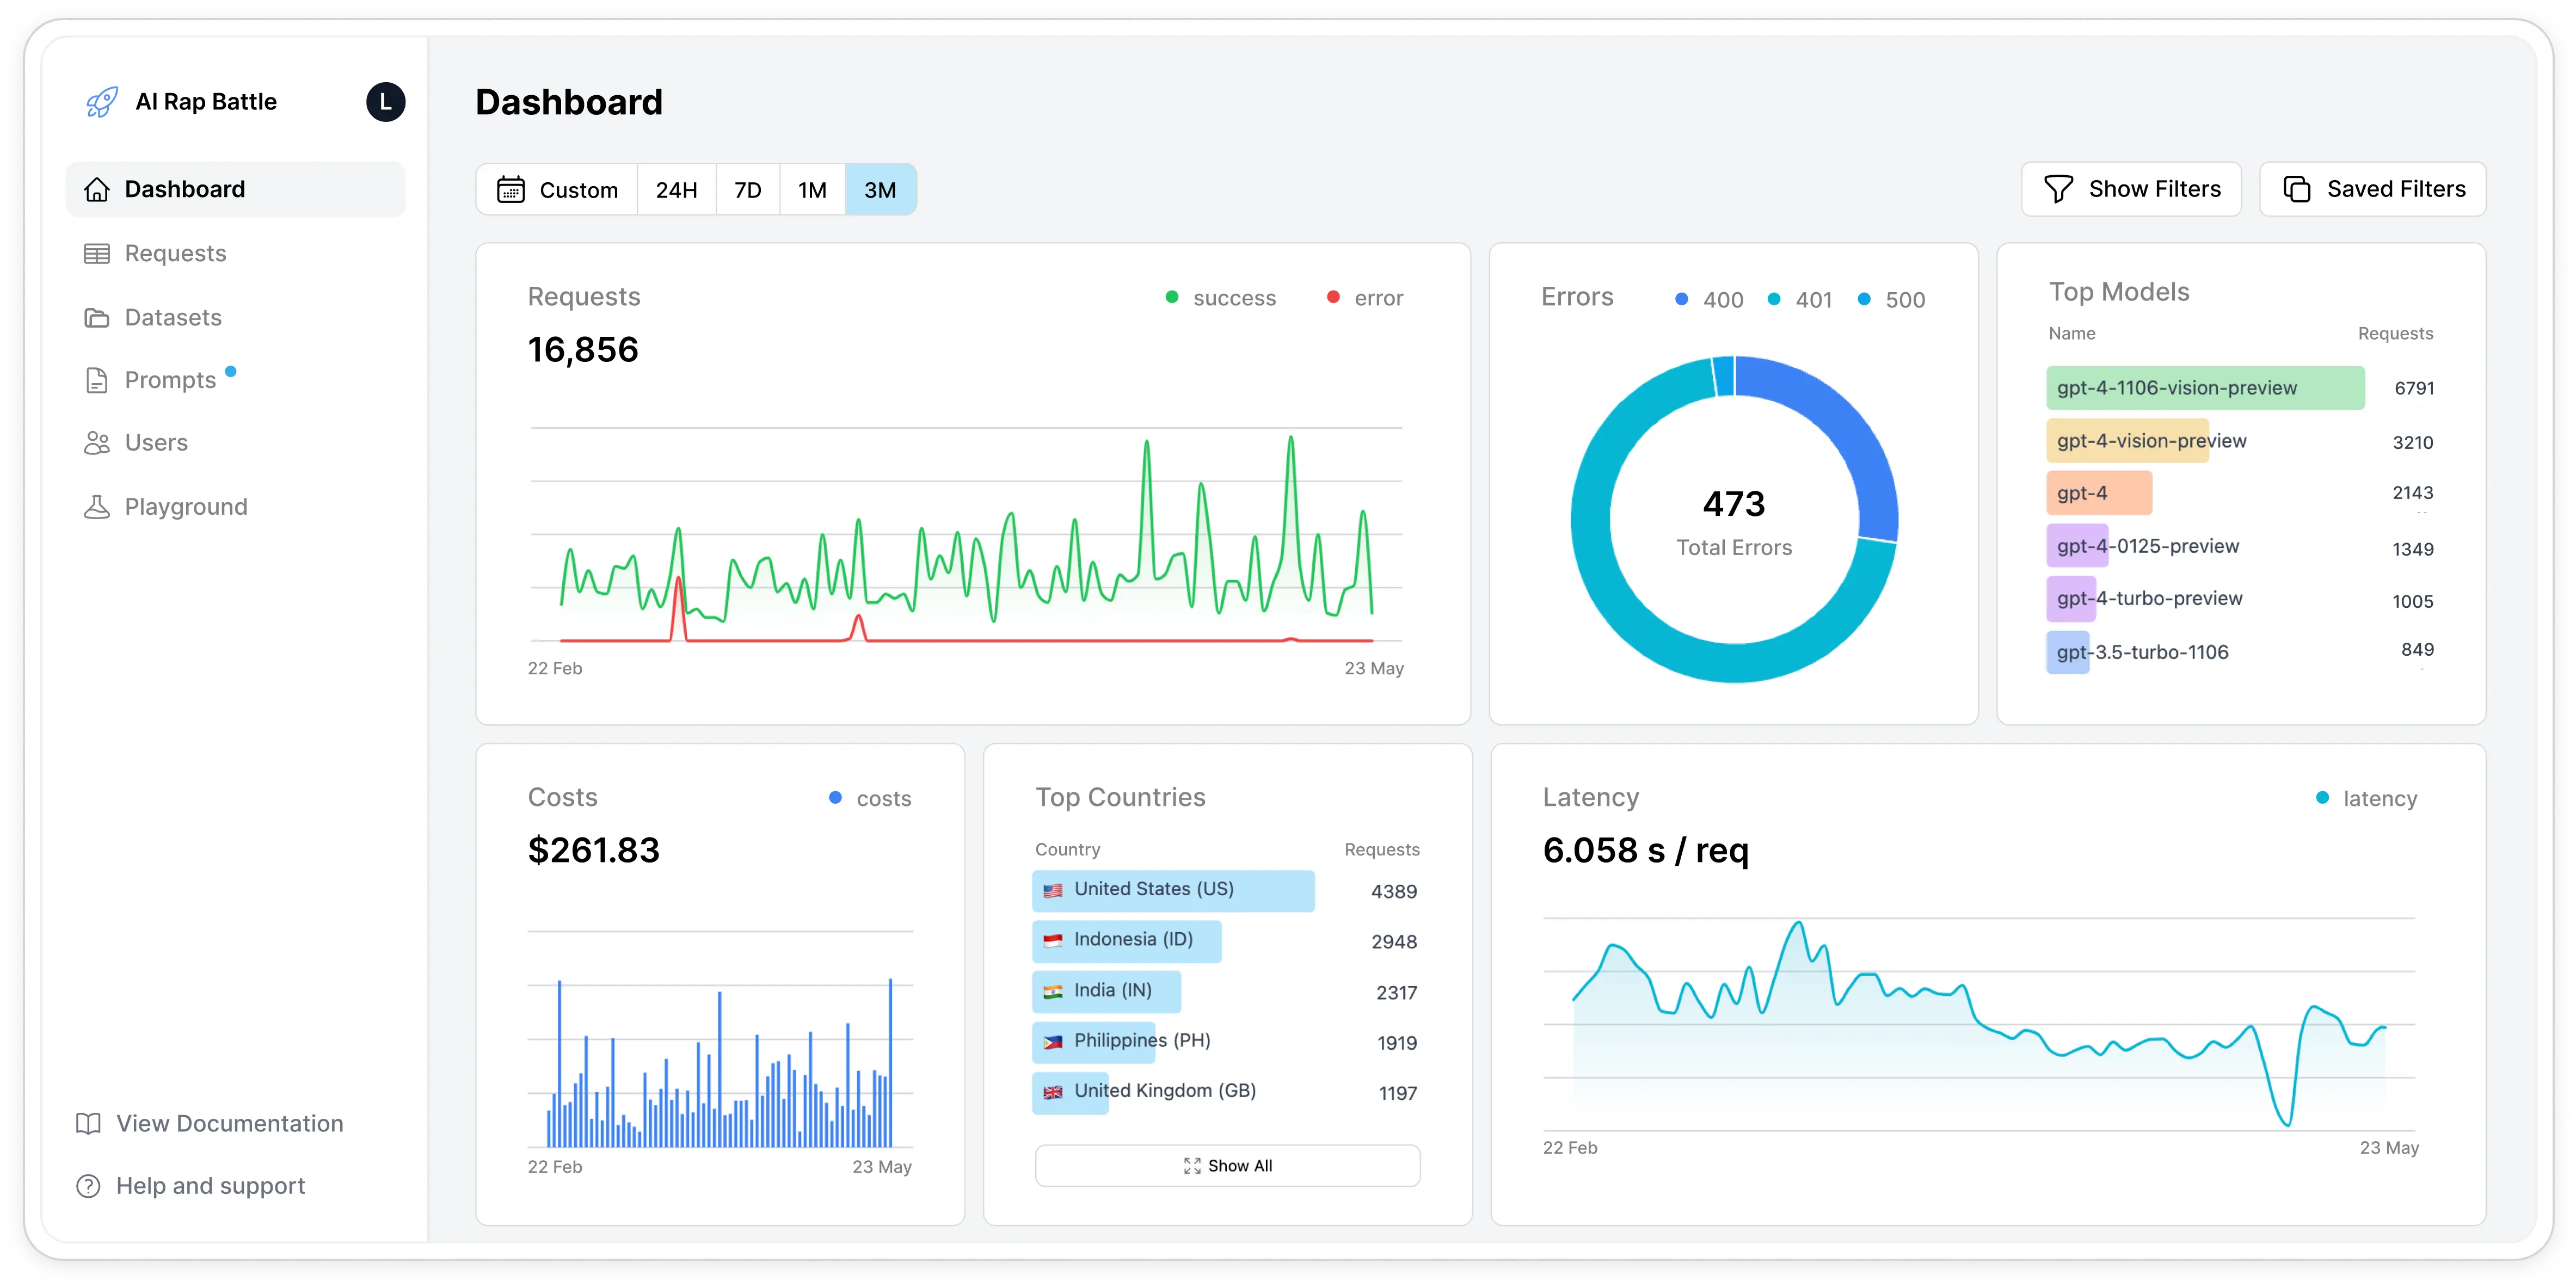
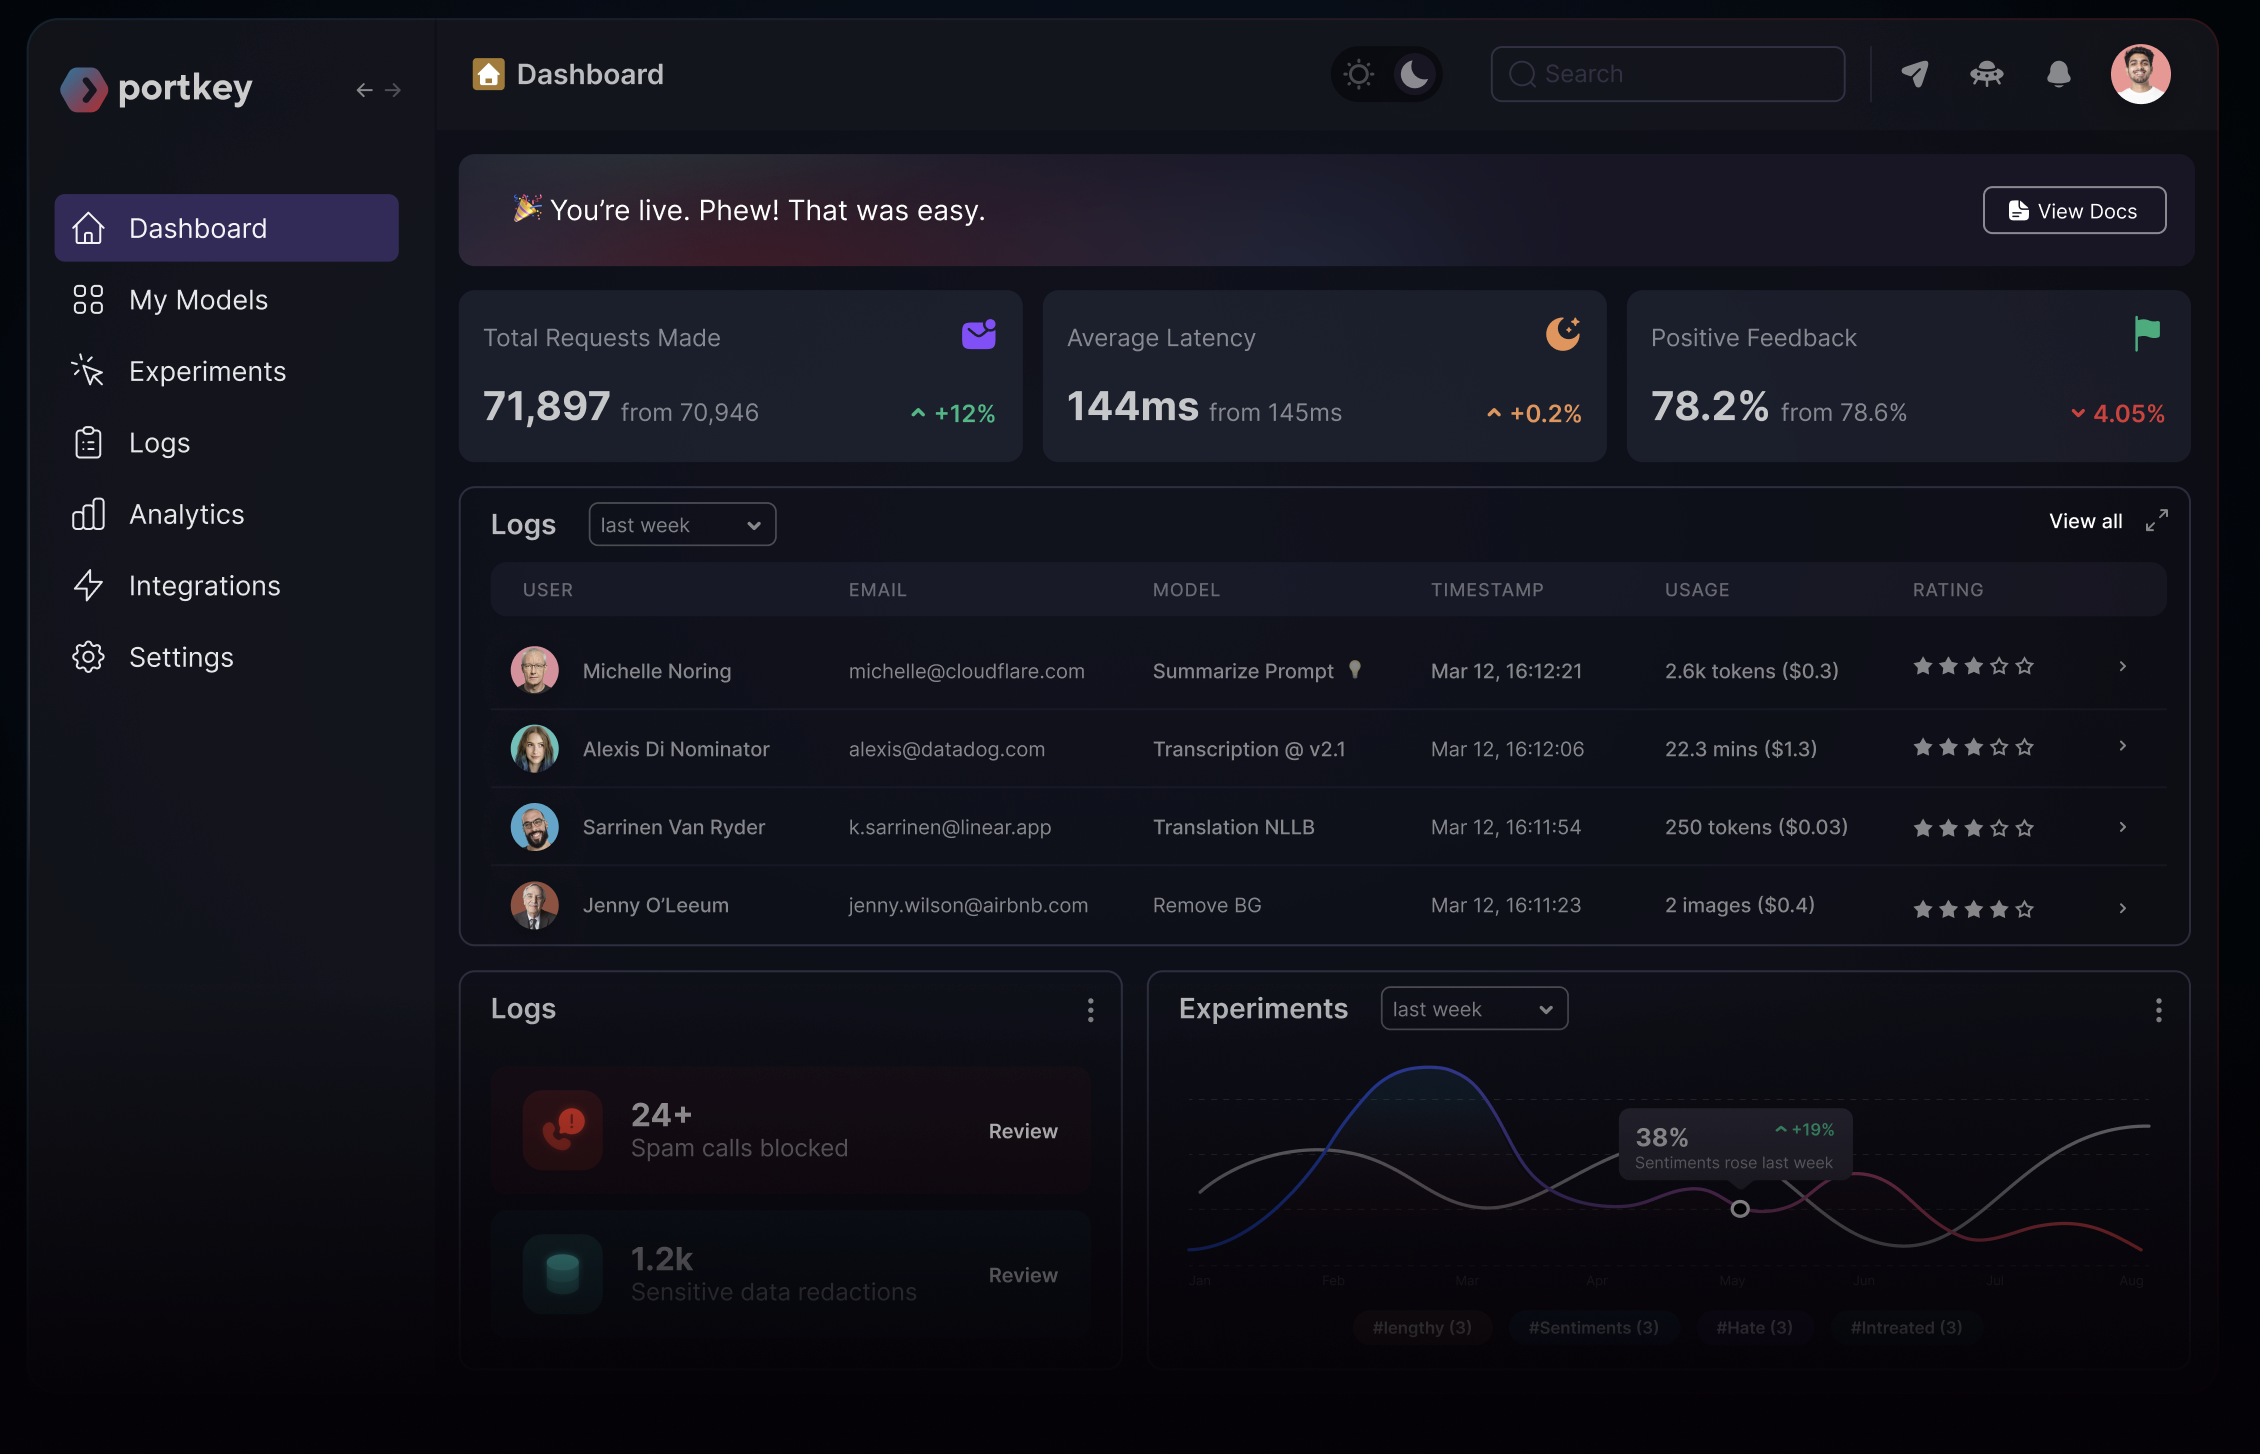
10. Portkey
Portkey is a full-stack observability platform for LLM applications, providing real-time insights, metric tracking, and debugging for development teams. Designed to handle the complexities of LLM-based workflows, Portkey helps organizations monitor, analyze, and optimize their applications.
License: MIT
Repo: https://github.com/Portkey-AI/gateway
GitHub stars: 6K+
Contributors: 40+
- Request and response logging: Records every interaction, allowing developers to monitor requests, view responses, and troubleshoot issues efficiently within a unified interface.
- In-depth analytics dashboard: Tracks over 21 essential metrics, providing insights into performance trends and usage patterns that support data-driven decisions and proactive optimizations.
- Customizable filters: Enables users to apply filters and refine data views, allowing teams to focus on critical metrics and reduce noise in high-volume applications.
- Custom metadata tagging: Supports the addition of custom metadata to LLM API calls, enabling unique tags for easy grouping, enhanced tracking, and efficient troubleshooting.
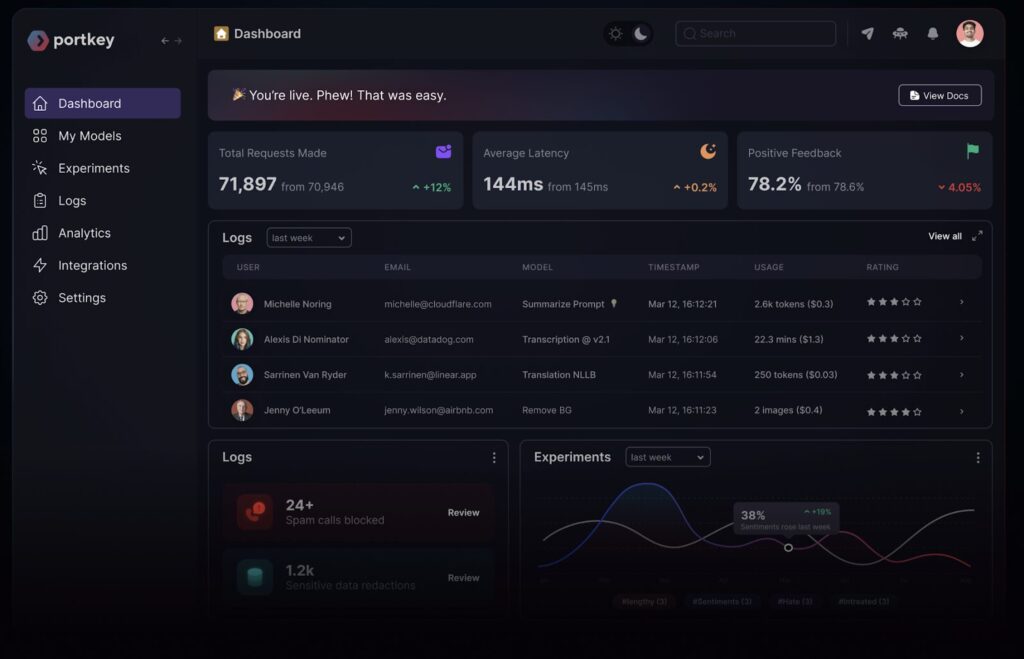
Source: Portkey
Related content: Read our guide to AI monitoring
Conclusion
LLM observability tools are essential for ensuring the effectiveness, safety, and reliability of language model-based applications. By providing detailed insights into model performance, user interactions, error patterns, and ethical safeguards, these tools help developers understand and improve how LLMs operate in real-world settings.
