7 Datadog Alternatives You Should Know About

Datadog Pros and Cons
Here are some of the pros and cons you should know about when considering Datadog vs. alternative solutions.
Advantages of Datadog:
- User interface: Datadog has an intuitive, clean, and modern interface, which is easy to adapt to, even for beginners.
- Versatility: Supports a wide range of developer and operations workflows.
- Visualizations: The dashboards provide useful visualizations for technical roles and management.
- Scalability: Datadog can be used with infrastructure or applications at any scale.
Disadvantages of Datadog:
- Cost structure: Datadog’s pricing is based on specific features, which can become expensive as needs scale.
- Documentation and customer support: Some users report Datadog documentation is not sufficiently comprehensive and sometimes unclear, and some users were not satisfied with responsiveness of customer support.
- Learning curve: Datadog is a complex platform and can be difficult to learn and use for non-experienced teams.
7 Datadog Alternatives to Consider
Coralogix
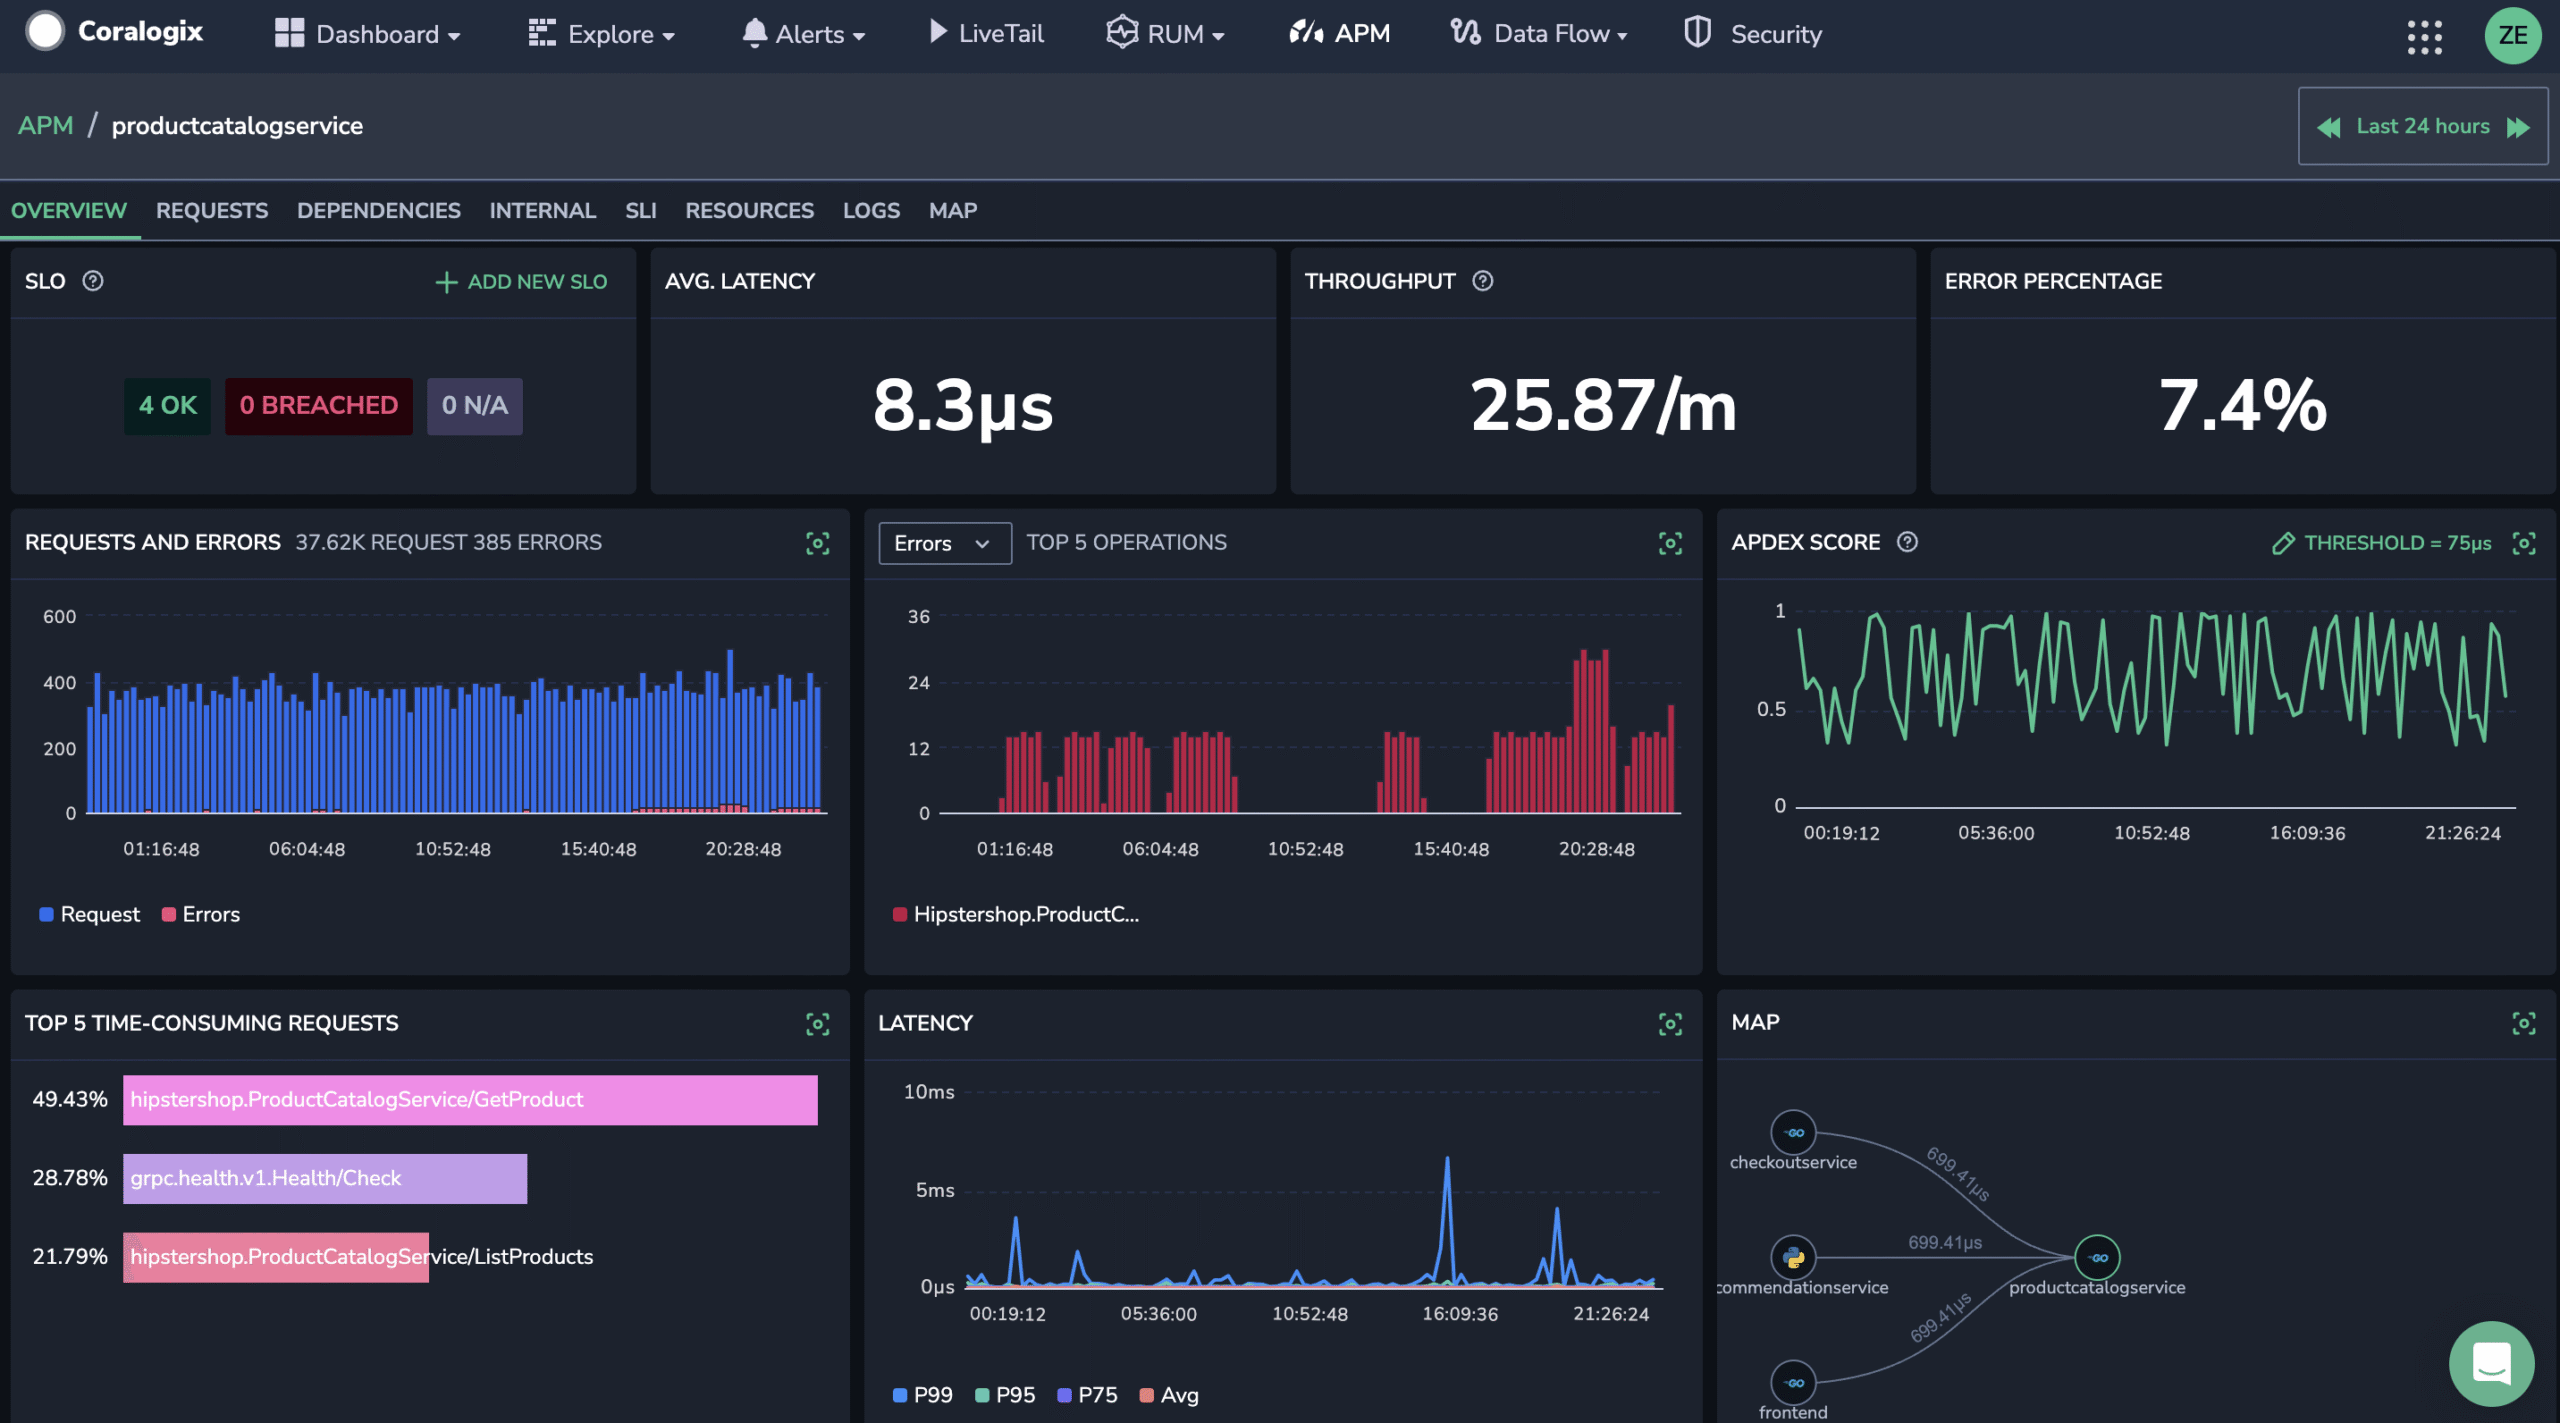
Coralogix is a full-stack observability platform that can analyze logs, metrics, tracing and security data without the need for indexing or costly hot storage. With built-in cost optimization, Coralogix delivers modern observability for a fraction of the cost of Datadog.

In our overall view of the observability industry, Coralogix Streama architecture addresses a number of key concerns around performance, cost optimization, simplicity, and scalability that customers struggle to find elsewhere. It offers significant cost savings through the TCO Optimizer and ensures fast, resilient data processing. Coralogix’s straightforward pricing, comprehensive APM, and exceptional support with quick response and resolution times, along with robust security features, make it a leading choice for operational efficiency and security.
Compare Datadog pricing with Coralogix pricing.
Splunk
Splunk provides powerful capabilities in processing and analyzing machine-generated data, particularly large volumes of logs. It enables real-time visibility into system performance, security threats, and operational health. One of Splunk’s core features is its flexible search language, which allows users to perform complex queries on their data, making it a versatile tool for a wide range of use cases from IT operations to security analytics.
Splunk also offers extensive data visualization options, including dashboards and reports, that help in translating data insights into actionable intelligence. Additionally, Splunk has a vast ecosystem of apps and integrations, enhancing its functionality and allowing it to fit into diverse IT environments.
New Relic
New Relic is a cloud-based observability platform that offers a suite of tools for monitoring and optimizing application performance. A key capability of New Relic is its Application Performance Monitoring (APM) capability, which provides in-depth insights into application behavior, including transaction tracing and error tracking.
New Relic also offers infrastructure monitoring, enabling visibility into the health and performance of servers and hosts. The platform’s real user monitoring (RUM) feature captures end-user experiences, helping teams to understand performance from the user’s perspective. Additionally, New Relic’s intuitive interface and robust analytics tools facilitate the quick identification of performance bottlenecks and issues.
AppDynamics
AppDynamics, part of Cisco, is a solution that focuses on application performance and business performance monitoring. Its APM feature provides visibility into application code, helping in identifying and resolving performance issues quickly. AppDynamics also provides a business performance monitoring feature, which links application performance to business outcomes, providing insights into how application performance impacts business metrics.
AppDynamics also offers end-to-end transaction tracing, allowing users to track requests from start to finish across multiple services and components. The platform’s user experience monitoring capabilities are also noteworthy, providing insights into how users interact with applications.
Dynatrace
Dynatrace is a full-stack monitoring solution that provides automated observability across applications, clouds, and infrastructure. It provides automatic discovery and mapping of all components within an IT environment, creating a real-time topology map of applications and services.
Dynatrace’s AI engine, called Davis, can automatically detect performance anomalies and provide root cause analysis, reducing the time needed for problem resolution. The platform also includes digital experience monitoring, which helps in understanding user experiences and interactions with applications, and integrates with cloud platforms, allowing it to support hybrid or multi-cloud environments.
Instana
Instana is an APM and observability tool designed for microservices and cloud-native applications. It provides real-time insights and automated root cause analysis for complex and dynamic environments. Instana automatically maps the relationships between services and infrastructure components, providing a clear visualization of the system architecture.
Instana’s capability to trace and monitor every request in a distributed system helps in pinpointing and investigating issues quickly. Additionally, Instana supports containerized environments, including Kubernetes monitoring, allowing it to support modern DevOps workflows.
Prometheus
Prometheus is an open-source monitoring solution that is particularly well-suited for monitoring time-series data. It is widely used in the Kubernetes ecosystem for monitoring containerized applications. Prometheus’s strength lies in its powerful query language, PromQL, which allows for detailed querying and analysis of time-series data.
Prometheus is designed for reliability and can handle high volumes of metrics. It also offers a flexible and dynamic service discovery mechanism, which is crucial for containerized environments. Its active community and ecosystem contribute to a broad range of exporters and integrations, enhancing its ability to monitor various types of systems and applications.
Conclusion
In conclusion, while Datadog is a full-featured monitoring and analytics platform, each of the alternatives we discussed brings its unique strengths and specializations to the table. These range from advanced machine learning capabilities in log analysis, extensive application performance monitoring, to open-source solutions for time-series data monitoring.
Choosing the right tool depends on specific business needs, the scale of operations, the complexity of the IT infrastructure, and budget considerations. Make sure you select a monitoring and analytics solution that not only meets their current needs but also scales effectively to address future challenges and opportunities.
Learn more about Coralogix: The Ultimate Datadog Alternative

