

Grafana vs. Datadog: 6 Key Differences and How to Choose

What Is Grafana?
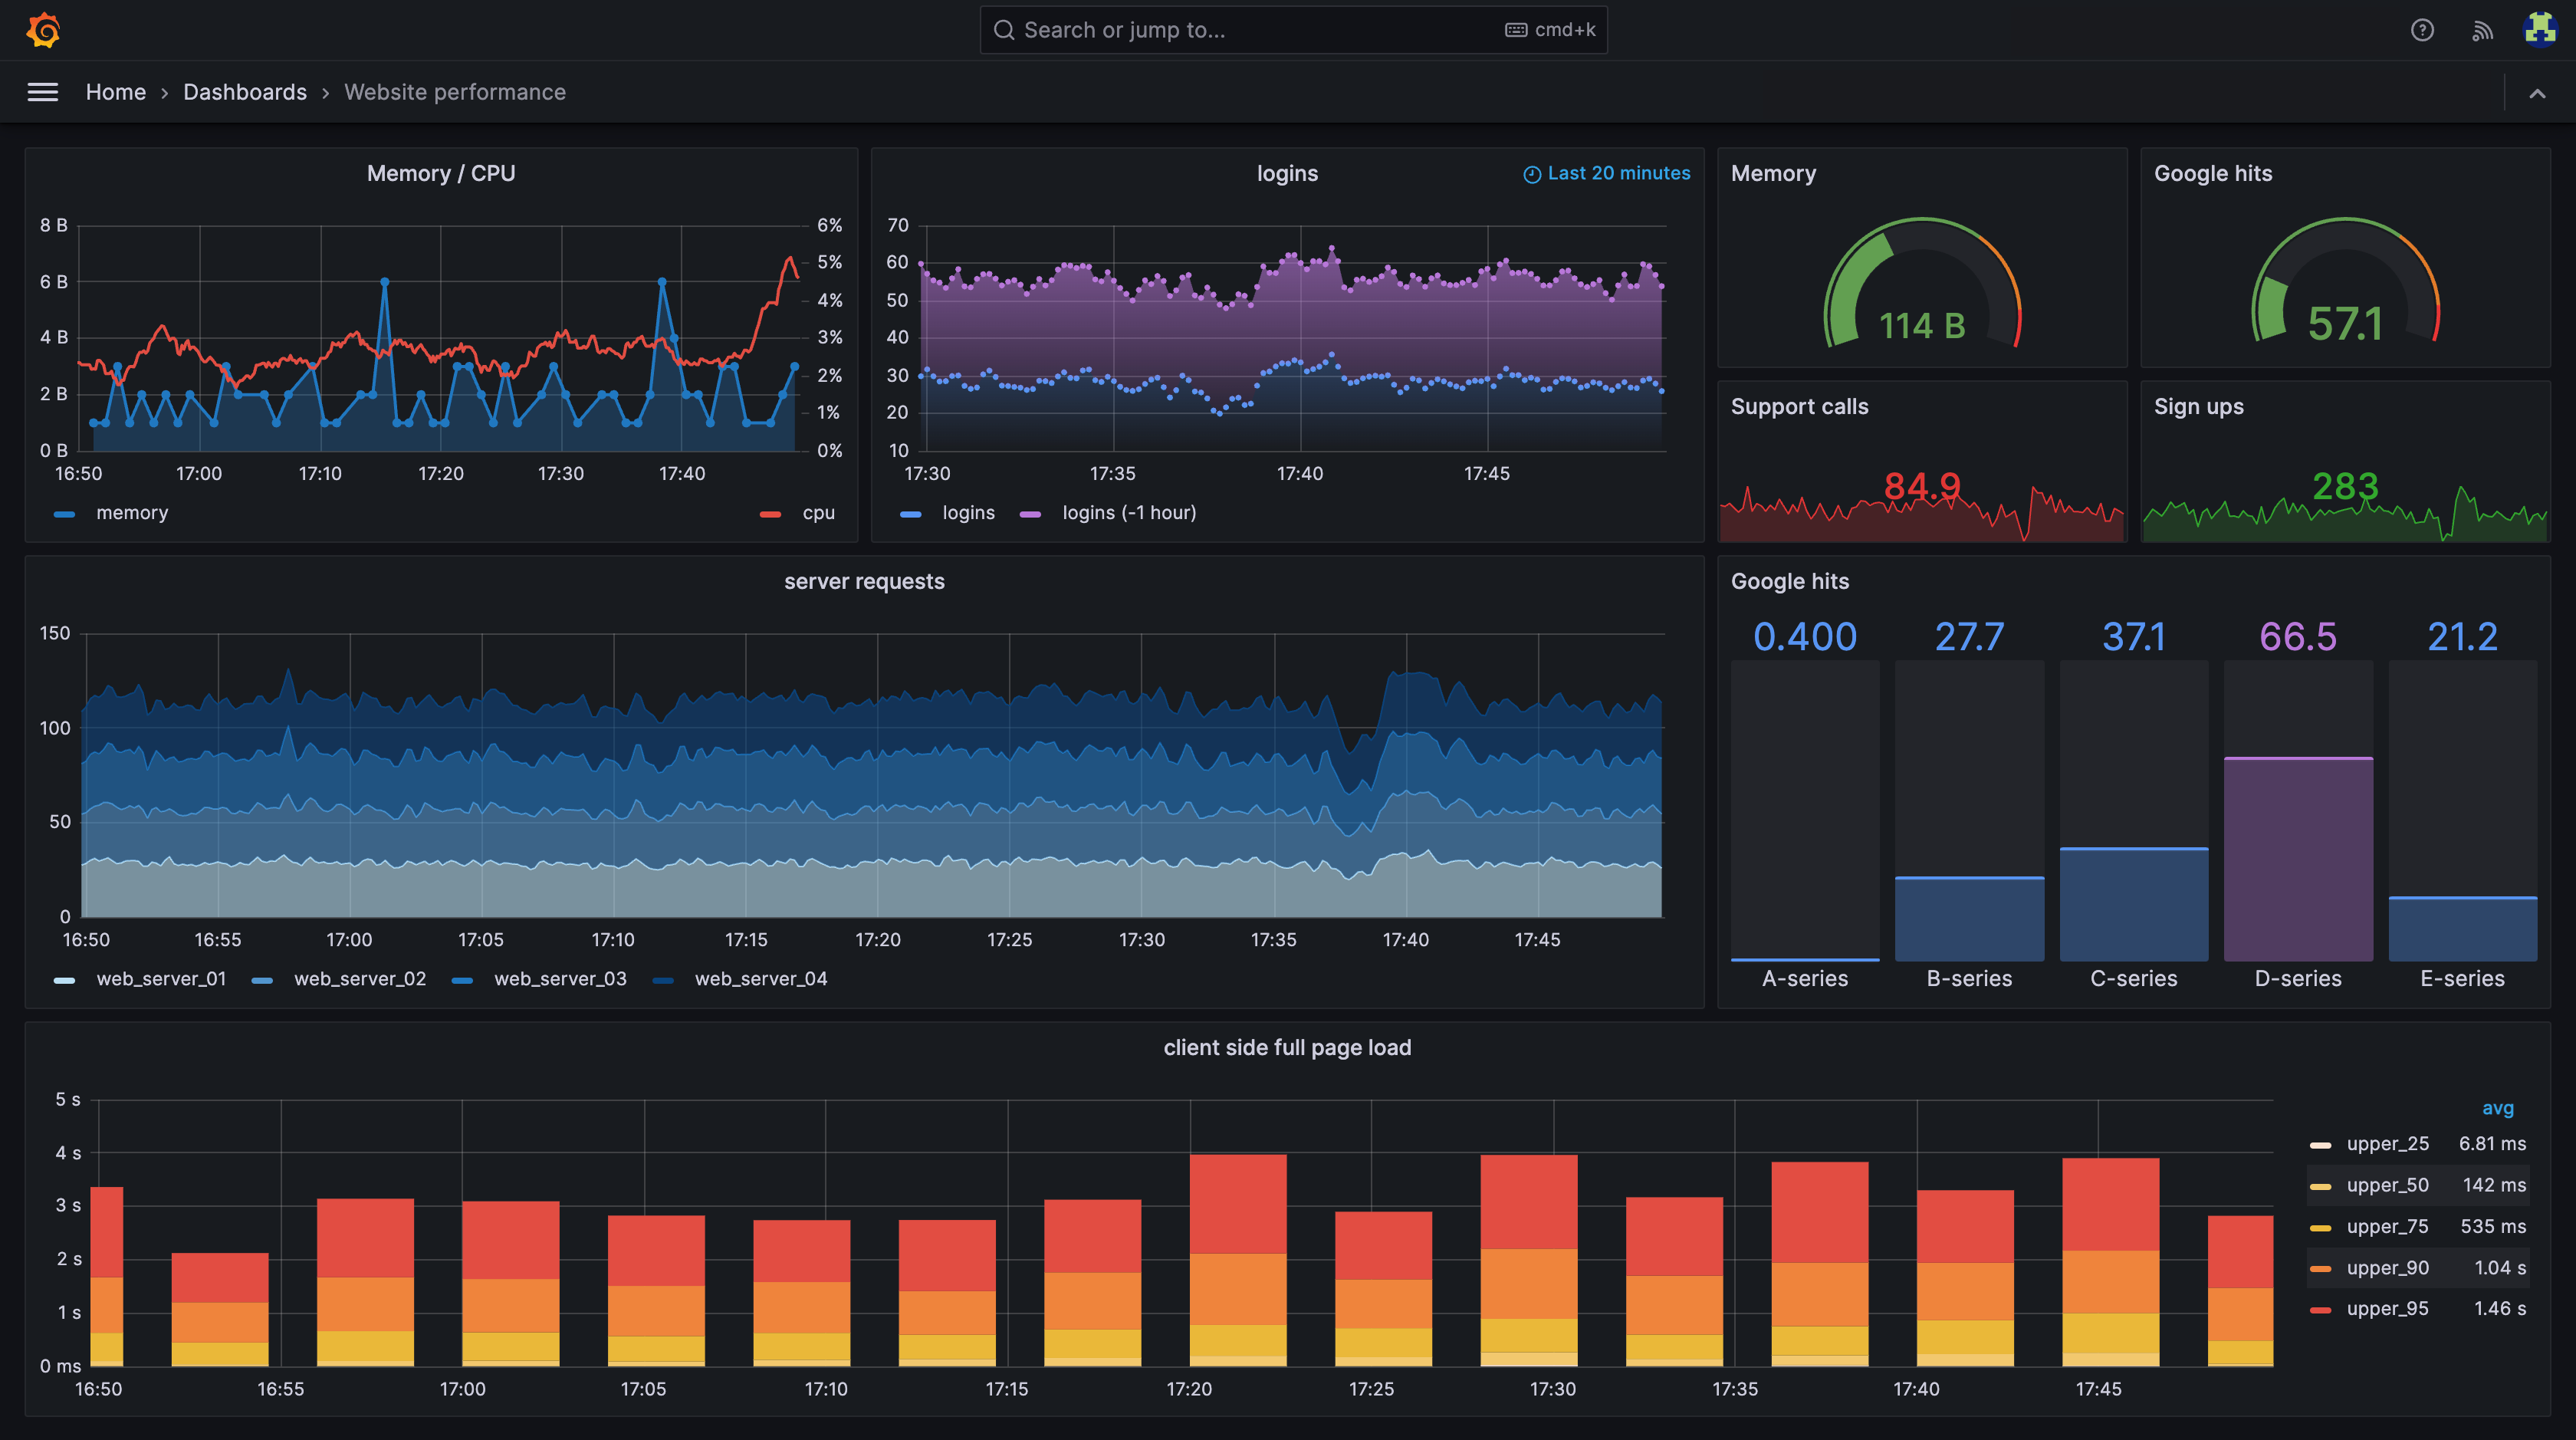
Grafana is an open-source platform that allows you to query, visualize, alert, and understand your metrics no matter where they are stored. It supports many data formats, including time-series databases like Graphite or InfluxDB, relational databases like MySQL or Postgres, or non-relational databases like MongoDB or Cassandra. You can create dashboards with panels, each representing specific metrics over a set time-frame.
Grafana comes with integrations for a wide range of data sources, including Prometheus, MySQL, and Cloudwatch.
Apart from its visualization capabilities, Grafana also allows you to set up alerts and notifications based on specific conditions in your data. This is particularly useful for monitoring applications and infrastructure. Grafana can send these alerts through various channels like email, Slack, or PagerDuty.
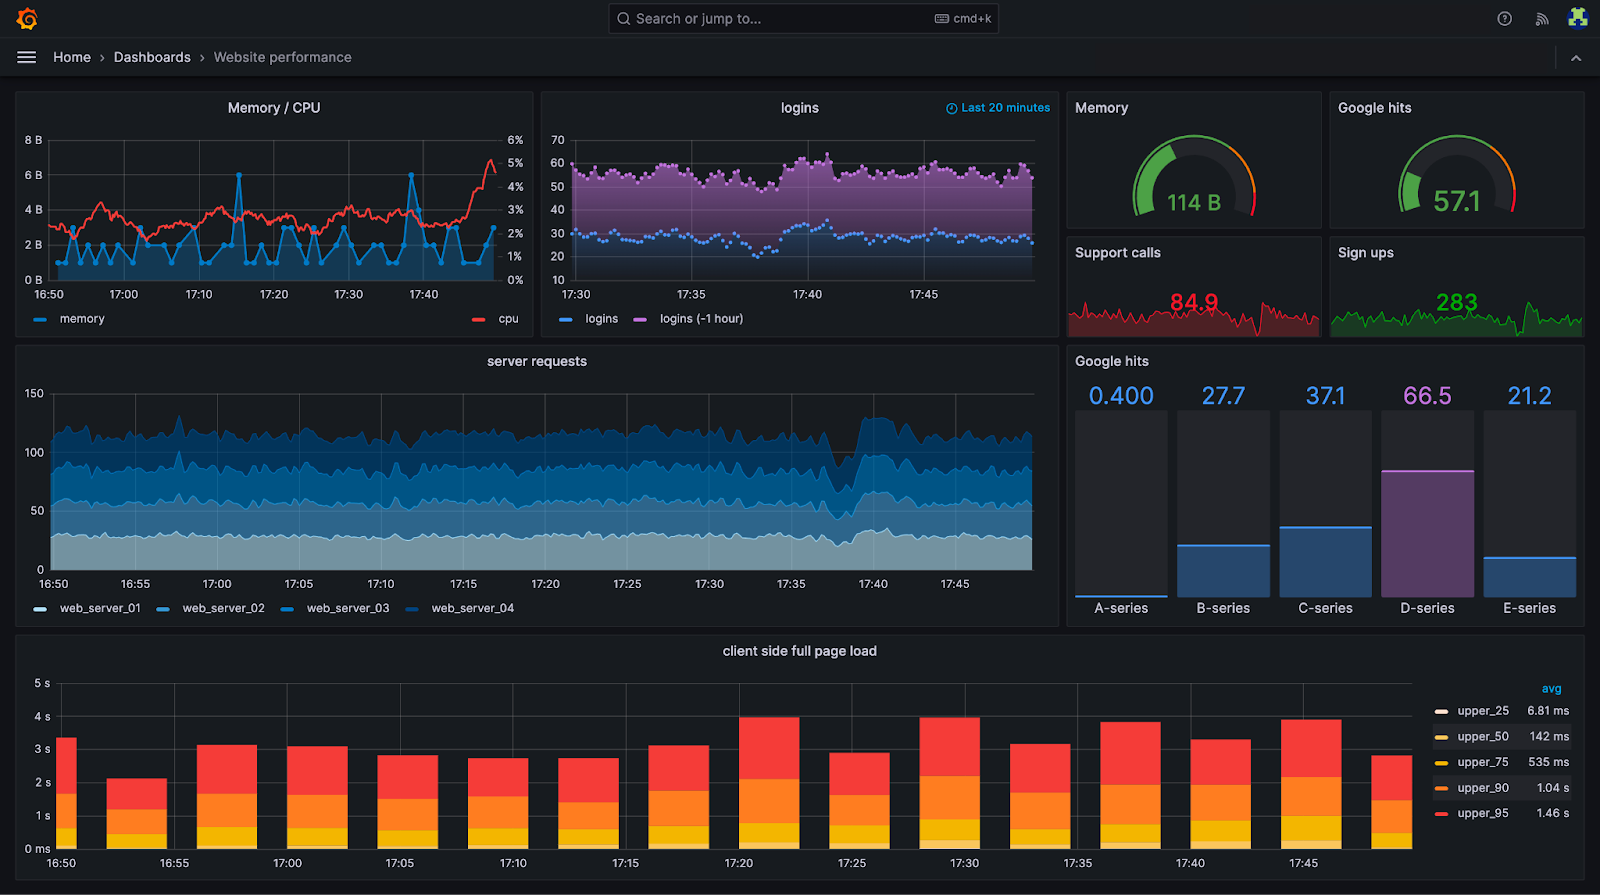
Source: Grafana
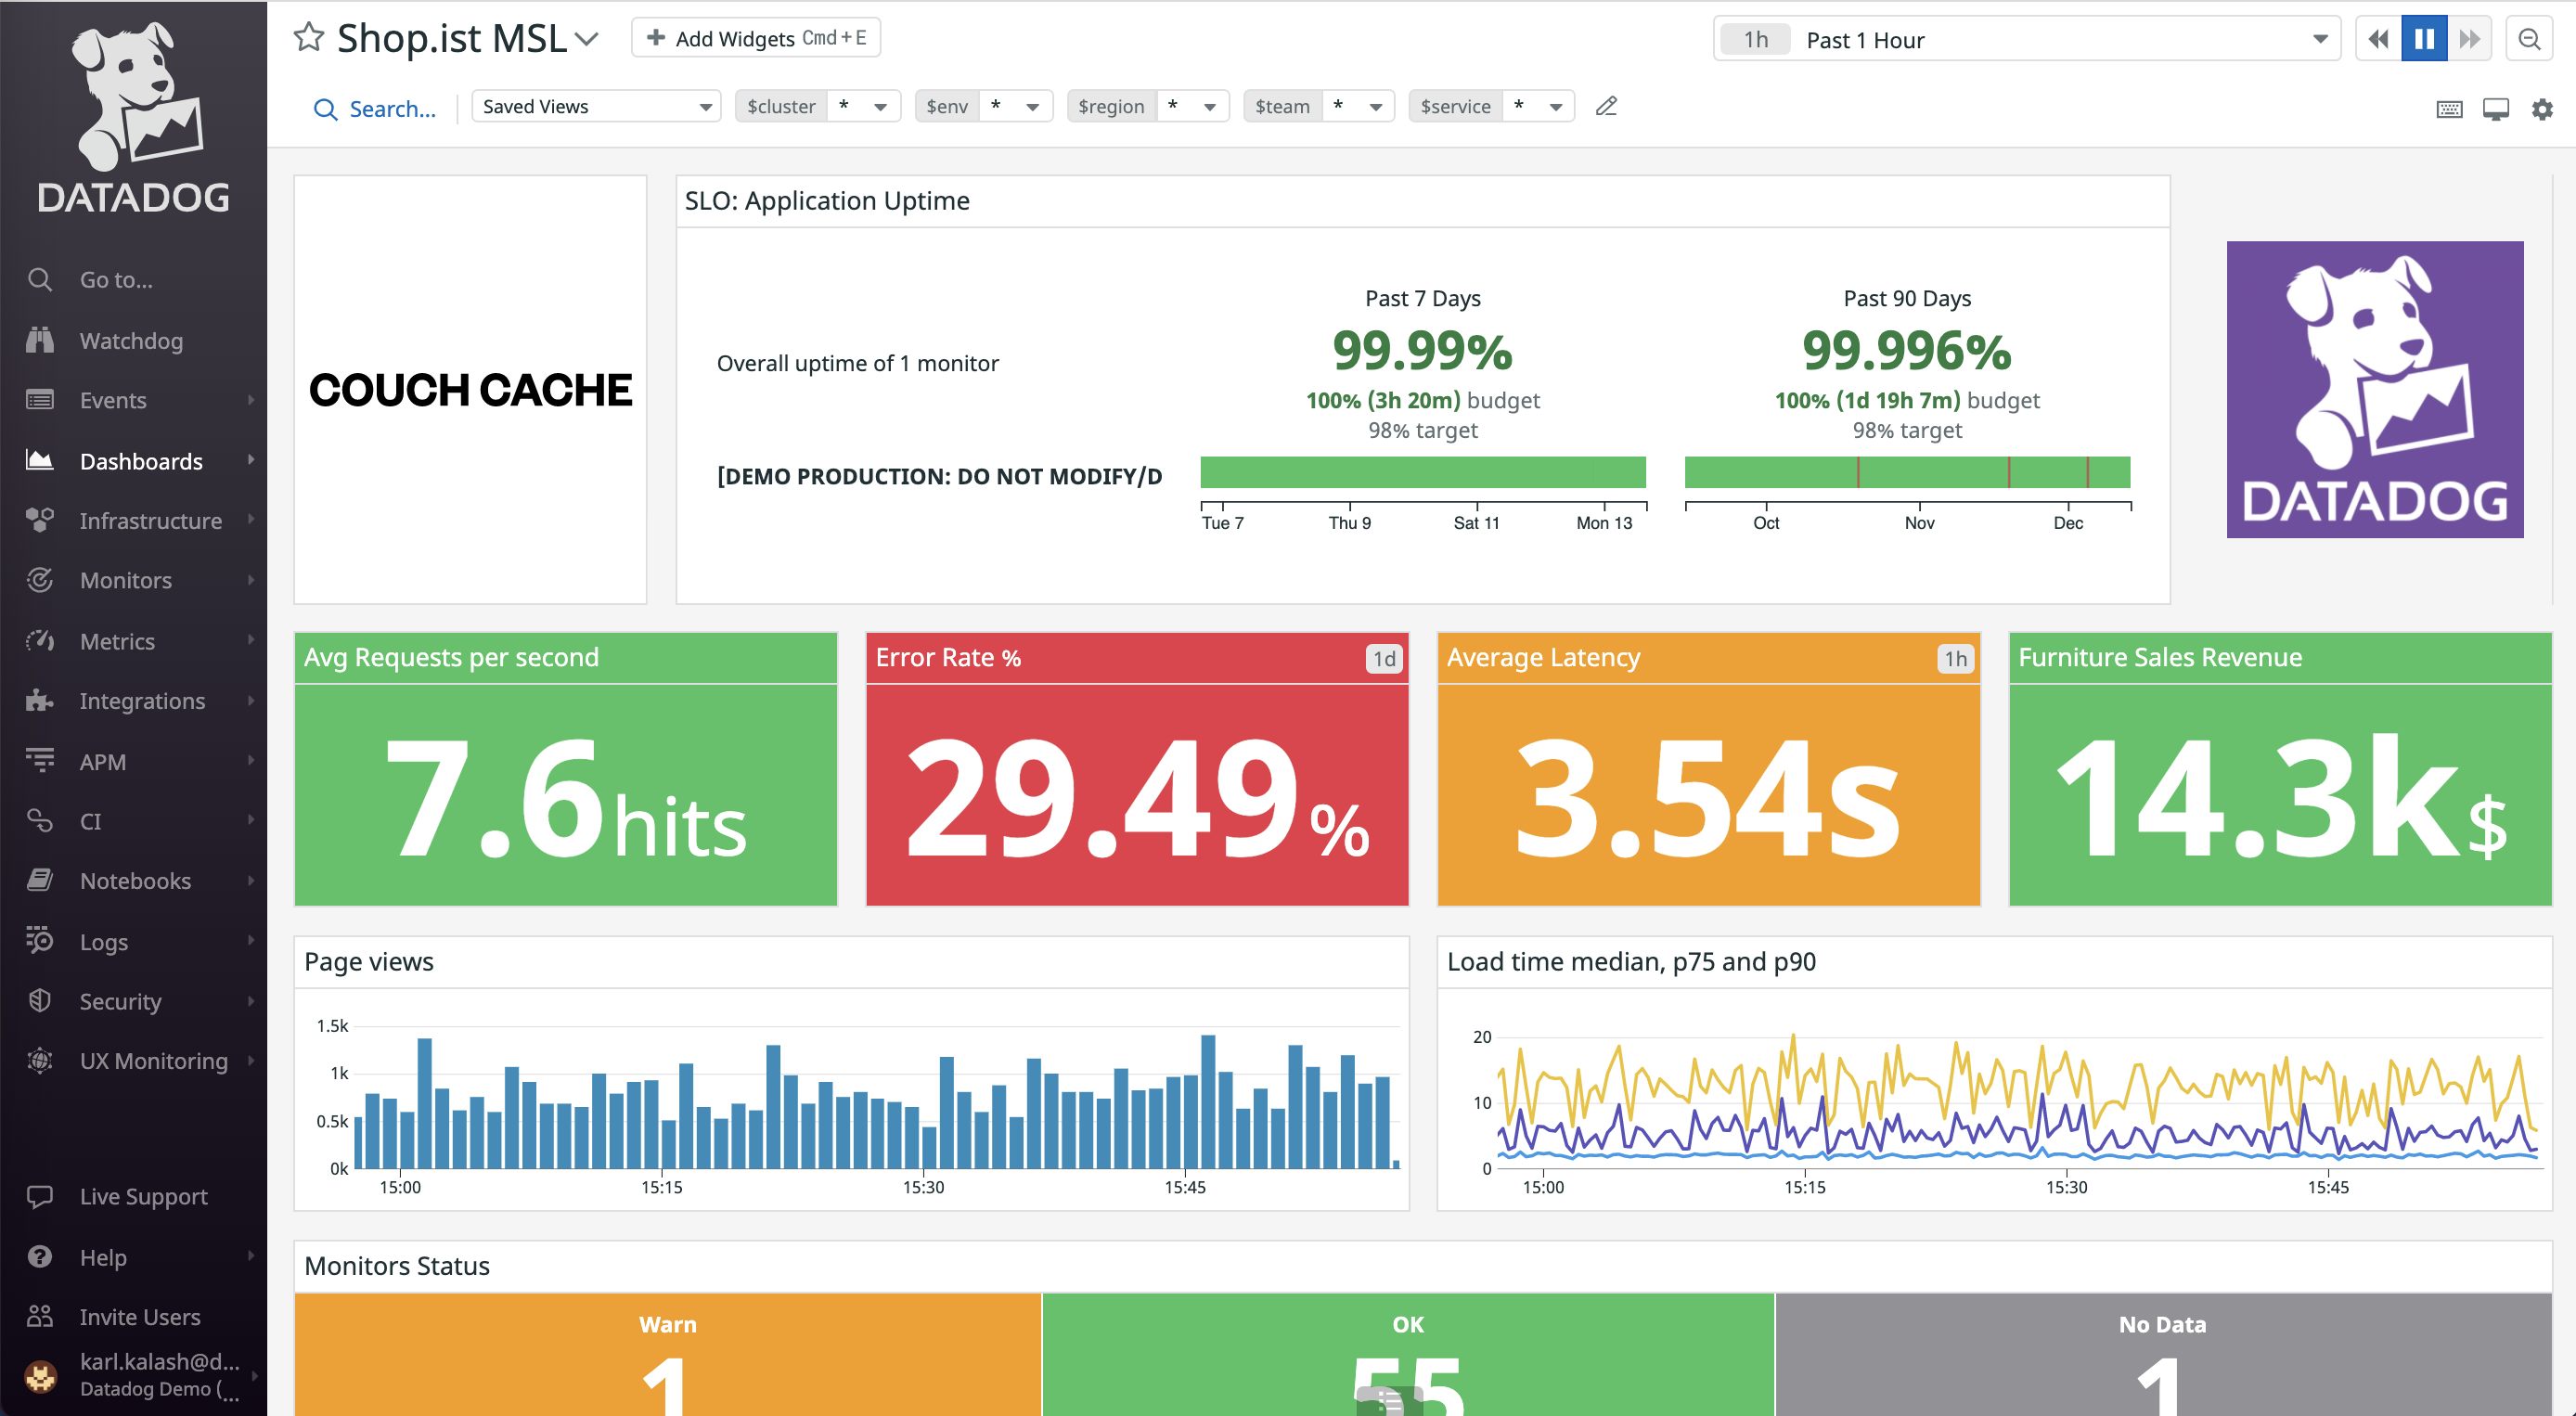
What Is Datadog?
Datadog is a comprehensive monitoring service for applications and IT environments. It provides a SaaS-based data analytics platform that can monitor applications, servers, databases, cloud services, and many other IT assets.
Datadog offers a suite of monitoring and analytics tools for IT operations, security, and business users. It provides granular visibility over software behavior and correlates app performance or errors with infrastructure metrics and events. Datadog provides over 400 integrations, allowing you to bring together data from all your different tools and platforms into one place. In particular, it collects data from AWS, Azure, Google Cloud, popular databases and web servers.
Another key capability of Datadog is its machine learning capabilities. Datadog can automatically detect anomalies and outliers in your data, which can help you identify potential issues before they become critical.
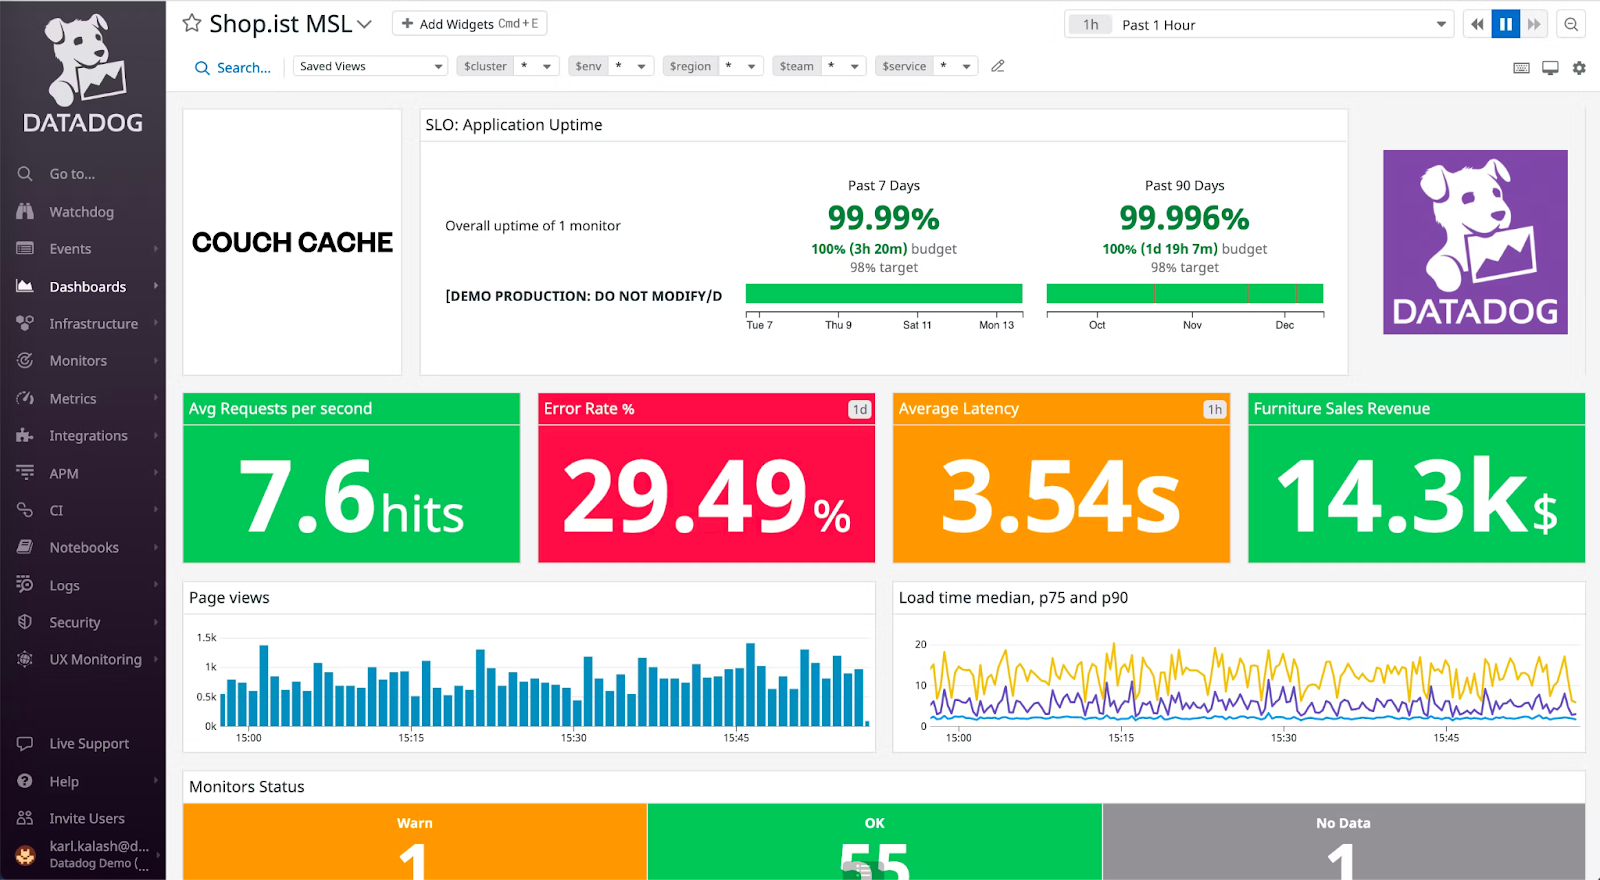
Source: Datadog
This is part of a series of articles about Datadog APM.
Grafana vs Datadog: 6 Key Differences
1. Primary Features and Use Cases
Grafana is primarily a visualization tool. It excels at creating beautiful, informative dashboards that allow you to see the big picture or drill down into the details. Grafana is highly customizable, allowing you to create complex queries and display the results in a range of formats. It’s useful for exploring your data and sharing your findings with others.
Datadog is designed as a comprehensive monitoring solution. It’s more than just a visualization tool, offering advanced features like anomaly detection, forecasting, and detailed alerting capabilities. Datadog is suitable for teams who need to keep a close eye on their applications and infrastructure, identify issues before they impact users, and understand the performance of their systems in detail.
2. Usability and Interface
Grafana’s interface is clean and straightforward. It focuses on dashboards, letting you easily switch between different dashboards and panels, adjust time ranges, and apply filters. It lets you quickly create new dashboards and panels with a robust query builder and many customization options. However, Grafana can be a bit intimidating for beginners, as it requires some knowledge of the data source query language.
Datadog’s interface is a bit more complex, reflecting its broader range of features. It provides a unified view of all your data, with a powerful search function that allows you to quickly find the information you need. Datadog includes a set of pre-built dashboards for various data sources, which can be a time-saver and does not require building or tweaking data queries.
3. Integrations
Grafana supports a wide range of data sources, including many popular time-series databases, SQL databases, and cloud services. This makes it a flexible choice that can work with almost any data you have. However, Grafana does not offer as many pre-built dashboards or data source-specific features as Datadog.
Datadog, on the other hand, supports over 400 integrations, including a wide range of cloud services, databases, and monitoring tools. This makes it easy to bring together data from all the different parts of your stack. Furthermore, many of these integrations come with pre-built dashboards, making it easy to start getting insights from your data right away.
4. Customer Support
Grafana has an active and supportive open source community. Free version users can find a plethora of resources online, from detailed documentation to user forums and GitHub discussions. Grafana also offers direct customer support as part of their paid plans.
Datadog does not provide significant support options for free users. For paid users, it provides a more comprehensive customer support system. Users can directly contact Datadog’s support team for assistance. Additionally, Datadog has an extensive knowledge base, tutorials, and community forums to troubleshoot issues or learn more about the platform.
5. Pricing
Grafana operates on a freemium model. It offers a robust open-source version that users can download and use for free. However, for access to advanced features and direct support, users need to subscribe to Grafana Enterprise. The pricing for the Enterprise version starts from $29 / month for 5 users.
Datadog provides a limited free tier, with up to 5 hosts and data retention of 1 day, and also offers a 14-day free trial for users to test the platform. Beyond that, it offers a subscription-based model starting at $15 / host / month. Datadog can be expensive for organizations that need to monitor a large number of IT assets, because its pricing is based on the number of hosts. Learn more about Datadog pricing.
6. Security
Grafana provides comprehensive security features including data encryption, user permissions, and audit logs. However, because it’s primarily a self-hosted solution, the responsibility of securing the system largely falls on the user. This means you need to ensure your servers are secure, update Grafana regularly to get security updates, and manage user access effectively.
Datadog, as a cloud-based solution, takes a different approach to security. It offers end-to-end security with features like encryption, multi-factor authentication, role-based access control, and compliance with security standards like GDPR and HIPAA. As a managed service, Datadog takes responsibility for security updates and server maintenance.
Grafana vs Datadog: How to Choose?
Here are some of the key aspects to consider when deciding between Grafana and Datadog:
- Visualization vs. monitoring: If your primary need is detailed, customizable data visualization, Grafana might be the better choice. If comprehensive monitoring, including anomaly detection and real-time alerting, is a priority, Datadog’s advanced capabilities may be more suitable.
- Complexity of IT environment: For more complex environments with numerous integrations, Datadog’s extensive range of integrations and pre-built dashboards can save significant time and resources.
- Technical expertise and resources: Grafana requires a certain level of technical know-how, especially for customizing dashboards and queries. Smaller teams or those with limited technical resources might find Datadog’s pre-built dashboards and less complex query setup more manageable.
- Budget and scale: Grafana’s open-source nature makes it a cost-effective solution for smaller operations or organizations with limited budgets. However, consider the potential costs associated with self-hosting and managing the infrastructure. Datadog’s per-host pricing model can become costly for organizations monitoring a large number of hosts or services.
- Security considerations: If your organization has stringent security and compliance requirements, Datadog’s managed service offers comprehensive security features, including compliance with standards like GDPR and HIPAA. Grafana allows more control over data and security but also requires more effort to maintain these aspects.
- Scalability and future growth: If you anticipate rapid scaling or diversification of your IT infrastructure, Datadog’s scalability and wide range of integrations might be beneficial, but will also incur higher costs at large scale. If your current and foreseeable future needs are more focused on visualization and you have a stable set of data sources, Grafana could be a more practical and economical choice.
Read our guide to Datadog alternatives.
Coralogix: The Ultimate Grafana and Datadog Alternative
If Datadog’s prohibitive pricing or Grafana’s lack of feature availability and out-of-the-box analytics is an issue for you, check out Coralogix for a robust and cost-effective observability platform for all your logs, metrics, tracing, and security data.