Kubernetes Monitoring: Metrics, Tools, and Best Practices
Why Is Kubernetes Monitoring Important?
Here are the main reasons monitoring is a critical component of Kubernetes cluster management:
- Ensures system reliability: By providing insights into the health and performance of the cluster and its components, Kubernetes monitoring helps in identifying and resolving issues promptly, improving uptime and reducing production issues.
- Enables proactive issue resolution: Detects anomalies and potential issues before they escalate into serious problems.
- Optimizes resource utilization: Aids in tracking resource consumption, enabling efficient allocation and utilization of computing, memory, and storage resources, reducing waste and optimizing costs.
- Improves application performance: By monitoring key metrics, administrators can make informed decisions to tune and improve application performance.
- Supports scalability: Kubernetes monitoring provides the data needed to make informed decisions about when to scale resources up or down, supporting efficient scalability of applications.
- Enhances security: Through continuous monitoring of cluster activities and access, potential security threats can be identified and mitigated, enhancing the security posture of Kubernetes environments.
- Supports compliance: Keeping a detailed record of cluster activities and metrics assists in maintaining compliance with regulatory standards, providing audit trails and evidence of compliance.
What Kubernetes Metrics Should You Measure?
Cluster Metrics
Cluster metrics offer a high-level view of Kubernetes health and performance. Monitoring cluster CPU usage, memory consumption, and storage helps in understanding resource availability and bottlenecks. Such metrics are useful for ensuring the cluster has sufficient capacity to run workloads effectively.
Tracking the number of running, pending, and failed pods across the cluster provides insights into the health and performance of applications. These metrics indicate potential issues with deployments, requiring adjustments to maintain service availability and performance.
Pod Metrics
Pod metrics focus on individual pods, the smallest deployable unit in Kubernetes. Monitoring CPU and memory usage at the pod level helps identify resource-intensive applications. This information is crucial for optimal resource allocation and avoiding resource contention that can lead to performance degradation.
Observing restart counts and the state of pods (Running, Waiting, or Terminated) can highlight stability issues. High restart counts may indicate application or environment problems, necessitating investigation and remediation.
Deployment Metrics
Deployment metrics are useful for understanding the status and efficiency of application deployments in Kubernetes. Metrics such as the desired versus actual number of pods can reveal issues with deploying or scaling applications, indicating possible resource constraints or configuration errors.
Monitoring rollout status, including updates and rollbacks, helps ensure deployments proceed smoothly. It allows for tracking the progress and success of application updates, facilitating quick recovery in case of failed deployments.
Ingress Metrics
Ingress metrics provide insights into the traffic handled by Kubernetes Ingress resources, responsible for routing external traffic to cluster services. Monitoring request count, request duration, and response status codes help in assessing application performance and user experience.
These metrics are useful for identifying traffic patterns, detecting anomalies, and optimizing resource allocation to meet demand. They also enable quick identification and troubleshooting of connectivity or performance issues affecting access to applications.
Control Plane Metrics
Control plane metrics focus on the health and performance of the Kubernetes control plane components, such as the API server, controller manager, and scheduler. Key metrics include request rates, latency, and error rates for the API server, which is central to cluster operation.
Monitoring these metrics helps ensure the control plane operates efficiently, sustaining system stability and performance. High latency or error rates may signal problems that could impact cluster management and operations, requiring immediate attention.
Node Metrics
Node metrics reveal the performance and status of individual cluster nodes, the physical or virtual machines running containerized applications. Tracking CPU, memory, disk, and network usage helps identify overloaded nodes or potential failures.
Observing node conditions, such as MemoryPressure, DiskPressure, and NetworkUnavailable statuses, provides a clear picture of node health. This informs maintenance decisions, such as node replacement or cluster scaling, to maintain optimal performance and availability.
Kubernetes Monitoring Challenges
Here are some of the main challenges involved in monitoring Kubernetes environments.
Volume of Metrics
The extensive volume of metrics generated by Kubernetes clusters can be challenging to track. A high metric volume requires efficient data collection, storage, and analysis strategies to manage the information without overwhelming resources or losing critical insights.
Developing a focused monitoring strategy that prioritizes key metrics and employs intelligent filtering can help mitigate this challenge. This approach ensures monitoring efforts are impactful, focusing on data that genuinely enhances understanding and decision-making.
Ephemeral Components
Kubernetes’ dynamic nature, with ephemeral components like pods and containers that frequently start, stop, and move, complicates monitoring. Traditional monitoring tools may struggle to keep up with the transient nature of these resources, leading to gaps in visibility.
Adopting monitoring tools and practices designed for Kubernetes’ dynamic environment can address this challenge. These tools track short-lived components and provide centralized log aggregation, providing continuous visibility despite constant changes.
Visibility Across Clusters
Achieving visibility across multiple Kubernetes clusters is another challenge, complicating management and monitoring at scale. Each cluster may have distinct configurations, workloads, and performance characteristics, requiring individual attention.
Centralized monitoring solutions that can aggregate data from multiple clusters offer a solution. They provide a consolidated view of performance and health across the entire Kubernetes landscape, simplifying analysis and decision-making.
Security and Compliance
Ensuring security and maintaining compliance within Kubernetes environments present significant challenges, especially in dynamic and complex infrastructures. Monitoring must extend beyond performance metrics to include security audits, vulnerability scanning, and adherence to compliance standards.
Compliance with regulatory standards such as GDPR, HIPAA, or PCI DSS requires continuous monitoring and logging of all activities and data access within the Kubernetes environment. Establishing policies for log retention, access controls, and data encryption is critical. Automated compliance checks and real-time alerts for compliance breaches are essential for maintaining standards and demonstrating compliance during audits.
5 Notable Kubernetes Monitoring Tools
Coralogix

With Coralogix out-of-the-box Kubernetes dashboard you can track key signals for pods, containers, nodes, or entire clusters. Coralogix supports monitoring of any deployment, across multiple clouds, regions and clusters. Additionally, Coralogix architecture doesn’t require hot indexing so you can enjoy comprehensive alerting, analysis and rapid querying directly from your S3 bucket or other archive storage, without breaking the bank. (Of course, you can index your most critical logs and traces and keep them in hot storage and still query and visualize them alongside archived data, all in a unified view.)
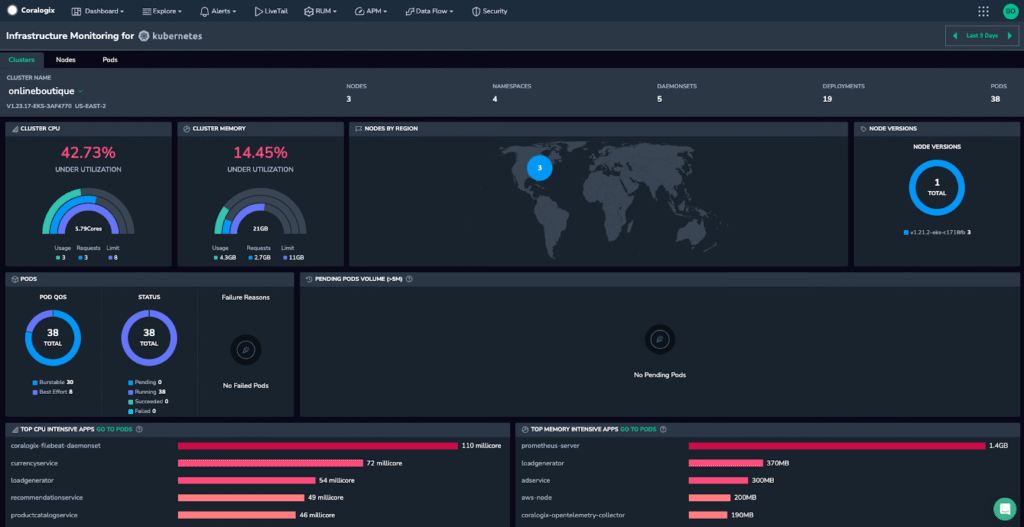
Coralogix leverages Open Telemetry and open source Parquet data format, so you don’t need to ever worry about vendor lock-in. So stop hacking together the same five Grafana dashboards to monitor your Kubernetes cluster and start leveraging the power of Coralogix Kubernetes monitoring.
Kubernetes Dashboard
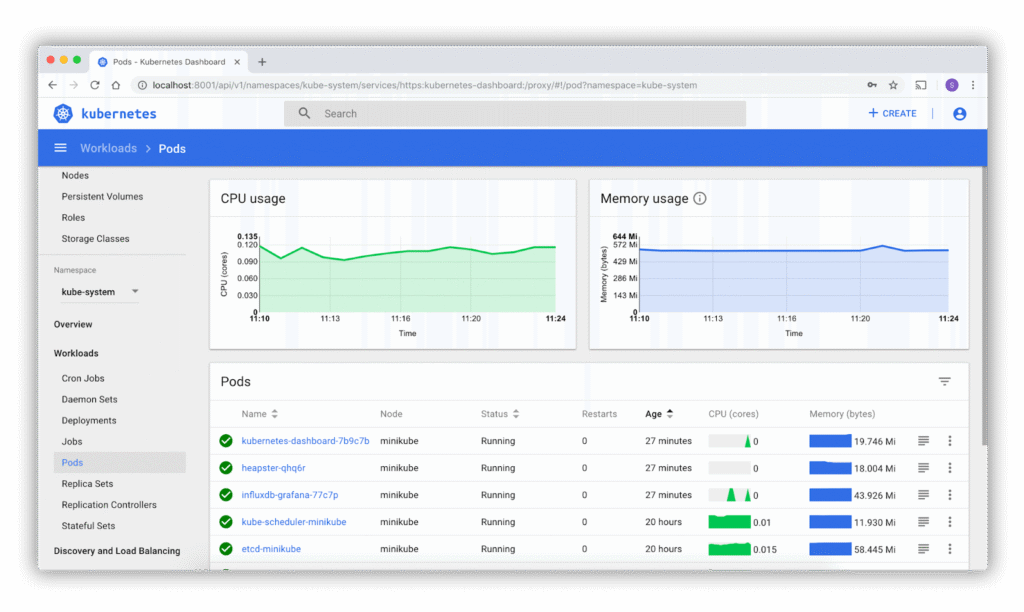
The Kubernetes Dashboard is a web-based user interface that acts as a centralized management tool for Kubernetes clusters. It provides a comprehensive overview of a Kubernetes cluster, allowing users to manage and troubleshoot applications and cluster resources effectively.
The dashboard simplifies complex cluster management tasks by offering a visual representation of the operations, which can significantly ease the learning curve for new Kubernetes users.
Key features of the Kubernetes Dashboard:
- User-friendly interface: Offers a clear, intuitive way to view the statuses of cluster resources such as pods, deployments, and services.
- Resource management: Enables users to create, update, and delete Kubernetes resources and manage their access permissions.
- Metrics visualization: Integrates with cluster metrics to display CPU, memory usage, and other critical performance data in a graphical format.
- Logging and debugging: Provides access to logs from different pods and enables debugging of applications within the cluster.
Access control: Supports role-based access control (RBAC) to ensure secure management of resources based on user roles.
Source: Kubernetes
Prometheus

Prometheus is an open-source monitoring and alerting toolkit widely recognized for its efficiency in handling time-series data. Its design specifically supports the dynamic environments in modern cloud-native architectures like Kubernetes.
Prometheus collects and stores its metrics as time-series data, allowing users to use its powerful query system to retrieve specific insights and trends about their cluster’s operation. Its integration with Kubernetes is seamless, offering detailed insights into the cluster’s state without complex configuration.
Key features of Prometheus:
- Powerful data model: Utilizes a multi-dimensional data model with time series data identified by metric name and key/value pairs.
- Strong query Language: Features PromQL, a flexible query language that allows precise and real-time retrieval of time series data.
- Dynamic service discovery: Automatically discovers Kubernetes services, pods, and nodes to monitor without manual configuration.
- Built-in alerting: Provides alerting through Alertmanager, which handles alerts sent by client applications such as Prometheus.
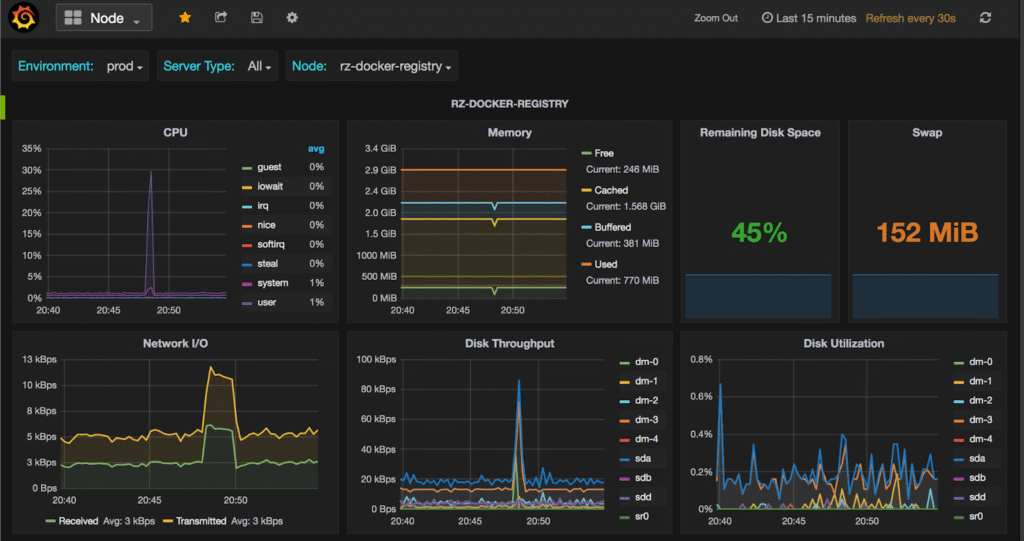
Visualization support: Integrates with Grafana or other visualization tools for comprehensive dashboarding capabilities.
Source: Prometheus
cAdvisor

cAdvisor (Container Advisor) is an open-source tool developed by Google, which provides container users with an easy way to monitor and analyze resource usage and performance characteristics of their running containers. It is specifically built for containers and provides native support for Docker containers.
Key features of cAdvisor:
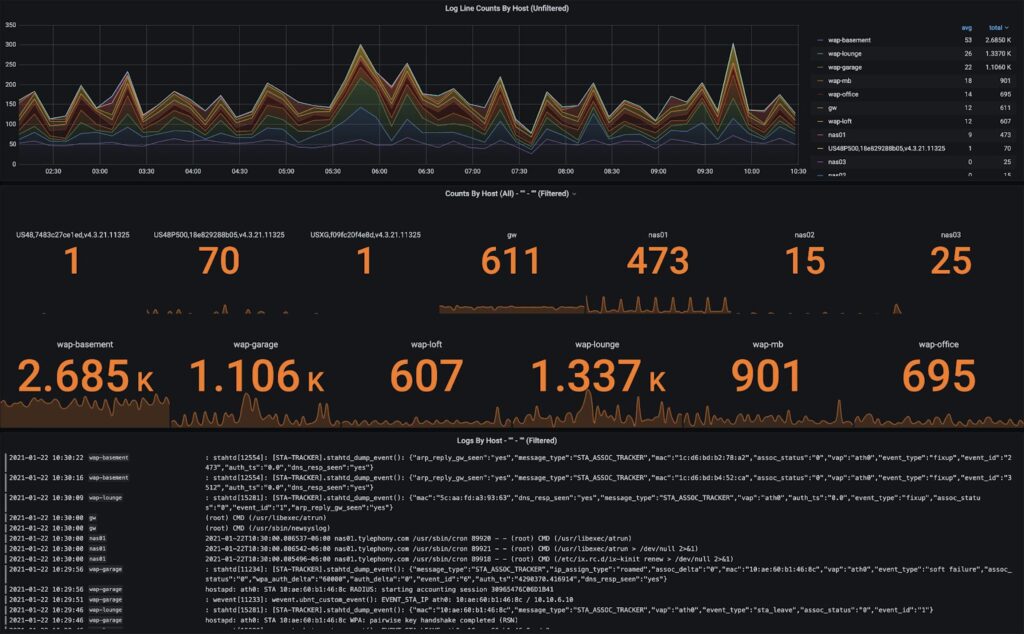
- Real-time Metrics: cAdvisor collects, aggregates, and exports information about running containers, including CPU, memory, file and network usage, providing real-time performance data.
- Container Insight: Provides detailed insight into the container’s lifecycle, including creation, running, and termination phases.
- Resource Isolation Parameters: Helps in understanding resource isolation parameters, making it easier to see the limits of each container’s resource usage.
Historical Data: Stores historical data which can be used for performance analysis and capacity planning.
Source: GitHub
Kubewatch
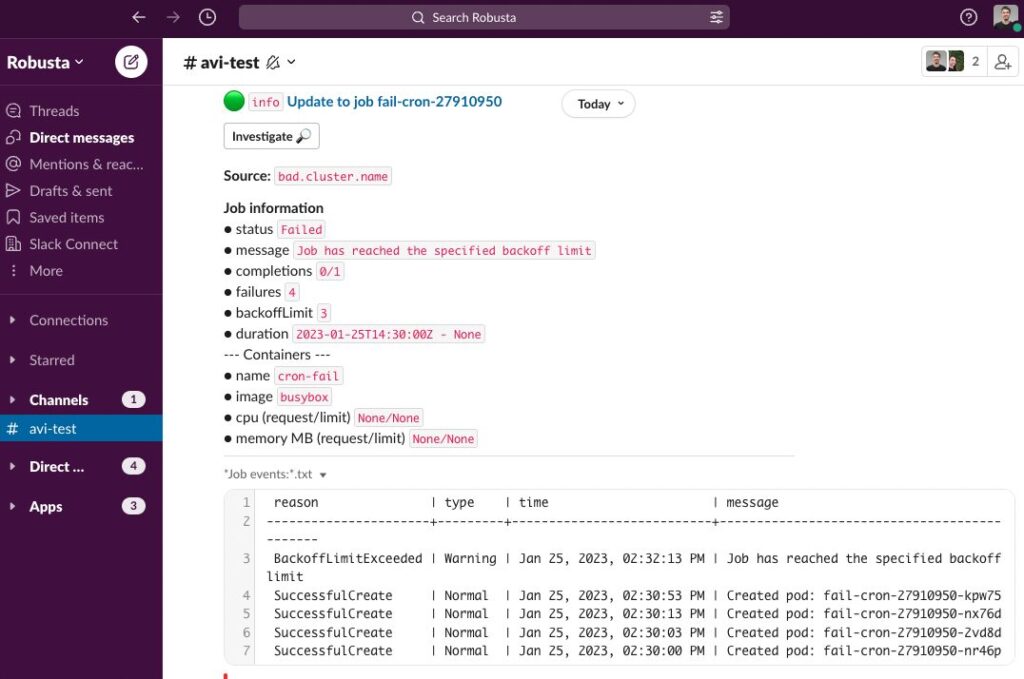
kubewatch is a simple yet effective Kubernetes tool that enhances team collaboration by notifying members about changes within the Kubernetes environment. It focuses on monitoring the state of various Kubernetes objects and sends real-time alerts to help maintain operational awareness.
By using kubewatch, teams can react more quickly to changes, making it an excellent tool for environments where maintaining up-to-date information on the state of cluster resources is critical.
Features of kubewatch:
- Event monitoring: Tracks real-time changes to important Kubernetes resources such as pods, services, and deployments.
- Flexible notification system: Supports various platforms for notifications, including Slack, Hipchat, and email, allowing teams to stay updated wherever they are.
- Configurable filters: Users can specify which events trigger notifications, minimizing noise and focusing on significant changes.
- Low overhead: Designed to have minimal impact on system resources, making it suitable for continuous background operation.
- Ease of setup: Can be easily configured and deployed within a Kubernetes cluster, facilitating immediate monitoring setup.
Source: Robusta
Learn more in our detailed guide to Kubernetes monitoring tools
Kubernetes Monitoring Best Practices
Here are some best practices to consider for a Kubernetes monitoring strategy.
Implement an Extensive Labeling Policy
An effective labeling policy is crucial for organizing and filtering Kubernetes resources, facilitating efficient monitoring and management. Labels categorize resources based on characteristics like application, environment, and version, enabling targeted monitoring and analysis.
Consistently applying labels to Kubernetes resources enhances the ability to identify and focus on specific resources or issues. Labels support more accurate monitoring, streamlined operations, and easier troubleshooting.
Preserve Historical Data
Preserving historical data is important for trend analysis, capacity planning, and incident investigation in Kubernetes environments. It provides a long-term view of performance and utilization, helping identify patterns and predict future needs.
Implementing data retention policies and leveraging storage solutions optimized for time-series data can ensure valuable historical insights are accessible when needed. This informs strategic decisions, enhances operational efficiency, and supports effective issue resolution.
Monitor the End-User Experience
Tracking the end-user experience is key to assessing the real-world performance of applications running in Kubernetes. Metrics related to page load times, transaction times, and user satisfaction scores offer direct insights into the impact of infrastructure on users.
End-user experience metrics help identify areas for improvement and validate the effectiveness of changes made within the cluster. Focusing on these metrics ensures that performance optimization efforts align with the goal of delivering a seamless user experience.
Monitor the Cloud Environment
The underlying cloud environment where Kubernetes is deployed is an important part of application and infrastructure health. Monitoring this involves tracking cloud-specific metrics like instance performance, network latency, and cloud service availability.
Integrating cloud environment monitoring with Kubernetes metrics offers a holistic understanding of performance and potential issues. It enables informed decisions regarding resource allocation, cost optimization, and architectural adjustments for improved reliability.
Conclusion
Kubernetes monitoring is an essential practice for managing complex containerized environments, ensuring they run smoothly and efficiently. By adopting the best practices outlined, teams can overcome the inherent challenges of Kubernetes’ dynamic nature, such as managing ephemeral components and ensuring security and compliance.
Effective monitoring strategies provide deep insights into system performance, resource utilization, and user experience, facilitating proactive management and optimization of Kubernetes clusters. As Kubernetes continues to evolve, staying ahead with a robust monitoring framework will be key to leveraging its full potential for scalable, resilient applications.
Learn more about Coralogix for Kubernetes monitoring
See Additional Guides on Key DevOps Topics
Together with our content partners, we have authored in-depth guides on several other topics that can also be useful as you explore the world of DevOps.
kubectl Cheat Sheet
Authored by Komodor
- The Ultimate Kubectl Command Line Cheat Sheet
- How to Restart Kubernetes Pods & Containers with kubectl
- kubectl apply: Syntax, Examples, kubectl apply vs. create/replace
FinOps
Authored by Anodot
- Understanding FinOps: Principles, Tools, and Measuring Success
- FinOps Framework: 2024 Guide to Principles, Challenges, and Solutions
- What is Cloud Cost Management? – Anodot Complete Guide
Cloud Cost Optimization
Authored by Anodot


