The new standard of observability is here. Discover Olly, the industry’s first
Kubernetes Service Monitoring with Prometheus: A Practical Guide

What Is a Prometheus CRD (Custom Resource Definition)?
Prometheus custom resource definitions (CRDs) extend Kubernetes capabilities, allowing users to define and manage custom resources specific to Prometheus. These CRDs include AlertmanagerConfigs, PodMonitors, Probes, ServiceMonitors, and ThanosRulers.
The use of CRDs simplifies the configuration and management of Prometheus within a Kubernetes cluster, enabling dynamic service discovery and monitoring configuration, which traditional static configurations lack.
CRDs provide a standard approach to embedding Prometheus configurations within Kubernetes manifests. This integration allows for declarative infrastructure management, where configurations are applied using Kubernetes-native tools.
How a Prometheus CRD Works
Prometheus CRDs function by extending the Kubernetes API to manage Prometheus configurations through Kubernetes-native tools. Here’s an overview of how these CRDs operate:
- Definition and registration: CRDs are defined using YAML files, specifying the custom resources and their schemas. Once defined, these CRDs are registered with the Kubernetes API server, making Kubernetes aware of the new resource types.
- Resource creation: Users create custom resources (like ServiceMonitors, PodMonitors, etc.) based on the registered CRDs. These resources are defined in YAML manifests, detailing the configuration and specifications for Prometheus to monitor the desired services, pods, or endpoints.
- Controller logic: The Prometheus Operator watches for changes in these custom resources. It acts as a controller, ensuring that the desired state defined by the custom resources is maintained. For example, if a new ServiceMonitor is created, the Prometheus Operator updates the Prometheus configuration to start scraping the specified endpoints.
- Dynamic configuration: The use of CRDs allows for dynamic and declarative configuration. As services are added or removed, corresponding custom resources can be created or deleted, automatically updating Prometheus’ monitoring scope without manual configuration changes.
- Integration with the Kubernetes ecosystem: By leveraging CRDs, Prometheus configurations benefit from Kubernetes features like namespaces, labels, and selectors. This integration provides a scalable way to manage monitoring configurations, ensuring they are consistent with the rest of the Kubernetes-managed infrastructure.
What Is a Service Monitor in Prometheus?
A ServiceMonitor is a specialized custom resource in Prometheus CRD that defines how services should be monitored. It specifies the endpoints of services and the configurations needed to scrape metrics from those endpoints. By using ServiceMonitors, users can dynamically configure Prometheus to adapt to changes in the service landscape.
ServiceMonitors allow for fine-grained control over which services Prometheus monitors and how it does so. This includes defining selectors to identify target services, specifying endpoints, and configuring scrape intervals and paths. The integration of ServiceMonitors into Kubernetes workflows makes it easier to maintain visibility over complex microservices architectures.

Tutorial: Using Service Monitoring in Kubernetes
In this tutorial, we will walk through the process of setting up a ServiceMonitor in Prometheus to monitor Kubernetes services. By the end of this guide, you will understand how to configure Prometheus to automatically scrape metrics from services within a Kubernetes cluster using ServiceMonitors.
Step 1: Verify Service Labels
First, identify the labels of the service you want to monitor. Use the kubectl describe command to view the details of the prometheus-operated service created by the Prometheus Operator:
kubectl describe service prometheus-operated --namespace prometheus
The output should look similar to this:
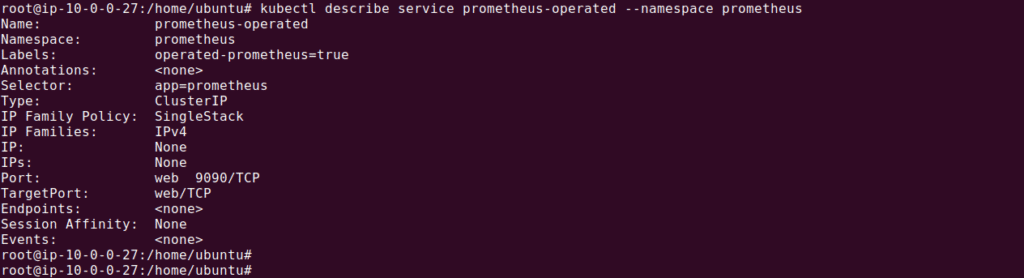
Note the label operated-prometheus=true, which we will use in our ServiceMonitor.
Step 2: Create the ServiceMonitor YAML
Next, create a ServiceMonitor resource that targets the service we identified. Create a file named servicemonitor.yaml and add the following configuration:
apiVersion: monitoring.coreos.com/v1
kind: ServiceMonitor
metadata:
  name: prometheus
  namespace: prometheus
  labels:
    serviceMonitorSelector: prometheus
spec:
  endpoints:
  - interval: 20s
    targetPort: 9090
    path: /metrics
  namespaceSelector:
    matchNames:
    - prometheus
  selector:
    matchLabels:
      operated-prometheus: "true"
This YAML defines a ServiceMonitor that scrapes the /metrics endpoint of the prometheus-operated service every 20 seconds.
Step 3: Apply the ServiceMonitor
Apply the ServiceMonitor configuration to your Kubernetes cluster:
kubectl apply -f servicemonitor.yaml

Verify that the ServiceMonitor was created successfully:
kubectl get servicemonitor --namespace prometheus
You should see an output similar to this:

Step 4: Update the Prometheus Resource
To instruct the Prometheus Operator to use the ServiceMonitor, update the Prometheus resource configuration to include the serviceMonitorSelector. Edit the prometheus.yaml file and add the following section:
apiVersion: monitoring.coreos.com/v1
kind: Prometheus
metadata:
  name: prometheus
  namespace: prometheus
spec:
  serviceMonitorSelector:
    matchLabels:
      serviceMonitorSelector: prometheus
# other configurations
Apply the updated Prometheus configuration:
kubectl apply -f prometheus.yaml

Step 5: Verify the Configuration
After a few moments, the Prometheus Operator will update the Prometheus instance with the new scrape configuration. To verify, open the Prometheus UI and navigate to Status, then Targets:
kubectl port-forward svc/prometheus-operated 9090:9090 --namespace prometheus

Open your browser and go to http://localhost:9090/targets. You should see the prometheus-operated service listed as a scrape target.
You can also query metrics in the Prometheus UI. For example, type prometheus_build_info in the query box and click Execute. This should display build information metrics for the Prometheus instance.
Related content: Read our guide to Kubernetes Metrics
Kubernetes Monitoring with Coralogix
Coralogix sets itself apart in observability with its modern architecture, enabling real-time insights into logs, metrics, and traces with built-in cost optimization. Coralogix’s straightforward pricing covers all its platform offerings including APM, RUM, SIEM, infrastructure monitoring and much more. With unparalleled support that features less than 1 minute response times and 1 hour resolution times, Coralogix is a leading choice for thousands of organizations across the globe.