Complete observability
Zero compromises
Ingest all your data, store it indefinitely on your cloud, and query across all types with a unified syntax. Upgrade to a platform that extends observability beyond engineering.


Trusted by thousands of engineers worldwide
Coralogix is trusted by thousands of engineers around the world.
Ingest everything,
store forever
Eliminate data blind spots
Coralogix’s Streama© engine eliminates excessive sampling and limited retention, enabling more data ingestion and real-time insights at a fraction of
the cost.
Monitor 4x more for a lower cost
Scale to petabytes of data with long-term retention
Coralogix
Any event,
one query language
Stop wasting time on multiple syntaxes
Coralogix’s DataPrime proprietary engine unifies logs, metrics, and traces in a single query – using aggregations, joins, and advanced queries to reveal the story behind every incident.
Easily composable, linear syntax
Built-in querying copilot to minimize mistakes
Your data,
your control
Break free from the trap of vendor lock-in
Coralogix gives you the freedom to keep data in your own cloud storage bucket for total flexibility of your data, full control, and zero vendor lock-in.
Open format storage ensures full flexibility
Capture every event , no indexing required
Real-time observability, redefined
Real-time telemetry
Capture 100% of logs, metrics, traces, and profiles as they happen, eliminating any blind spots.
Dynamic schema handling
No need for predefined schemas, our DataPrime engine handles automatic detection and advanced discovery.
Petabyte-scale retention
Grow without limits and keep your data accessible for long-term insights.
300+ integrations
Connect instantly to AWS, Terraform, Azure and more.


24/7 real human support
Reach live experts in under
30 seconds. Any time, any day.
Alerts & root cause analysis
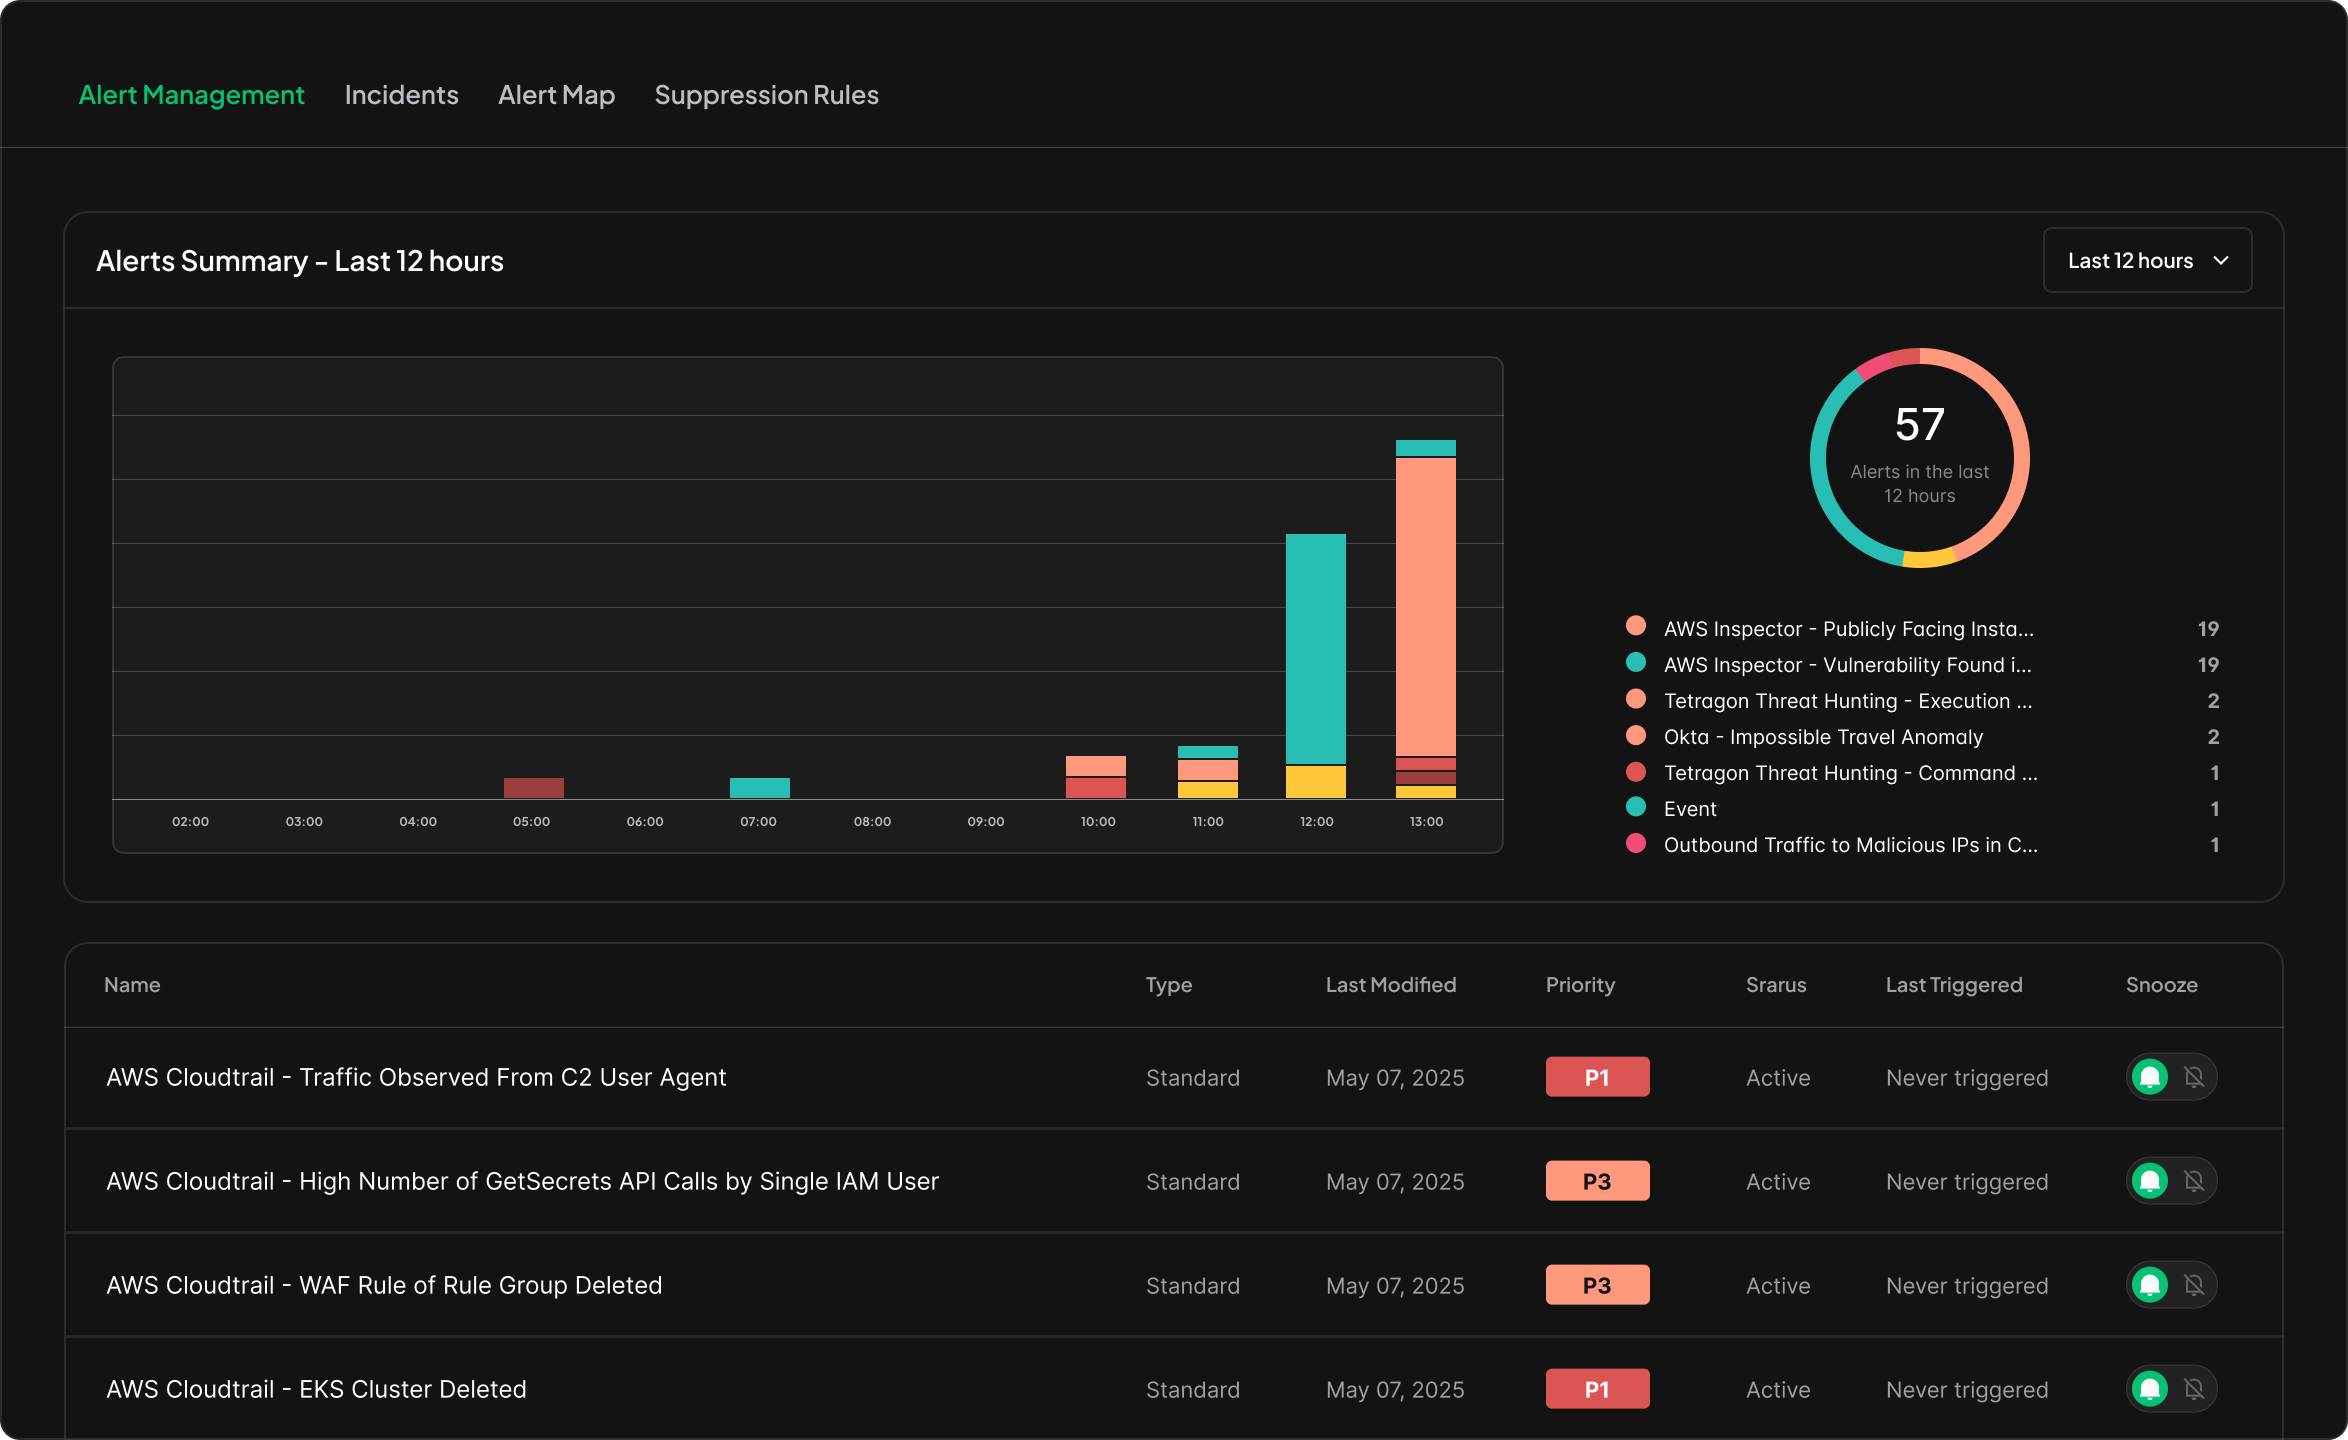
Detect anomalies in real time and quickly pinpoint issues at their source.
Native OTel support
All data stored in open formats with no vendor lock-ins.
Ingest way more…
for the same exact cost
Your observability data holds crucial insights about your business. Data sampling can risk missing out on important signals that drive key decisions.
Coralogix’s TCO Cost Optimizer maximizes data value by sending critical logs to instant in-stream analysis and low-value data straight to cloud storage.
The AI Center Advanced AI observability for any agent
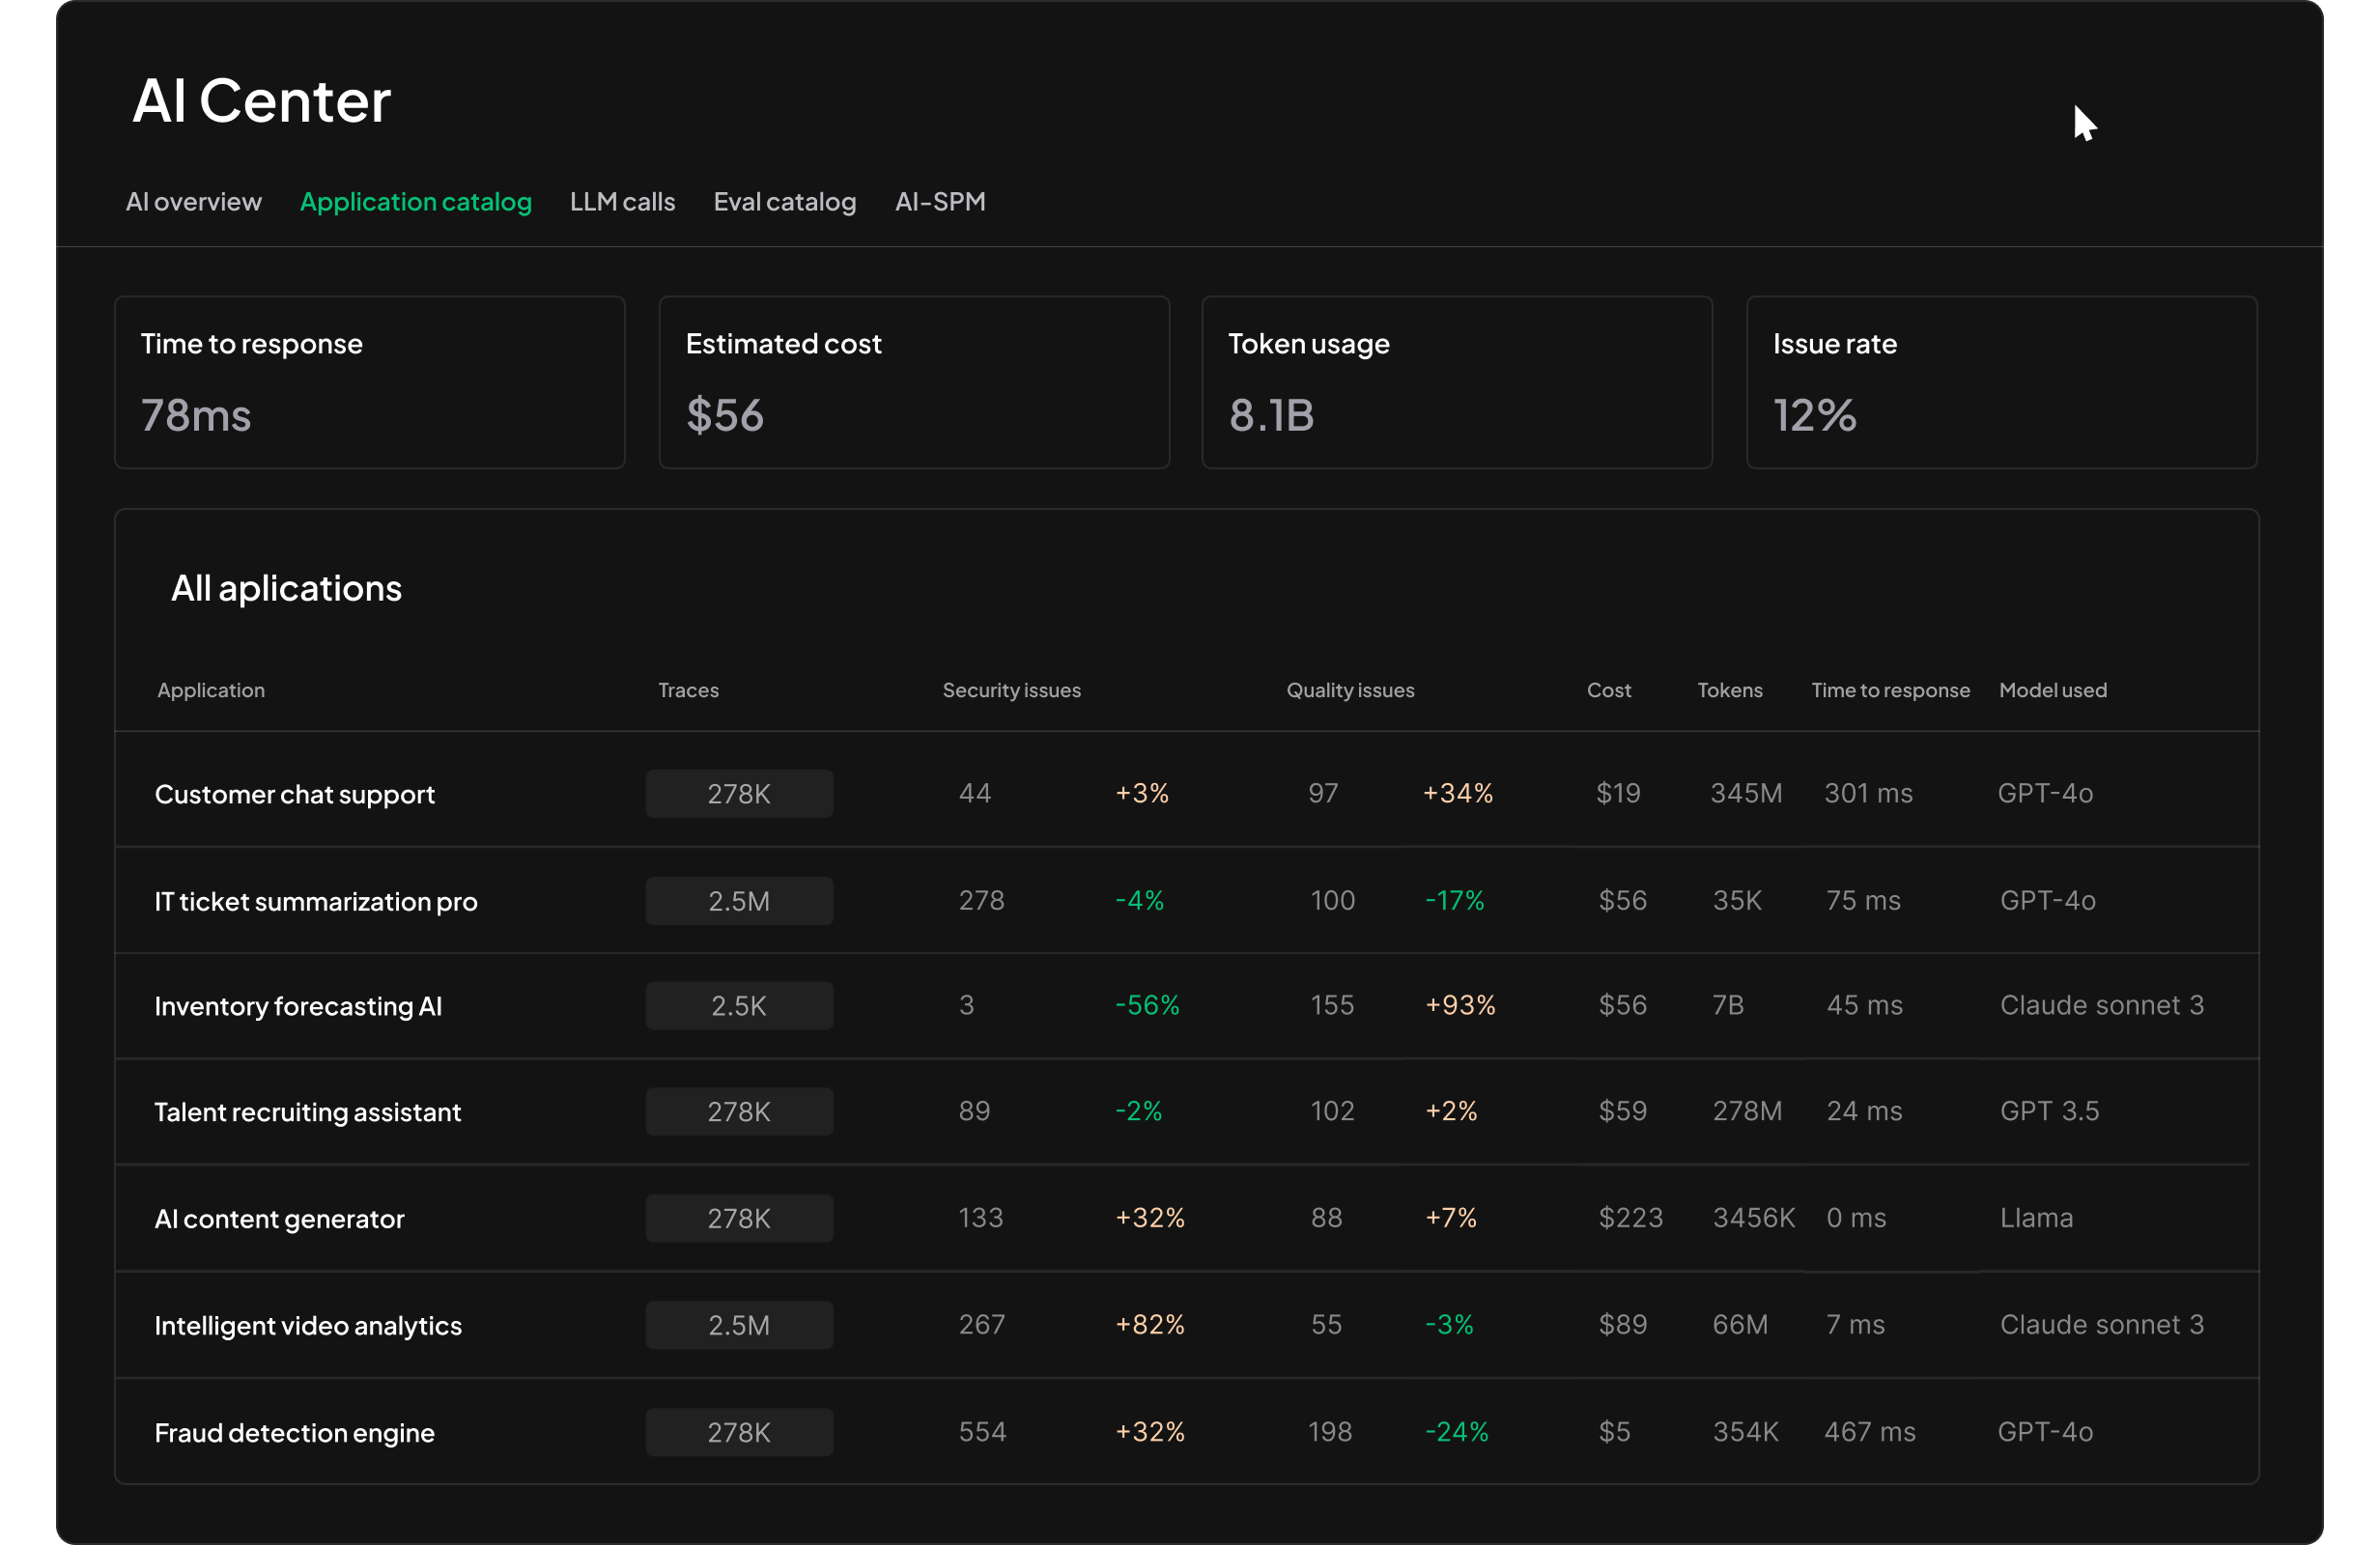
AI introduces complexities that traditional observability can’t handle. To solve this problem, we built a specialized evaluation engine to provide real-time observability for all your agents.
AI discovery
including custom evals tailored for you
Scan and identify all AI agents and repositories in use across your entire organization.
AI observability
including custom evals tailored for you
Monitor every agent’s performance, session behavior, cost, and operational metrics to prevent issues.
AI guardrails
including custom evals tailored for you
Enforce safety and quality messages by intercepting, modifying, or blocking prompts and responses.
AI security & compliance
including custom evals tailored for you
Dedicated insight into your AI stack’s risk posture with security-focused dashboards and evaluators.


