Save the logs, save the planet: How to make your observability stack greener


If data centres were a country, they’d rank fifth in electricity consumption by 2026. Over the past few years, the resulting carbon footprint of the technology industry has sparked the fast-growing green software movement, led by the Green Software Foundation. How can we continue to innovate software in a way that also minimises its impact on the environment?
This has been a fascinating problem I’ve been exploring for a few years now. But having recently joined Coralogix, I’ve now been investigating how your observability stack can also be refined to reduce your carbon footprint.
Data centres consume as much electricity as Saudi Arabia
All software runs on hardware, and that ultimately has a carbon footprint. Alongside electricity use, the water required to cool servers and the carbon produced through manufacturing servers also contribute to the overall carbon footprint of data centres.
In 2022, data centres used around 460 terawatt hours of electricity. If they were a country, that would make them the 11th largest consumer in the world, sitting between Saudi Arabia and France. By 2026, that figure is expected to more than double to 1,050 terawatt hours. This would push data centres up to fifth place globally, between Japan and Russia.
What about AI?
The scale of AI compounds this further. OpenAI is currently building a new data centre in Texas. When operational, it is expected to emit 3.7million tons of Co2 equivalents per year – roughly equivalent to the entire electricity consumption of Iceland.
Aren’t we already using lots of renewable energy?
Cloud providers often promote their investments in renewable energy, but that doesn’t mean every data centre runs on clean power. Many of these investments are through agreements that fund renewables elsewhere on the grid. With only 32% of global electricity coming from renewable sources in 2024, it’s still vital to keep innovating how we build software in an energy efficient way to accelerate the transition towards 100% renewable power.
How does observability contribute to carbon footprint?
Every company running software is generating huge amounts of telemetry that is then stored, replicated, indexed, queried, and sometimes forgotten about – all while consuming electricity.
We talk a lot about reducing the energy costs of your application itself, or using observability tooling to calculate the carbon footprint costs. But what about the observability stack itself? Telemetry today produces huge amounts of data. Netflix for example ingests two million events per second, and processes 115 billion new rows daily.
Through storage, indexing and querying costs, observability can become quite resource intensive. It’s also common to retain data for longer than necessary. On top of that, AI workloads also need to have observability, adding to the growing volume of data.
FinOps makes the business care, GreenOps makes everyone care
We already think about cost efficiency – FinOps practices to improve cloud cost efficiency are well established. Many cost-saving actions also reduce your carbon footprint.
But I’ve found that for many engineers, sustainability can be a more motivating goal than pure cost reduction.
How to start making your observability stack greener
Carbon aware data storage
Some data centre regions have cleaner energy grids than others. So, when you know what you want to store, where you store that data is an important question.
According to data from Climatiq, running a t3a.medium instance for 1,000 hours in us-east-1 produces 2.9 kg CO₂e, while the same workload in ap-southeast-2 generates 5.3 kg CO₂e.
If you’re storing your telemetry data in an S3 bucket, you can simply choose to locate it in a greener region. Climatiq has put together a helpful heatmap ranking the carbon intensity of AWS, GCP and Azure data centre regions to help you to decide.
Reducing the amount of telemetry data consumed
The volume of telemetry data you’re generating can grow rapidly. OpenTelemetry provides a flexible, open standard for collecting that data. It’s easy to add rules to your processor to control the data flow at the start of the pipeline.
Intentionally filter, sample or parse logs to reduce noise from logs that might not add much value and cut energy costs. In your OpenTelemetry collector, you can use the filterprocessor.
In this demo, any logs generated by the “load-generator” service are ignored before they are sent to your observability platform.
This section is added under the processors section in your values.yaml file:
filter/ottl:
 error_mode: ignore
 logs:
   log_record:
     - 'attributes["otelServiceName"] == "load-generator"'
Make sure the rule is applied by adding the processor into the service section under pipelines then logs; the filter/ottl processor.
logs:
  processors: [filter/ottl, memory_limiter, resourcedetection, resource, batch]
  exporters: [debug, coralogix]
Some other actions to reduce telemetry data are:
- Implementing open telemetry tail sampling to ensure you’re only getting relevant data and not bloating observability platform with data that isn’t useful like a whole lot of successful logs.
- Setting up parsing rules to simplify complex json when you don’t need all that information.
- Reducing cardinality or unique series per metric for less important information.
Directing data to the right type of storage
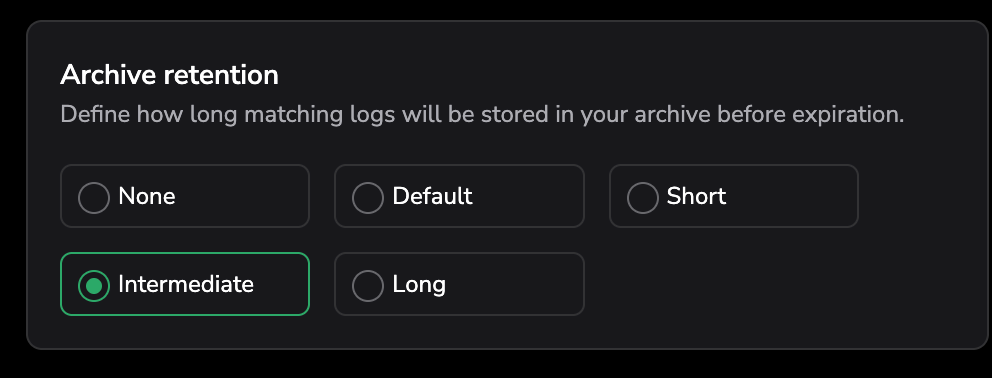
It’s easy to say “store less data”, but in practice you often will need to retain certain logs, metrics, and traces for regulatory reasons like auditing and compliance. A greener approach here is to pre-determine where different types of data should be stored and what the lifecycle policy on that type of data is.
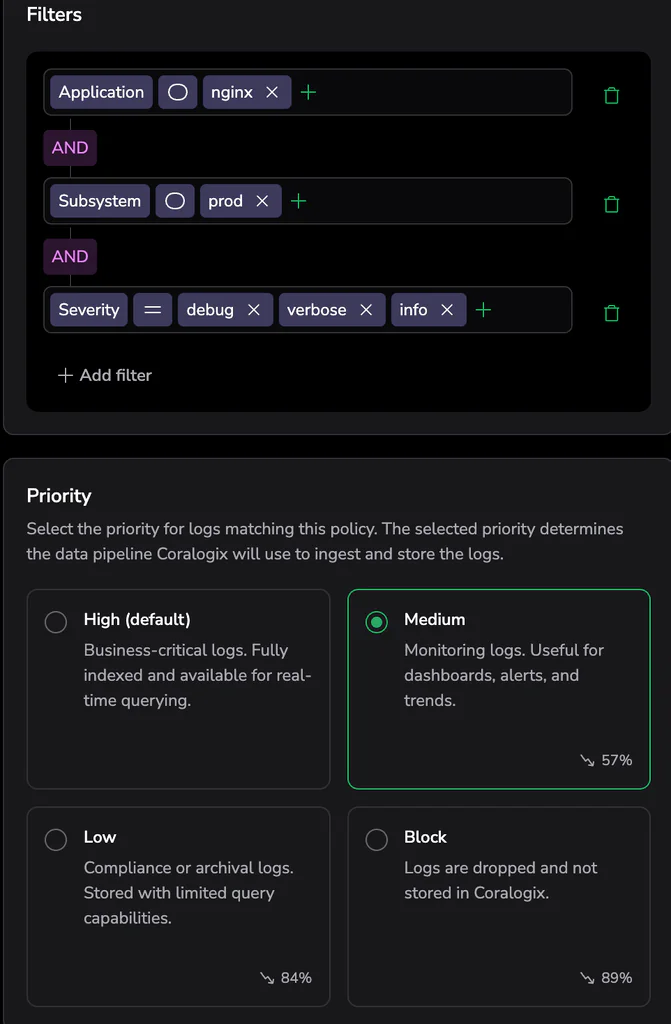
With Coralogix, you can set up policies for different types of data and route them into different storage tiers. For example, keeping frequently searched data indexed and searchable, while sending the bulk of your data to a monitoring tier that can be easily queried while not needing to be indexed or a compliance tier in archive storage – saving a lot of energy demands. The Total Cost of Ownership optimiser also shows you the predicted reduction in units compared to your baseline.
Setting a rule depending on a filter :
Different types of data can have different data retention policies too – instead of setting a longer default period for everything.
These strategies balance visibility with efficiency, reducing both cost and energy use.
Architecting OpenTelemetry for efficiency
OpenTelemetry collectors on Kubernetes are commonly set up using either DaemonSet or SideCar patterns. Research comparing different OpenTelemetry Collector architectures found that DaemonSet deployments consistently used fewer resources than sidecars, reducing CPU and memory overhead across the cluster.
Observability is a key part of your technology stack, so it’s important to think about how it contributes to the overall carbon footprint of your software. Being intentional with how you set up your pipelines means you can set and forget it, while the small choices add up to a larger impact over time.