Key Metrics & KPIs for GenAI Model Health Monitoring

Monitoring AI model health is essential for ensuring models perform accurately, efficiently, and reliably in real-world settings. As AI systems grow in complexity, they can exhibit unexpected behaviors or degrade over time, creating risks for business operations and user experience.
By systematically tracking key metrics and Key Performance Indicators (KPIs), you gain visibility into issues and opportunities for improvement, forming an early warning system when something goes awry.
Today’s organizations depend on AI to power critical tasks—from patient diagnostics in healthcare to automated customer service bots. Effective AI observability goes beyond checking code logs; it requires monitoring performance metrics (such as accuracy and latency), data quality (completeness and validity), and user feedback to capture the system’s end-to-end health.
This article outlines the core metrics and KPIs for managing AI model health. By prioritizing these metrics, teams can track accuracy and speed, prevent costly downtime, optimize costs, and deliver value to users continuously.
TL;DR
- Monitor generative AI with metrics like hallucination rates and response times to ensure reliable, accurate outputs and optimal user experience.
- Track cost per token and total expenses to optimize resource usage in large language models while maintaining generation quality.
- Analyze user feedback across categories (accuracy, relevance, completeness, tone) to identify specific improvement areas in your GenAI systems.
- Use span latency analysis to pinpoint bottlenecks in complex AI pipelines, with model inference typically consuming most processing time.
- Measure user engagement patterns to identify where and why users abandon conversations, helping improve completion rates and overall satisfaction.
Performance Metrics
Performance metrics capture how well your AI model is functioning against predefined benchmarks. Monitoring these KPIs helps ensure your system produces accurate results and operates efficiently under real-world conditions.
1. Evaluators (Evals) Error Rate
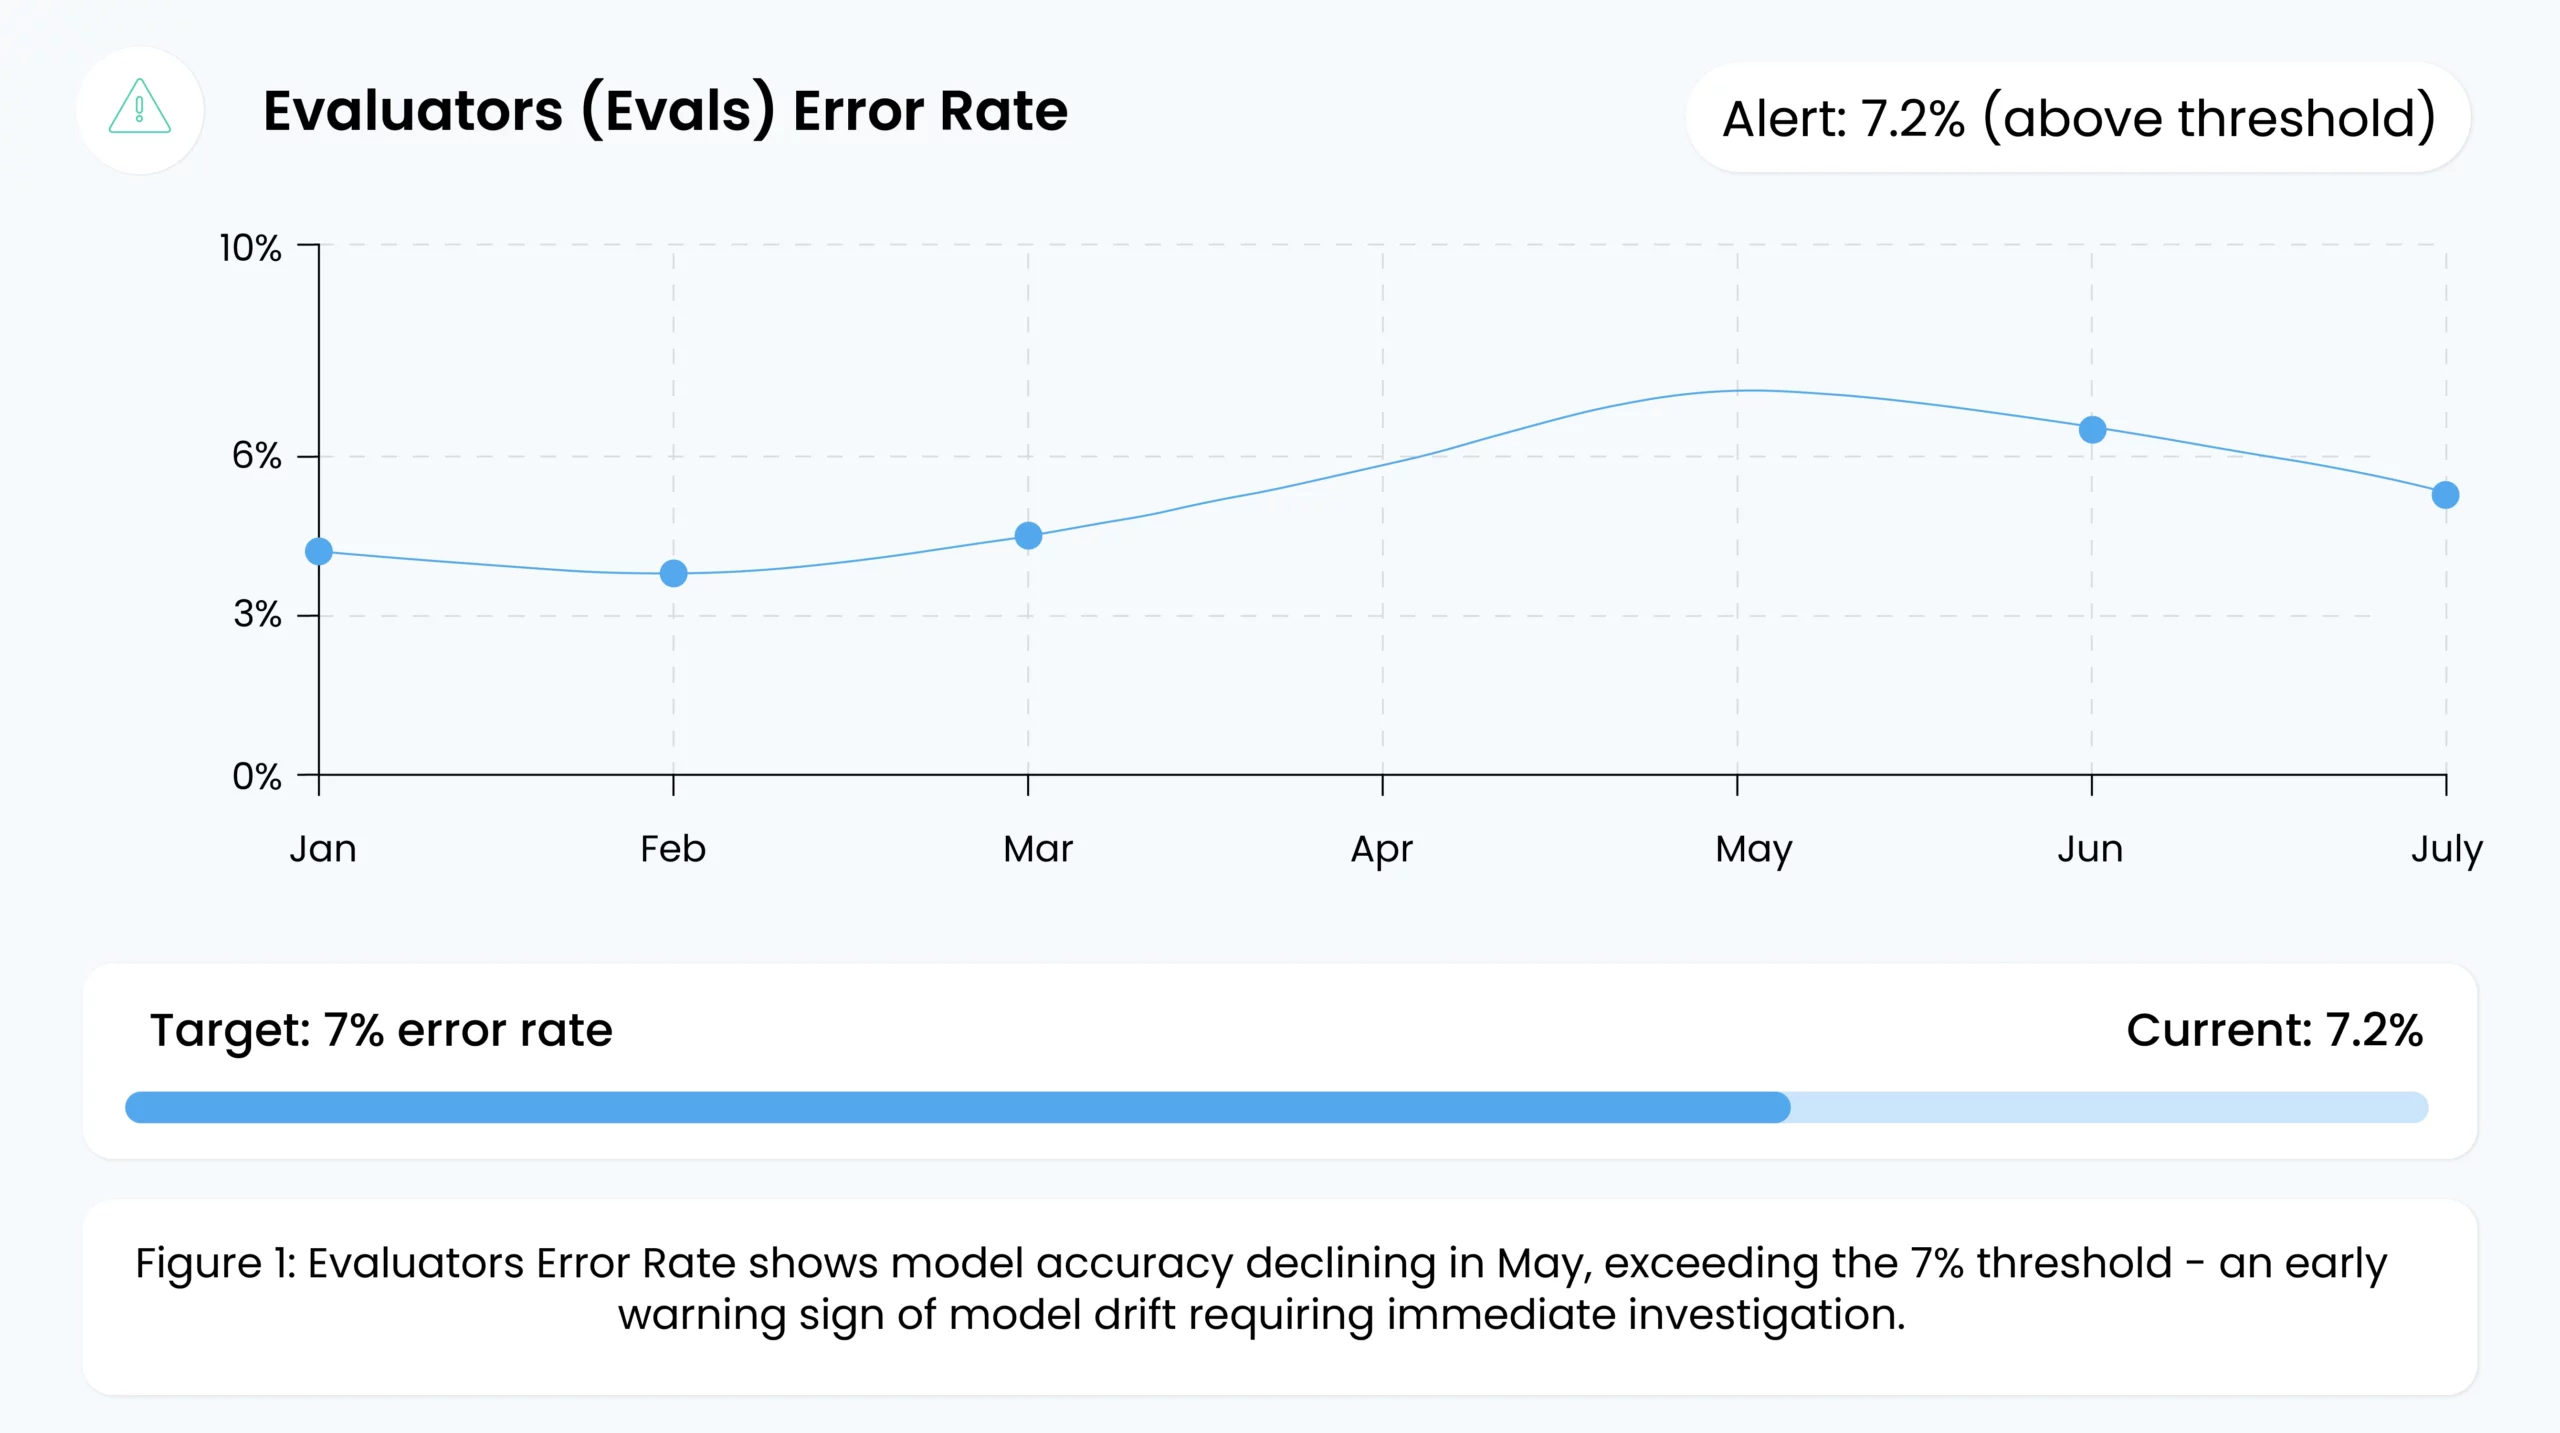
Evals error rate is the percentage of mistakes a model makes on evaluation datasets or specific tests. An evaluator in AI is essentially a tool or procedure designed to measure performance on a specific criterion—accuracy, toxicity, bias, or resilience against prompt injections. For example, an evaluator might check for hallucinations (incorrect factual statements) or security vulnerabilities (prompt injection), especially in generative AI systems.
When the error rate rises, it may indicate:
- Frequent Hallucinations or Domain Mismatch: The model’s responses become increasingly inaccurate or nonsensical compared to expected outputs in generative tasks.
- Security or Misbehavior by the User: Elevated error rates may point to attempts at prompt injection or malicious inputs.
- Accidental Security Breach or Misbehavior from the AI: The AI might generate problematic content (e.g., violating internal policies or compliance rules).
By closely monitoring this metric, teams can quickly detect performance degradation and set alerts to intervene if thresholds are exceeded.
2. Precision and Recall
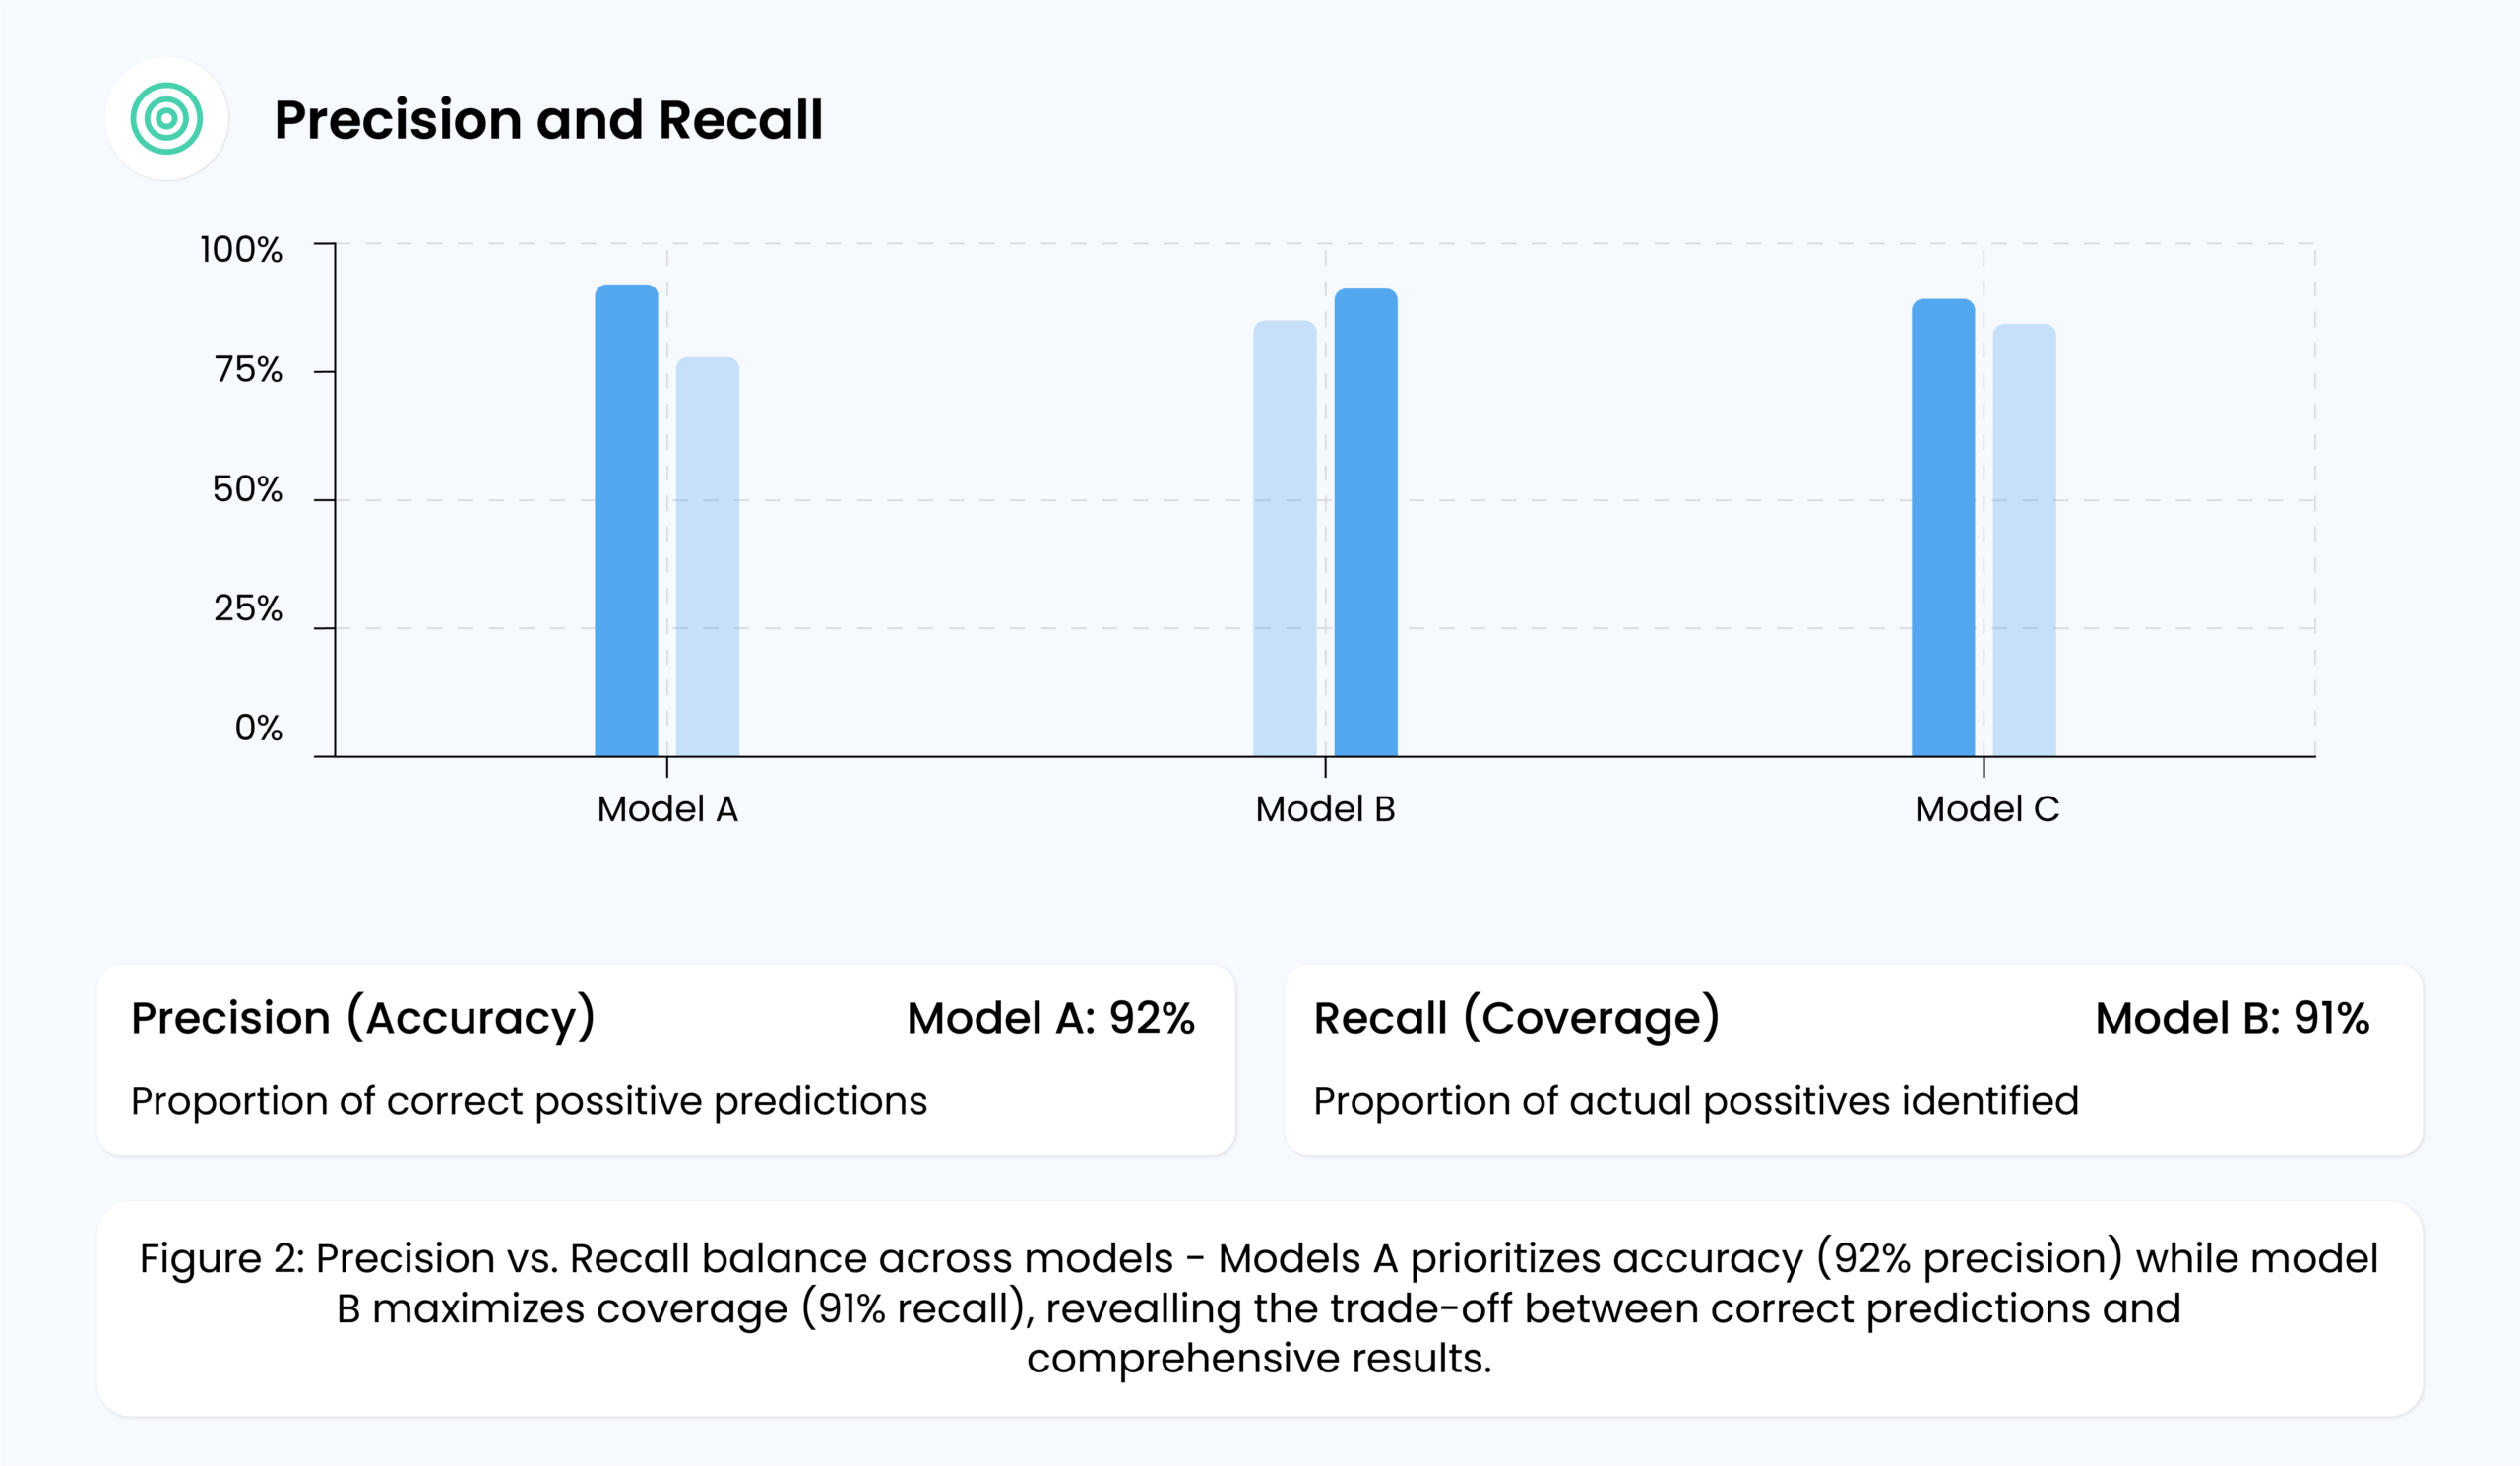
Precision measures how coherent, factual, or contextually relevant the model’s responses are, while Recall reflects how well the output aligns with the user’s prompt or intent. For instance, a high-quality response has minimal hallucinations, stays on-topic, and follows brand or compliance guidelines.
Monitoring these aspects over time helps identify biases or recurring inaccuracies without overwhelming users with false or irrelevant responses. Consistent tracking ensures your generative AI continues delivering outputs that match user expectations and organizational standards—without drifting into off-topic or misleading content.
3. Response Time
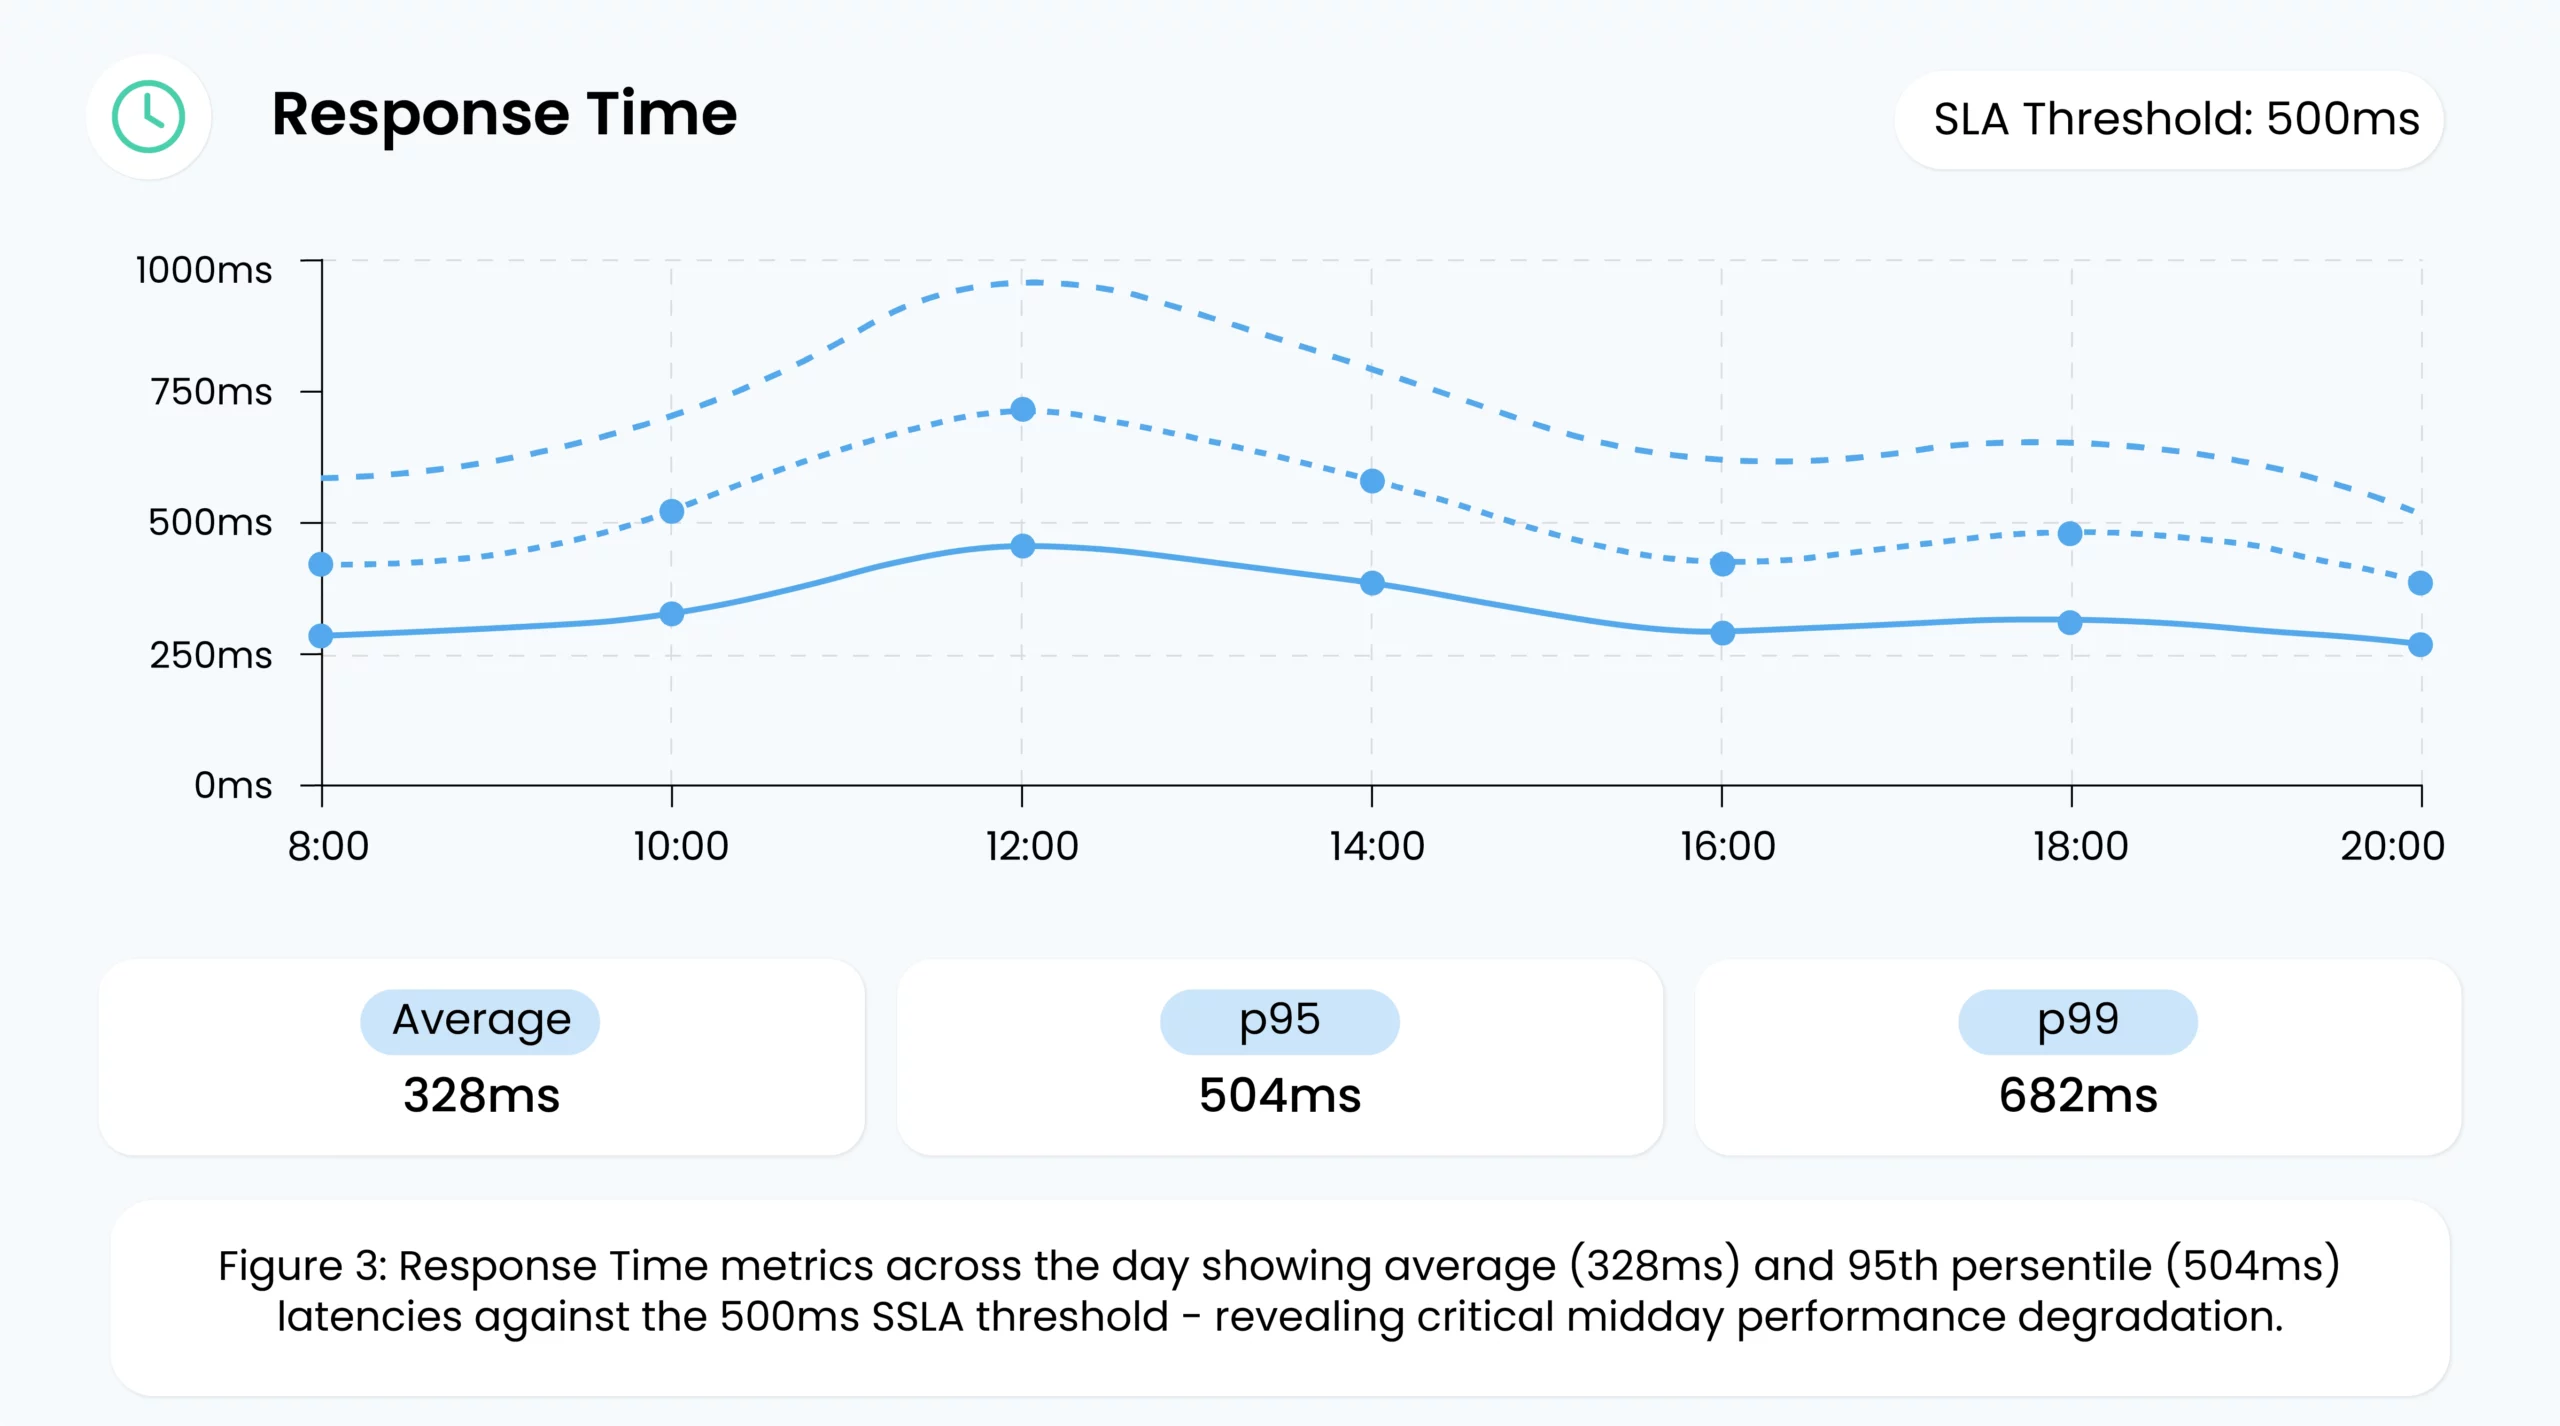
Response time (latency) reflects how quickly the model returns an output. Slow responses can seriously degrade the user experience, lead to underwhelming performance, and even violate service-level agreements (SLAs). For a customer-facing chatbot, extra seconds of latency could frustrate users, causing them to abandon the interaction. Common culprits for high latency include:
- Suboptimal Infrastructure: Insufficient or misconfigured hardware/resources.
- Inefficient Code: Poorly optimized inference pipelines.
- Large Input Sizes: AI models bogged down by massive requests.
Monitoring and setting alerts on average and peak latency ensure teams can swiftly troubleshoot and maintain consistent performance.
4. Span Latency
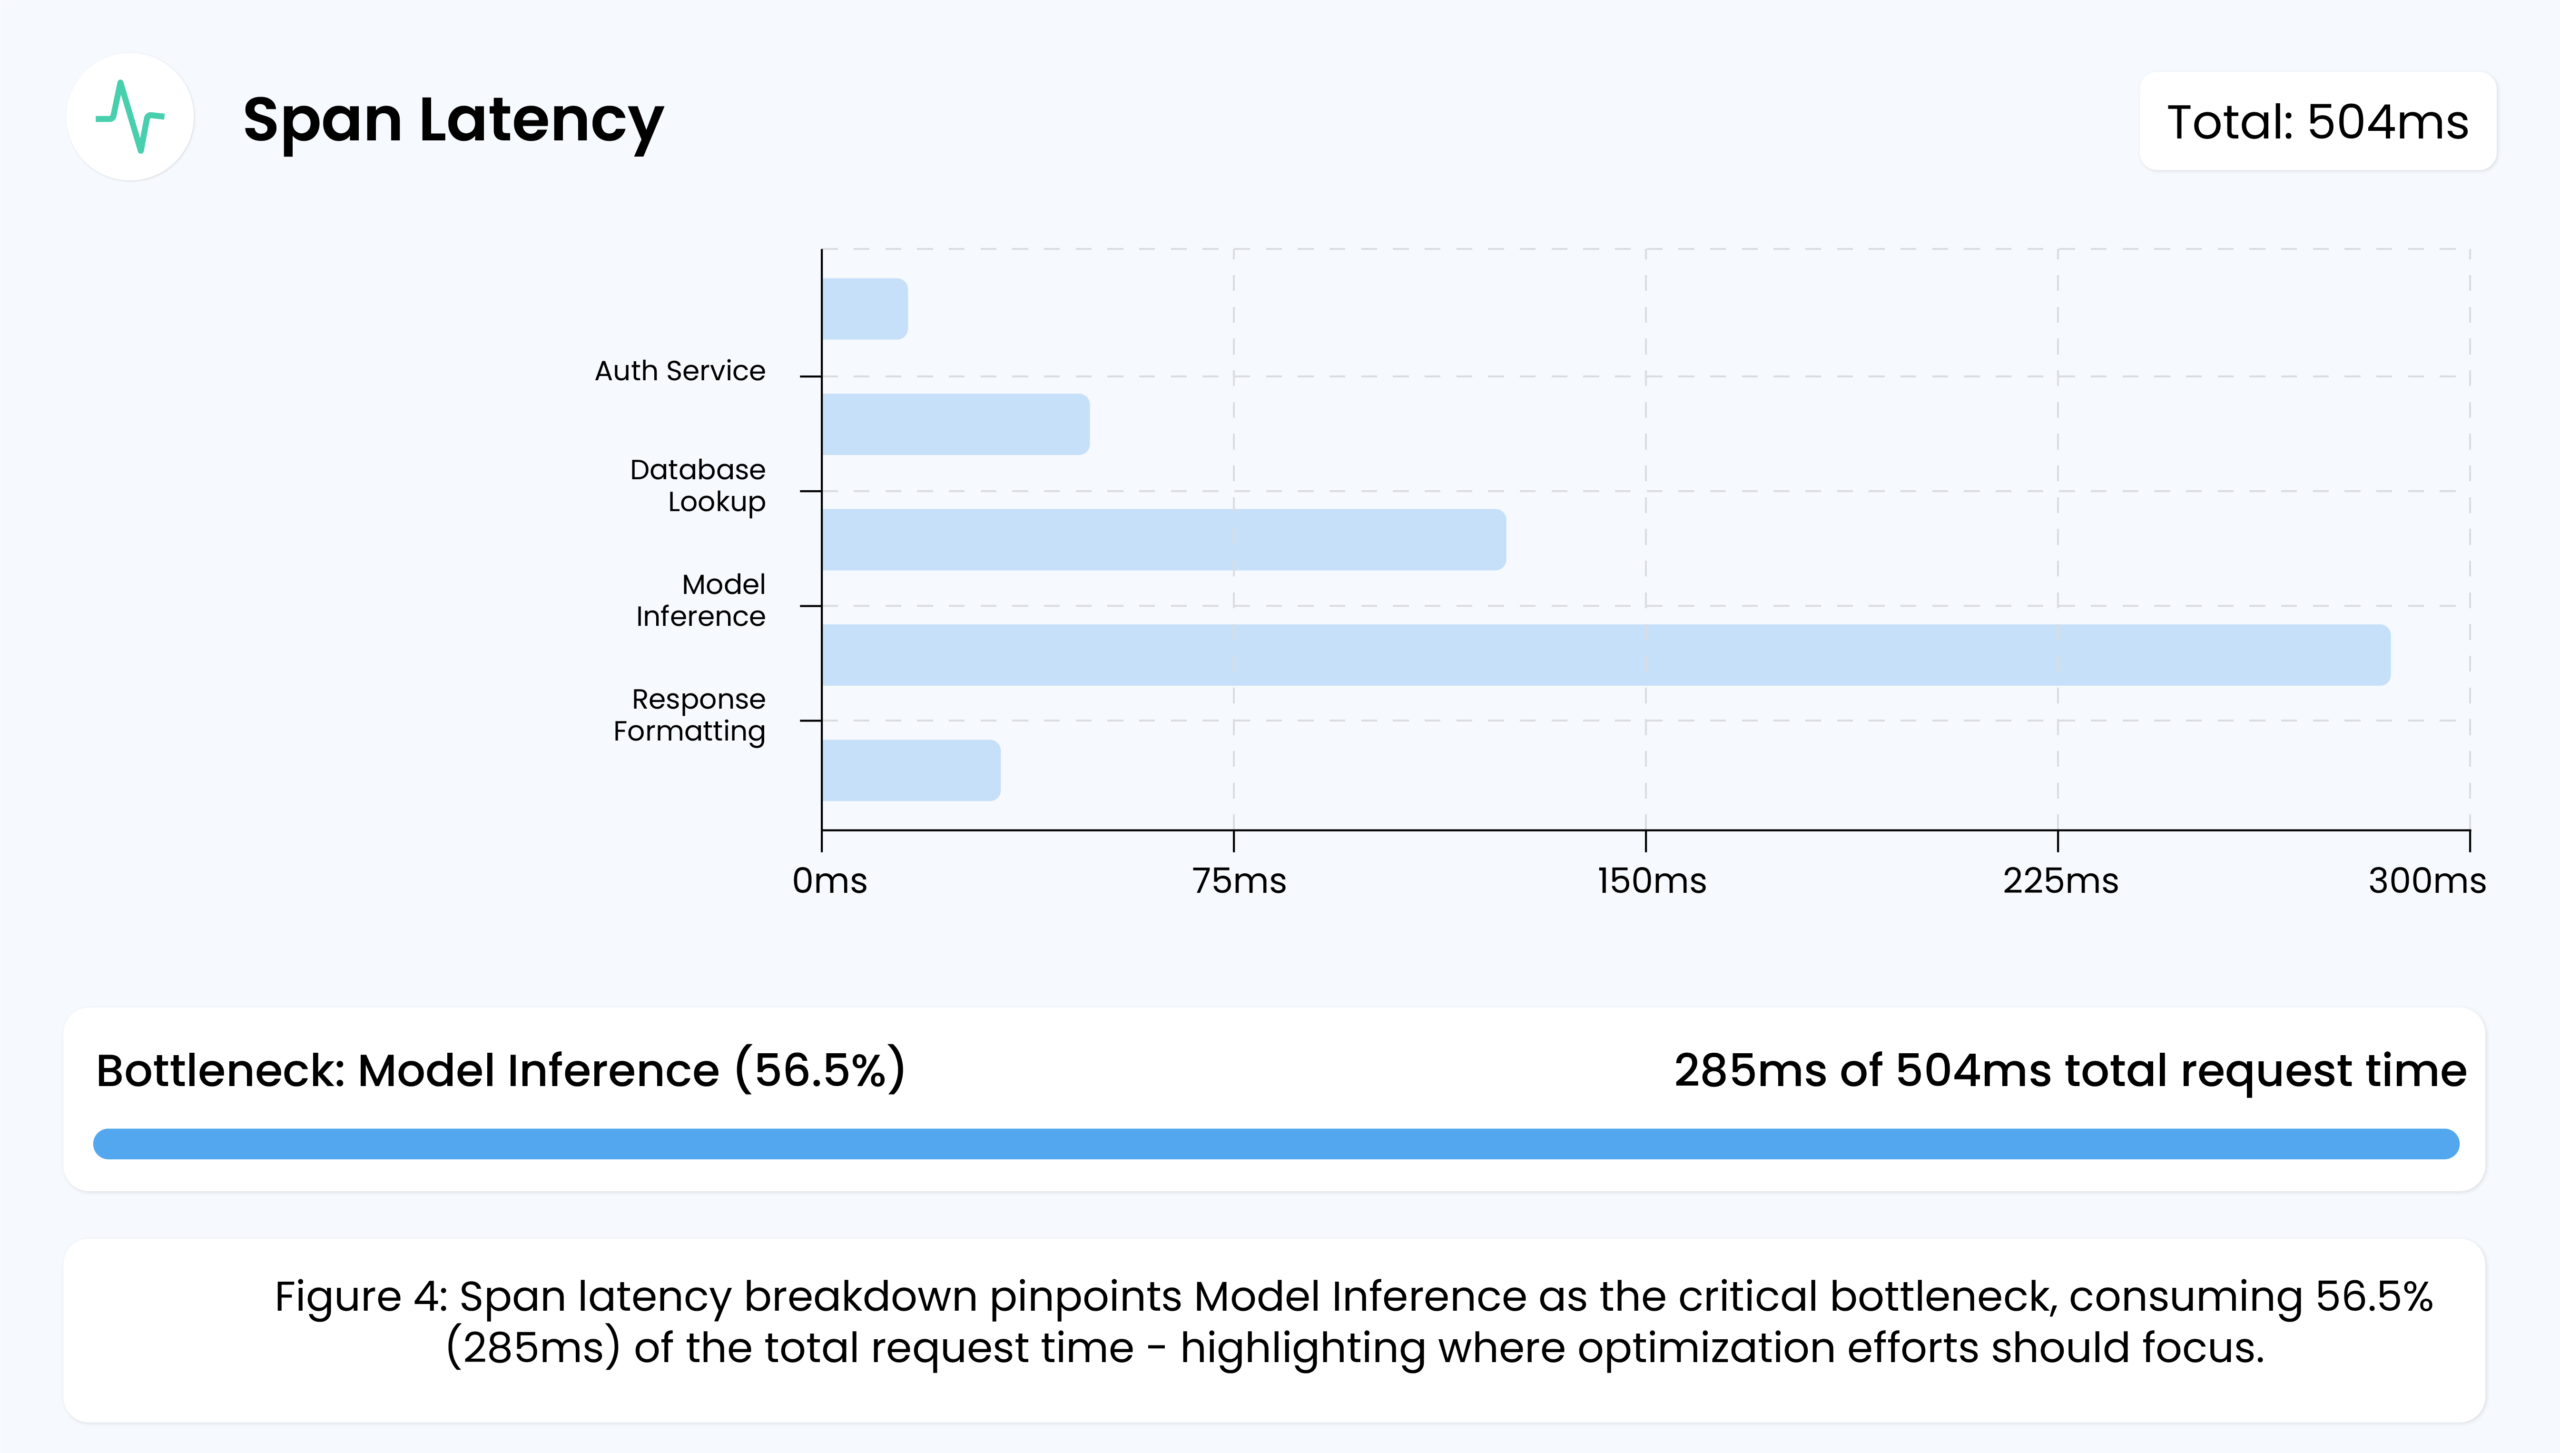
In distributed AI applications, a single request often consists of multiple segments called “spans.”
Think of each span as a step in a conveyor belt: one span could be fetching external data while another is performing the actual model inference. Span latency measures the time each step (or span) takes, helping teams pinpoint exactly where slowdowns occur.
Example: Suppose a user query travels through a load balancer, then a database lookup, then the AI model for inference. If logs show the database step (one span) takes significantly longer than the rest, you can focus on optimizing that database call or scaling resources for it. This detailed view prevents guesswork and speeds up problem resolution.
5. Errored Spans
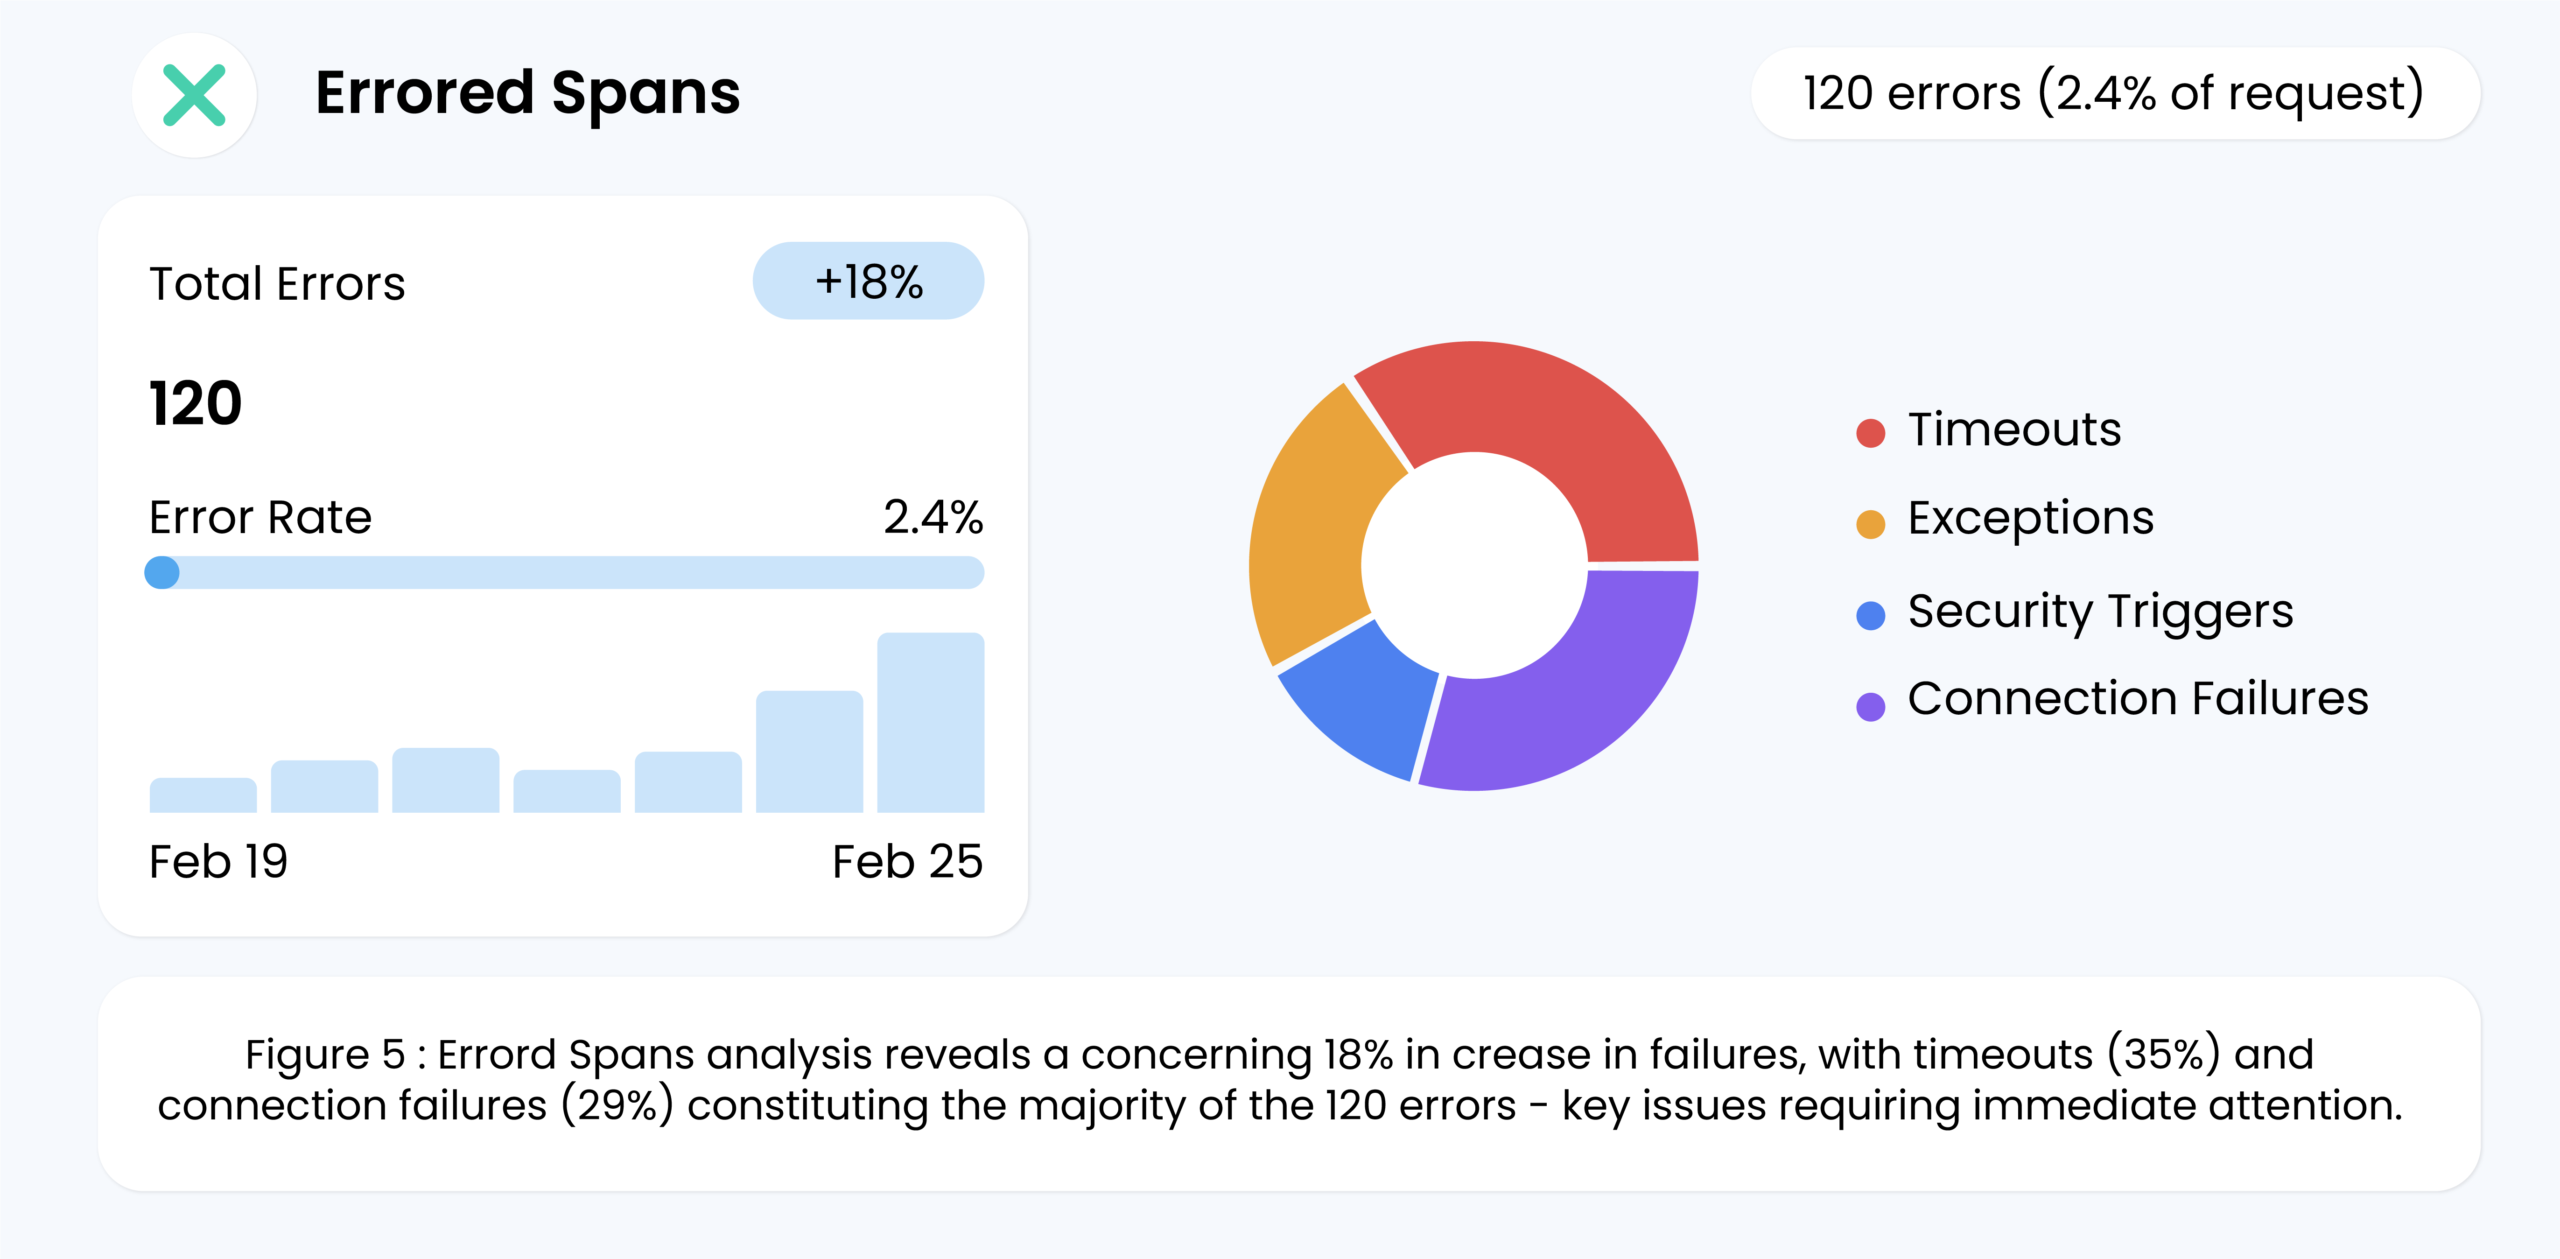
Even if the model’s predictions are accurate, errors in the request flow can derail the user experience. Errored spans occur when a segment of the request—such as data retrieval or the model inference service—fails. Examples include:
- Timeouts: When a service takes too long to respond.
- Exceptions: Unhandled errors in the code.
- Security Triggers: Potential breach attempts flagged by the system.
Tracking errored spans offers a clear snapshot of overall system reliability. A spike in this metric signals that urgent issues—like code bugs, infrastructure outages, or external service failures—must be addressed immediately.
6. Cost Tracking
AI models, especially large language models (LLMs) in a GenAI system, can be resource-intensive. Cost tracking correlates resource usage (e.g., CPU, GPU time, or external API tokens) with actual expenditure. This data is crucial for:
- Budget Management: Recognizing when usage spikes lead to unexpectedly high bills.
- Efficiency Improvements: Identifying if your model can be pruned or quantized to lower resource needs.
- Scaling Decisions: Deciding whether to batch requests or move to more cost-effective hardware configurations.
- Cost Harvesting: Monitoring which apps, teams, or users drive the highest usage can help you identify and optimize or limit excessive resource consumption, ensuring cost efficiency.
By regularly reviewing cost metrics, teams can balance desired performance and overall expenses.
7. User Feedback
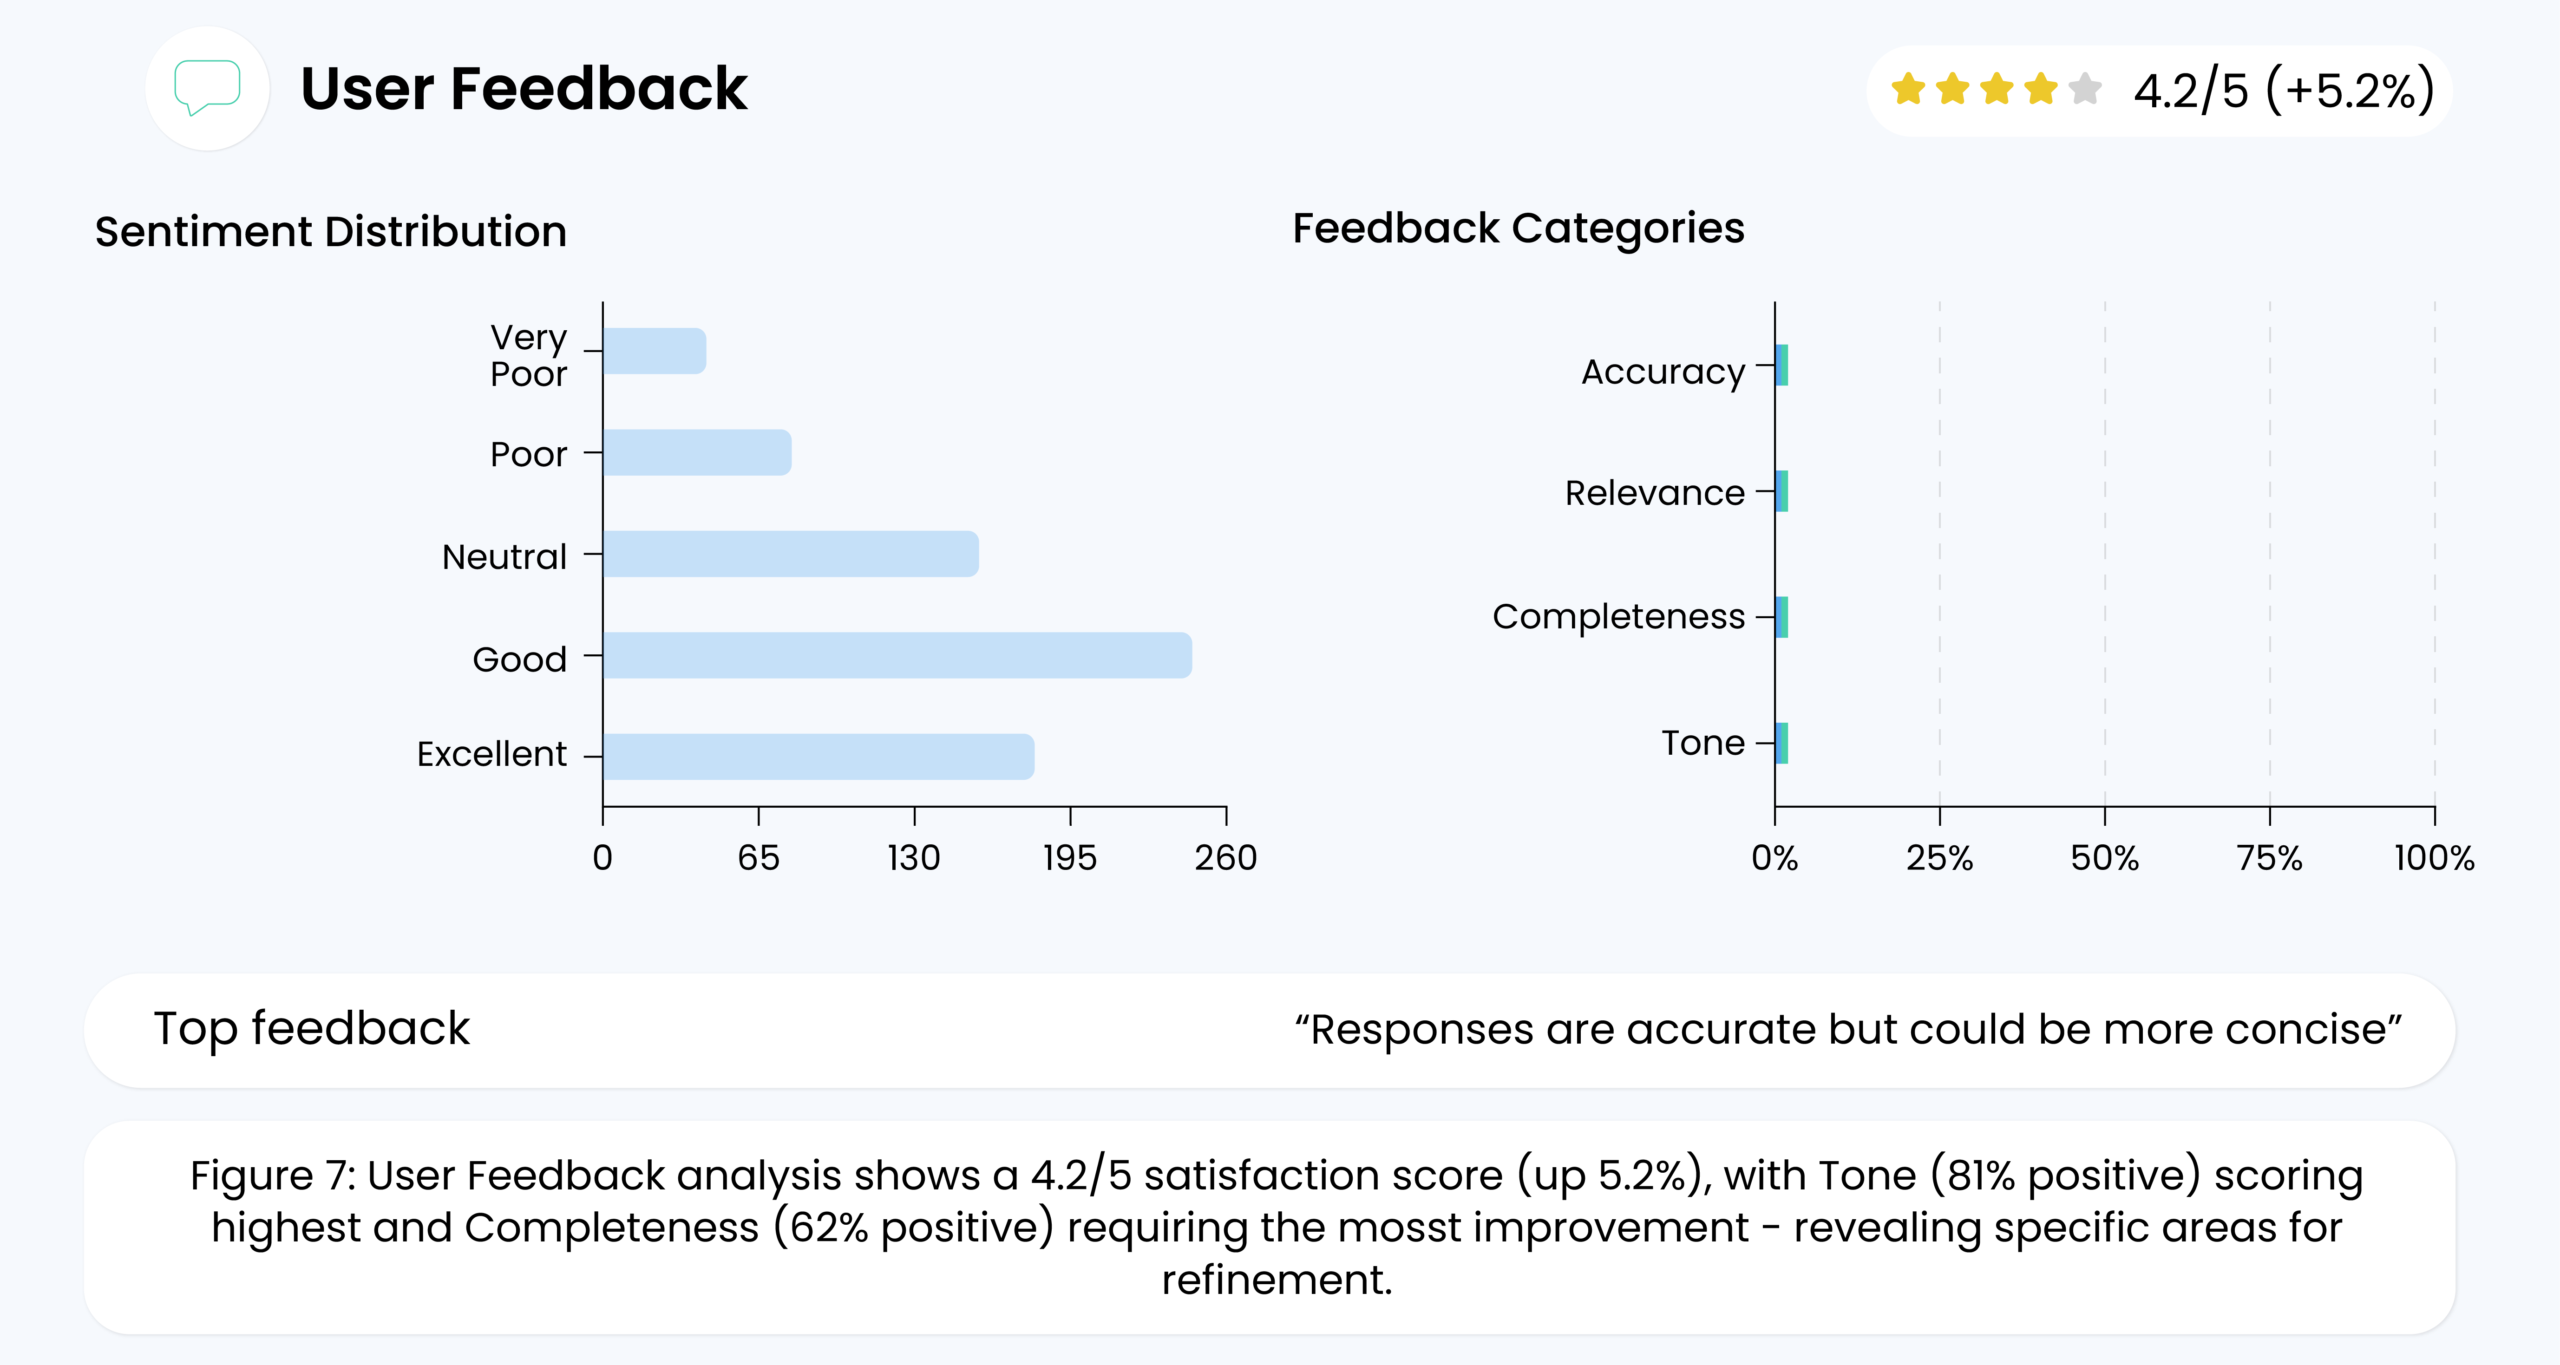
Metrics like error rates and latency reveal technical insights, but user feedback provides real-world validation. For instance:
- Explicit Feedback: Users submit ratings, comments, or suggestions.
- Implicit Signals: High rates of query rewrite or user dissatisfaction in support channels.
User feedback might indicate issues with tone (e.g., the AI sounds too formal or casual) or content (e.g., the model’s suggestions lack relevance). High negative feedback raises a red flag and pinpoints areas where retraining or additional refining of the model is necessary.
8. User Tracking
Beyond explicit feedback, user tracking captures how people interact with the AI:
- Engagement Rates: How many users keep coming back or completing desired actions?
- Drop-off Points: At which stage do users abandon a chatbot session?
- Repeated Queries: Which questions or requests do users keep posing—potentially signaling confusion or incomplete answers?
These patterns can spot hidden problems. If users consistently exit the system at a particular conversation step, it may be due to unclear instructions, flawed conversation flow, or inaccurate AI responses. Identifying these hidden choke points helps refine the model to meet user expectations better.
Now, let’s explore how data quality and effective analysis further refine and support these insights, ensuring that metrics capture performance and guide continuous improvement.
Data Quality and Analysis
While performance metrics measure the success of a trained model, data quality underpins everything. Low-quality data sets produce unreliable results, leading to user dissatisfaction, brand damage, or regulatory complications.
In generative AI, data quality is concerned with the context retrieved from vector databases (RAG), the prompts to query the model, and any external documents (referenced by AI). Ensuring this data remains relevant, factual, and properly formatted is key to avoiding hallucinations and maintaining user trust.
Data Quality
Data Quality refers to the input data streams’ completeness, accuracy, and timeliness. In AI observability, ensuring high-quality data is achieved through:
- Frequent Auditing of Vector DB and Prompt Data: Regular checks on the stored embeddings and prompt inputs help ensure the AI retrieves only the most relevant context. This scrutiny helps spot issues—like outdated or mislabeled data—that can lead to hallucinations in generative outputs.
- Real-Time Monitoring: Coralogix’s AI Observability Center automatically checks each data request—whether a user prompt, retrieved context from a vector DB, or a new dataset being ingested—and flags issues. By aligning incoming data with the application’s context, teams can spot suspicious or irrelevant content that might cause unreliable outputs.
High data quality boosts model accuracy and reduces the time spent on post-deployment troubleshooting.
Data Analysis
Data Analysis examines AI systems’ input streams, outputs, and intermediate transformations:
- Prompt & Retrieval Segment Analysis: Breaking down usage by the prompt type or the specific vector DB segment helps reveal if certain queries lead to misaligned responses. If one segment consistently yields off-topic outputs, it may indicate outdated embeddings or mislabeled data in that subset.
- Hallucination & Relevancy Checks: By reviewing where generative responses diverge from factual or intended outputs, teams can uncover patterns (e.g., the AI pulling irrelevant documents from a vector DB). This pinpoints how often the agent “hallucinates” and what prompts or external data might be causing it.
These techniques provide a deeper understanding of where your model excels and where it might need retraining or reconfiguration.
Industry Standards and Best Practices
Adhering to recognized standards and following proven best practices build a strong foundation for AI observability, reducing risks and ensuring consistent performance across diverse use cases.
Industry Standards
Industries like healthcare, finance, and e-commerce have frameworks for AI reliability and safety. Key elements often include:
| Explainability Requirements | Security and Compliance | Performance Benchmarks |
| Models should be transparent, helping teams diagnose issues. | Many sectors require strict adherence to data privacy standards (e.g., HIPAA in healthcare, PCI DSS in payments). | Standardized metrics (e.g., error rate thresholds) define what “good enough” looks like across sectors. |
AI observability tools now reflect these standards by tracking performance and data integrity within a single platform. Whether for manufacturing, retail, or healthcare, these core principles remain consistent: watch for changes, validate data quality, and ensure ethical usage.
Good Practices
Beyond broad standards, several proven techniques help organizations maximize monitoring effectiveness:
- Define KPIs Aligned with Business Goals: Focus on metrics tied to actual outcomes (e.g., customer satisfaction, cost savings).
- Set Alert Thresholds: Determine acceptable ranges for each KPI. If a KPI deviates, an alert prompts rapid investigation.
- Unified Observability: Correlate metrics, logs, traces, and events in one dashboard for context-rich analysis.
- Automate Monitoring: Use dedicated AI observability solutions. Automated checks reduce human error and latency in detection.
- Regularly Review & Update KPIs: As models evolve or business priorities shift, re-evaluate which metrics matter most.
A strong monitoring regimen is proactive, continuously gathering data and providing real-time insights into model behavior. This ensures that anomalies never go unnoticed and encourages quick, effective interventions.
Use Cases and Applications
AI models are making inroads across nearly every sector, but each industry has unique KPIs and success criteria.
Healthcare KPIs
AI models often deal with life-critical tasks such as diagnostics or treatment recommendations in healthcare. Consequently, metrics emphasize safety and quality of care :
- Diagnostic Accuracy & Error Rates: Highly sensitive and specific AI tools catch true patient cases without overdiagnosing.
- Patient Outcomes & Safety: Models influencing clinical decisions must link to tangible improvements in readmission rates, mortality, or complications.
- Patient Satisfaction: AI-driven scheduling tools or triage chatbots can reduce wait times, but patient trust is paramount.
- Bias & Fairness: Hospitals must ensure models perform equally well for diverse patient groups.
Regulatory bodies sometimes require ongoing validation of AI solutions. By integrating real-world data feedback into model updates, healthcare systems maintain trust and effectiveness over time.
Customer Service
Customer service bots, virtual agents, and ticket routing systems have become commonplace. Key KPIs here include:
- Automated Resolution Rate (ARR): The fraction of queries fully resolved by AI alone, reducing agent workload.
- First Contact Resolution (FCR): How often the AI solves problems on the initial interaction.
- Customer Satisfaction (CSAT): Direct ratings after AI interactions, reflecting user perception of quality and helpfulness.
- Average Handle Time (AHT): The time from a query’s start to resolution. Lower AHT equates to faster service, but it must not compromise thoroughness.
- Customer Effort Score (CES): Gauges how easily customers find solutions. Even with correct answers, a convoluted process can hurt the user experience.
Monitoring these KPIs in real-time allows support teams to refine chatbot logic, knowledge bases, or user flows for more satisfying, efficient interactions. Coralogix’s AI Center leverages real-time logs and span-level tracing to uncover conversational flow latency spikes or error-prone segments.
By spotting slow responses or incorrect suggestions, teams can refine prompts and model logic, ensuring every customer inquiry receives a timely, accurate answer.
Actionable Insights and Continuous Improvement
Actionable Insights
Collecting metrics is the first step; the real power lies in turning them into actionable insights. This might involve:
| Business Outcome Correlation | Anomaly Detection & Root Cause Analysis | User Feedback Analysis | Trend Analysis |
| Linking model metrics (e.g., recall) to real-world metrics (e.g., sales conversions) clarifies which KPIs matter most for strategic objectives. | If error rates or latency spike unexpectedly, an AI observability tool can highlight where the problem originates—perhaps a specific new data source. | High negative feedback or frequent user corrections illuminate areas for model refinement (e.g., retraining on a neglected class). | Observing metrics may reveal seasonal dips or performance erosion, prompting timely interventions. |
Continuous Improvement
Sustaining high performance means embracing a continuous improvement cycle :
- Define: Establish targets for selected KPIs (e.g., maintain recall above 90%).
- Measure: Monitor real-time and historical data to check adherence.
- Improve: If metrics drop or there’s an identified shortfall, retrain the model, optimize architecture, or adjust workflows.
- Validate & Repeat: Roll out updates cautiously, verifying improved performance with A/B testing before system-wide deployment.
This loop ensures AI models adapt to evolving data and user needs rather than stagnating. For example, a recommendation model might degrade as new product lines emerge. The model remains relevant by frequently measuring performance, noticing a mismatch, and updating the training set to reflect current offerings.
Automated pipelines can streamline retraining and deployment, using performance thresholds as triggers. If error rates exceed acceptable bounds, an alert might kick off a partial retraining with fresh data.
By integrating these improvements into regular release cycles, organizations foster a culture where AI continuously learns from feedback and refines itself for better outcomes.
Key takeaways
Selecting and monitoring the right KPIs is vital for an AI model’s success. Accuracy metrics like evals error rate, precision, and recall capture how effectively a model performs its intended task. Latency, span-level monitoring, and error tracking address the system’s responsiveness and reliability.
Cost metrics ensure deployments remain financially viable, while user feedback and user behavior tracking complete the loop by capturing human-centric insights. Best practices emphasize defining KPIs tied to business goals, using integrated dashboards, and automating incident response.
Whether for healthcare, where patient safety is critical, or customer service, where user experience and efficiency define success, organizations can tailor these metrics to meet their unique demands.
Crucially, metrics are most valuable when they inspire actionable insights leading to continuous improvement. Teams can fine-tune their models and processes by systematically analyzing anomalies, segmenting performance across user groups, and correlating model outcomes with business objectives.
Observability platforms such as Coralogix unify logs, metrics, and traces, helping teams rapidly identify problems, maintain performance, and maximize the return on their AI initiatives.
In a landscape where AI models power core services, maintaining model health is not optional—it is essential to safeguarding trust, efficiency, and strategic value. By proactively monitoring these metrics and integrating them into iterative development cycles, organizations build AI systems that remain robust, adaptable, and aligned with both user needs and business goals.
FAQ
What is the difference between error rate and precision/recall?
How does span latency differ from overall response time?
Why is data quality important in AI model monitoring?
What are some common KPIs for AI in customer service?
How can organizations use KPIs for continuous improvement?
References
- Cooney C. AI Observability: Key Components, Challenges & Best Practices. Coralogix; 2023. https://coralogix.com/guides/aiops/ai-observability
- Stelios M. 4 Observability Metrics Examples to Overcome Big Challenges. Coralogix Blog; July 2023. https://coralogix.com/blog/observability-metrics-examples
- Precision vs. Recall – Full Guide to Understanding Model Output. Viso.ai (Blog). https://viso.ai/computer-vision/precision-recall
- Best Practices for Monitoring and Logging in AI Systems. Magnimind Academy Blog; 2021. https://magnimindacademy.com/blog/best-practices-for-monitoring-and-logging-in-ai-systems/
- OpenTelemetry Span Metrics – Grafana Tempo Documentation. Grafana Labs; 2023. https://grafana.com/docs/tempo/latest/metrics-generator/span_metrics
- Harrison K. Machine Learning Model Monitoring: What to Do In Production. Heavybit; Sep 2024. https://www.heavybit.com/library/article/machine-learning-model-monitoring
- Cooney C. Observability for LLMs. Coralogix (Blog); Oct 2023. https://coralogix.com/blog/observability-for-llms/
- Hodgson J. User feedback – the missing piece of your ML monitoring stack. Towards Data Science; 2023. https://towardsdatascience.com/user-feedback-the-missing-piece-of-your-ml-monitoring-stack-46b2bbf0b5e4
- Wallace J. Data Quality Metrics: 5 Tips to Optimize Yours. Coralogix Blog; Aug 2023. https://coralogix.com/blog/data-quality-metrics
- Sapphire Ventures. Observability in 2024: Understanding the State of Play and Future Trends (Emergence of AI/ML Observability). Sapphireventures.com; 2023.https://sapphireventures.com/blog/observability-in-2024-understanding-the-state-of-play-and-future-trends
- Restack. KPI Metrics for Healthcare AI Verification. Restack Blog; 2025. https://www.restack.io/p/kpi-metrics-healthcare-ai-answer-cat-ai
- Simbo AI. Exploring the Impact of Healthcare KPIs on Patient Outcomes and Operational Efficiency. Simbo.ai Blog; 2023. https://www.simbo.ai/blog/exploring-the-impact-of-healthcare-kpis-on-patient-outcomes-and-operational-efficiency-in-modern-healthcare-facilities-1400251
- Dialzara. 5 Key Metrics to Measure AI Customer Service Success. Dialzara Blog; June 2024. https://dialzara.com/blog/5-key-metrics-to-measure-ai-customer-service-success/