Data Quality Metrics: 5 Tips to Optimize Yours

Amid a big data boom, more and more information is being generated from various sources at staggering rates. But without the proper metrics for your data, businesses with large quantities of information may find it challenging to effectively and grow in competitive markets.
For example, high-quality data lets you make informed decisions that are based on derived insights, enhance customer experiences, and drive sustainable growth. On the other hand, poor data quality can set companies back an average of $12.9 million annually, according to Gartner. To help you improve your company’s data quality and drive higher return on investment, we’ll go over what data quality metrics are and offer pro-tips on optimizing your own metrics.
What are data quality metrics?
A measurement system needs to be used to rank data quality. Data quality metrics are key performance indicators (KPIs) that indicate data is healthy and ready to be used. Data observability standards use six metrics that demonstrate data quality. The metrics include:
- Accuracy
Accuracy measures whether data conveys true information or not. Ask yourself, does the data reflect reality accurately and factually?
- Completeness
Your data should contain all information needed to serve its intended purpose, which could vary from sending an email to a list of customers to a complex analysis of last year’s sales.
- Consistency
Different databases may measure the same information but record different values. Does your data differ depending on the source?
- Timeliness or currency
Timeliness measures the age of data. The more current the data is, the more likely the information is to be accurate and relevant. Timeliness also requires timestamps to be recorded with all data.
- Uniqueness
Uniqueness checks for duplicates in a data set. Duplicates can skew analytics, so any found should be merged or removed.
- Validity or uniformity
Validity measures whether or not data is presented in the same format. Data should have proper types, and the data format should be consistent for analysis.
5 tips to optimize data quality metrics
Data collected and stored should meet quality standards to be trusted and used meaningfully. Data quality standards should also take subjective definitions of quality that apply to your company and data set in order to convert them into qualitative values that indicate data health.
Below are expert tips to help understand what to prioritize when generating and using data quality metrics:
- Let use-cases drive data quality metrics
Design your data quality metrics using the understanding of what data in your company is used for. For example, data may be used in gaming to customize a user’s in-game experience.
Data could also be used to drive ad campaigns for new in-game features. Write down use cases that connect data quality metrics to their ultimate goals. This will help developers understand why specific data quality metrics are important, and what tolerances may be applied to them.
Data quality metrics may also link to other metrics already recorded in your observability platform. Link data quality metrics to use cases and marketing metrics to measure outcomes resulting from data usage quantitatively.
- Identify pain points
After use cases are identified, a list of valuable metrics to generate can be prioritized based on which has been the most troublesome. Ask yourself the following questions, have game user’s not responded as well as expected to recently launched features? Have users complained about a game experience that data showed they would likely enjoy?
Look at the data associated with these use cases first. If no data metrics exist, generate these before other, more stable, data is reviewed. If metrics do already exist, check them to see if there were data issues present that would have affected stakeholders’ decisions. Use results to drive better metrics, alerting, and data quality.
- Implement data profiling and cleansing
Data profiling involves analyzing data to identify anomalies, inconsistencies, or missing values. Use data profiling in conjunction with data quality metrics to gain insights into the quality of your data in real time and identify areas that need improvement.
After profiling, if necessary, perform data cleansing to address issues such as duplicate records, missing values, and incorrect entries. Regularly scheduled data cleansing routines help maintain data accuracy. Data cleansing can also be run whenever data corruption reaches some threshold level.
Be aware that profiling and cleansing data both may take significant memory. Ensure memory usage is kept within required limits by monitoring data usage while performing these tasks.
- Continuously monitor metrics
Monitor data quality metrics to identify trends, patterns, and potential issues. Define key performance indicators (KPIs) related to data quality and track them regularly.
Set up alerts or notifications to flag potential data quality problems as soon as they arise so that action can be taken promptly. Regularly reviewing data quality metrics allows you to identify areas of improvement and make necessary adjustments to maintain high data quality standards.
- Make metrics actionable
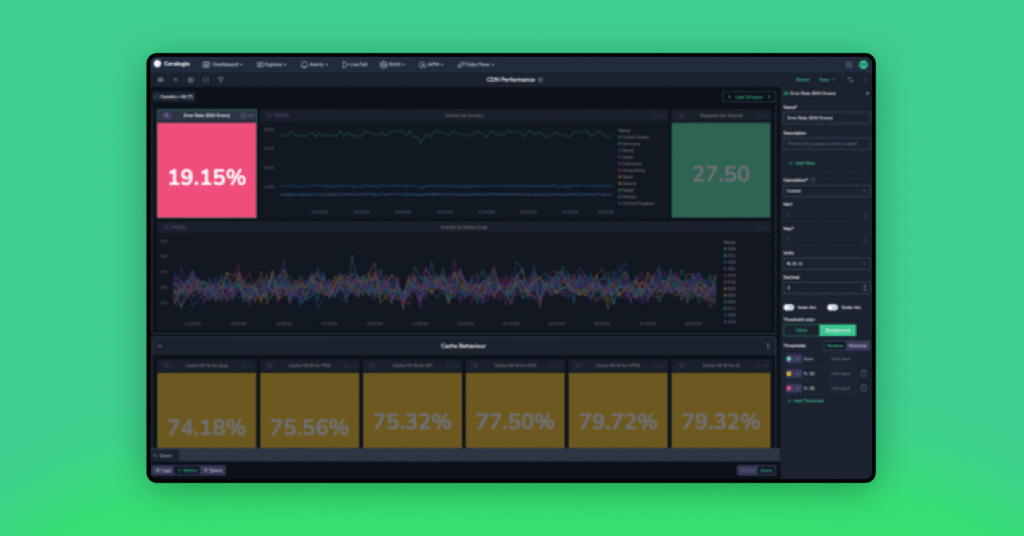
Data quality metrics and KPIs must be created and displayed so actions can be easily seen and taken. Up-to-date metrics should always be available for viewing on the Coralogix custom dashboard configured in a way that can be easily understood by data engineers, developers, and stakeholders alike. (You should be able to see the data health status at a glance to know if actions should be taken to fix anything.)
Each metric should be displayed based on its usefulness. The timeliness metric measuring how old data is should be updated periodically to indicate the current age of data. When data becomes too old, action should be taken to update or remove expired data. The Coralogix custom webhooks alert could be used to trigger automatic actions wherever available.


