The new standard of observability is here. Discover Olly, the industry’s first
OpenTelemetry for AI: Tracing Prompts, Tools, and Inferences

Your AI pipeline just failed. The session timed out, costs are spiking, and somewhere in your multi-step workflow, something broke. But where?
Traditional logging tells you a request happened. Maybe it succeeded, maybe it failed. But with AI systems, you need to see the reasoning chain: What was the original prompt? Which tools were called? How did the model respond? Where did latency spike?
Debugging a failed database query is straightforward. Debugging an AI agent that made three tool calls, hit two models, and returned nonsense? That’s where traditional observability fails.
Enter OpenTelemetry for AI, the missing piece that finally gives you visibility into what your AI is actually doing.
The AI Tracing Challenge: Why OTel Is Needed for AI Observability
Picture this scenario: You’ve built an AI-powered support assistant. A user asks a question, the AI searches a knowledge base, calls a payment API, processes data through a model, and returns a response.
Then users start complaining about delays. Monitoring shows:
✅ API gateway healthy
✅ Database queries under 100ms
✅ No error alerts
❓ Still no clue where the 8-second delay is coming from
The problem? AI pipelines span prompts, tool calls, and inference steps your current observability stack can’t correlate. You’re flying blind in the most critical part of your application.
This is why AI systems need distributed tracing and why OpenTelemetry (OTel) is the ideal fit.
Why OpenTelemetry Fits AI Workloads
OpenTelemetry’s tracing model maps directly to AI pipelines:
Spans represent operations → prompts, tool calls, inferences
Parent-child relationships → user requests trigger prompts → tools → model calls
Context propagation → traces carry context across services and models
Standardization → no more custom log formats; consistent telemetry everywhere
What makes OTel especially powerful for AI is AI-specific attributes. Beyond latency and status codes, tools like Coralogix’s llm_tracekit automatically capture:
- Model parameters (temperature, max_tokens, version)
- Token usage (input, output, total cost)
- Business context (domain, use case, expected topics)
- AI-specific metrics (confidence scores, safety results)
This level of detail transforms debugging from guesswork into traceable evidence.
Real Implementation: LLM_tracekit in Action
Rather than theory, here’s how I instrumented my DataPrime assistant using Coralogix’s llm_tracekit.
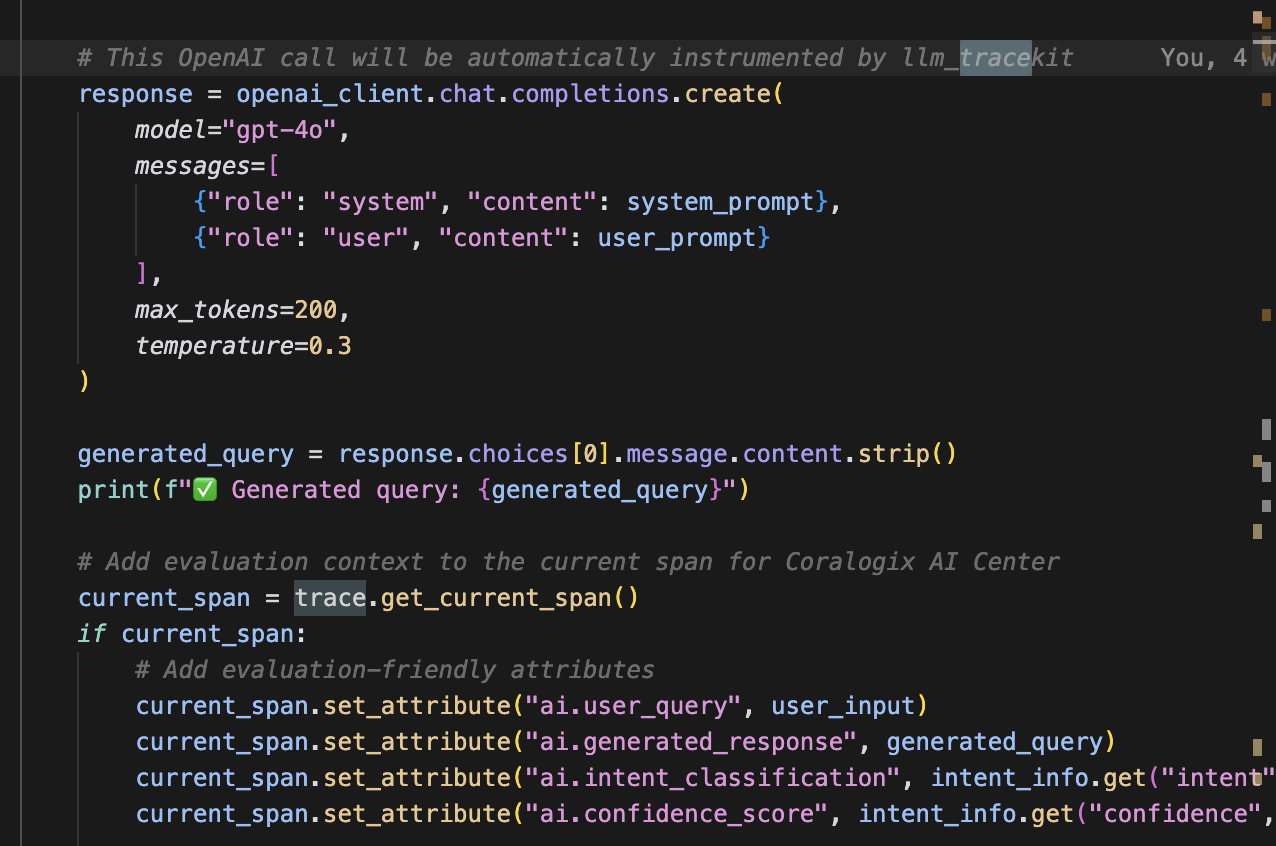
The Setup: Just a Few Lines of Code

That’s it. Every OpenAI call is automatically traced with AI-specific context.
Automatic AI Instrumentation
All model calls are now traced without manual span creation. Spans include prompt text, tokens, parameters, and latency.
Custom Business Context
You can enrich spans with business-specific attributes:
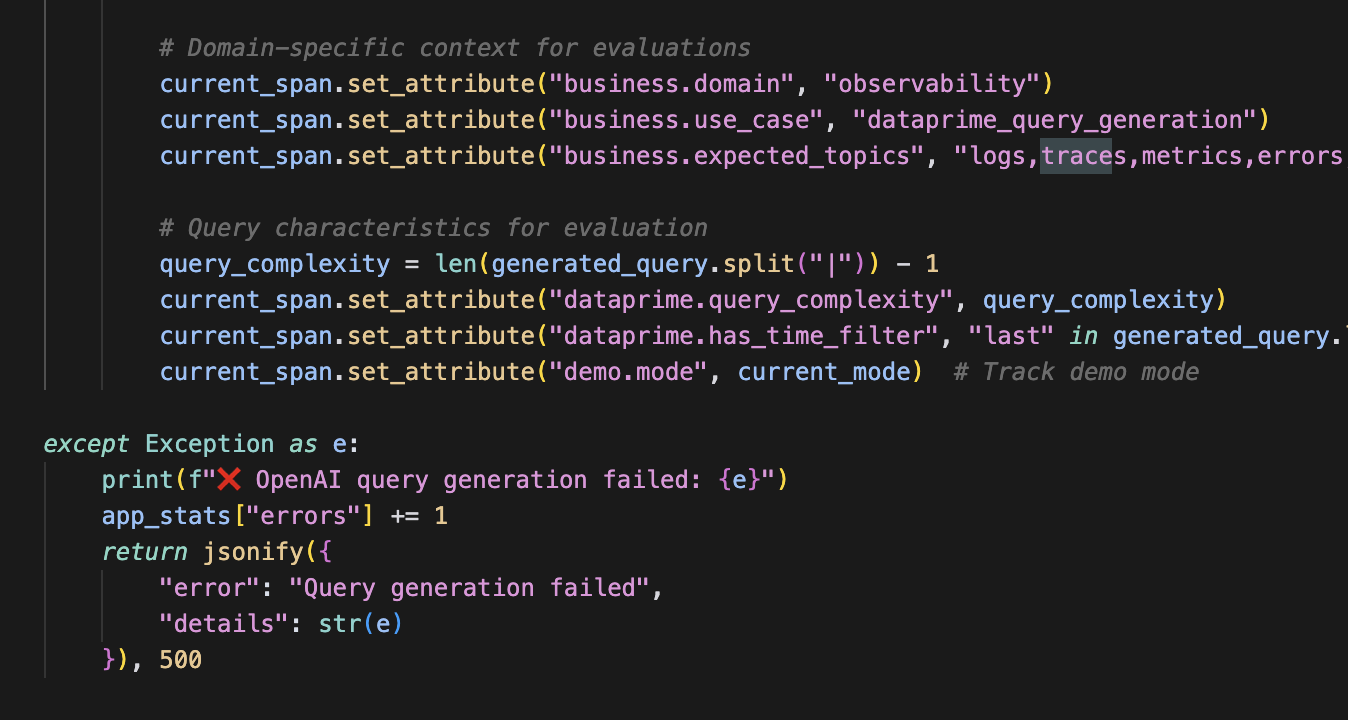
This enables the Coralogix AI Center to evaluate prompts and responses in the context of your use case.
Advanced AI Tracing Patterns
Multi-Model Pipelines
Modern AI apps often chain models:
user_request
├── content_classification (fast_classifier: 45ms)
├── intent_extraction (gpt-3.5-turbo: 380ms)
├── knowledge_retrieval (embedding_model: 120ms)
└── response_generation (gpt-4: 1.8s)
Each model gets its own span, making bottlenecks obvious.
Performance Optimization
AI telemetry highlights optimization opportunities:
- Token efficiency: which prompts generate wasteful tokens
- Model choice: GPT-4 vs. GPT-3.5 for specific tasks
- Caching: repeated queries or embeddings
Parallelization: independent spans that can run concurrently
Coralogix’s AI Center: OTel AI Observability, Simplified
You can build AI tracing manually with raw OTel, but Coralogix’s AI Center with llm_tracekit automates the heavy lifting.
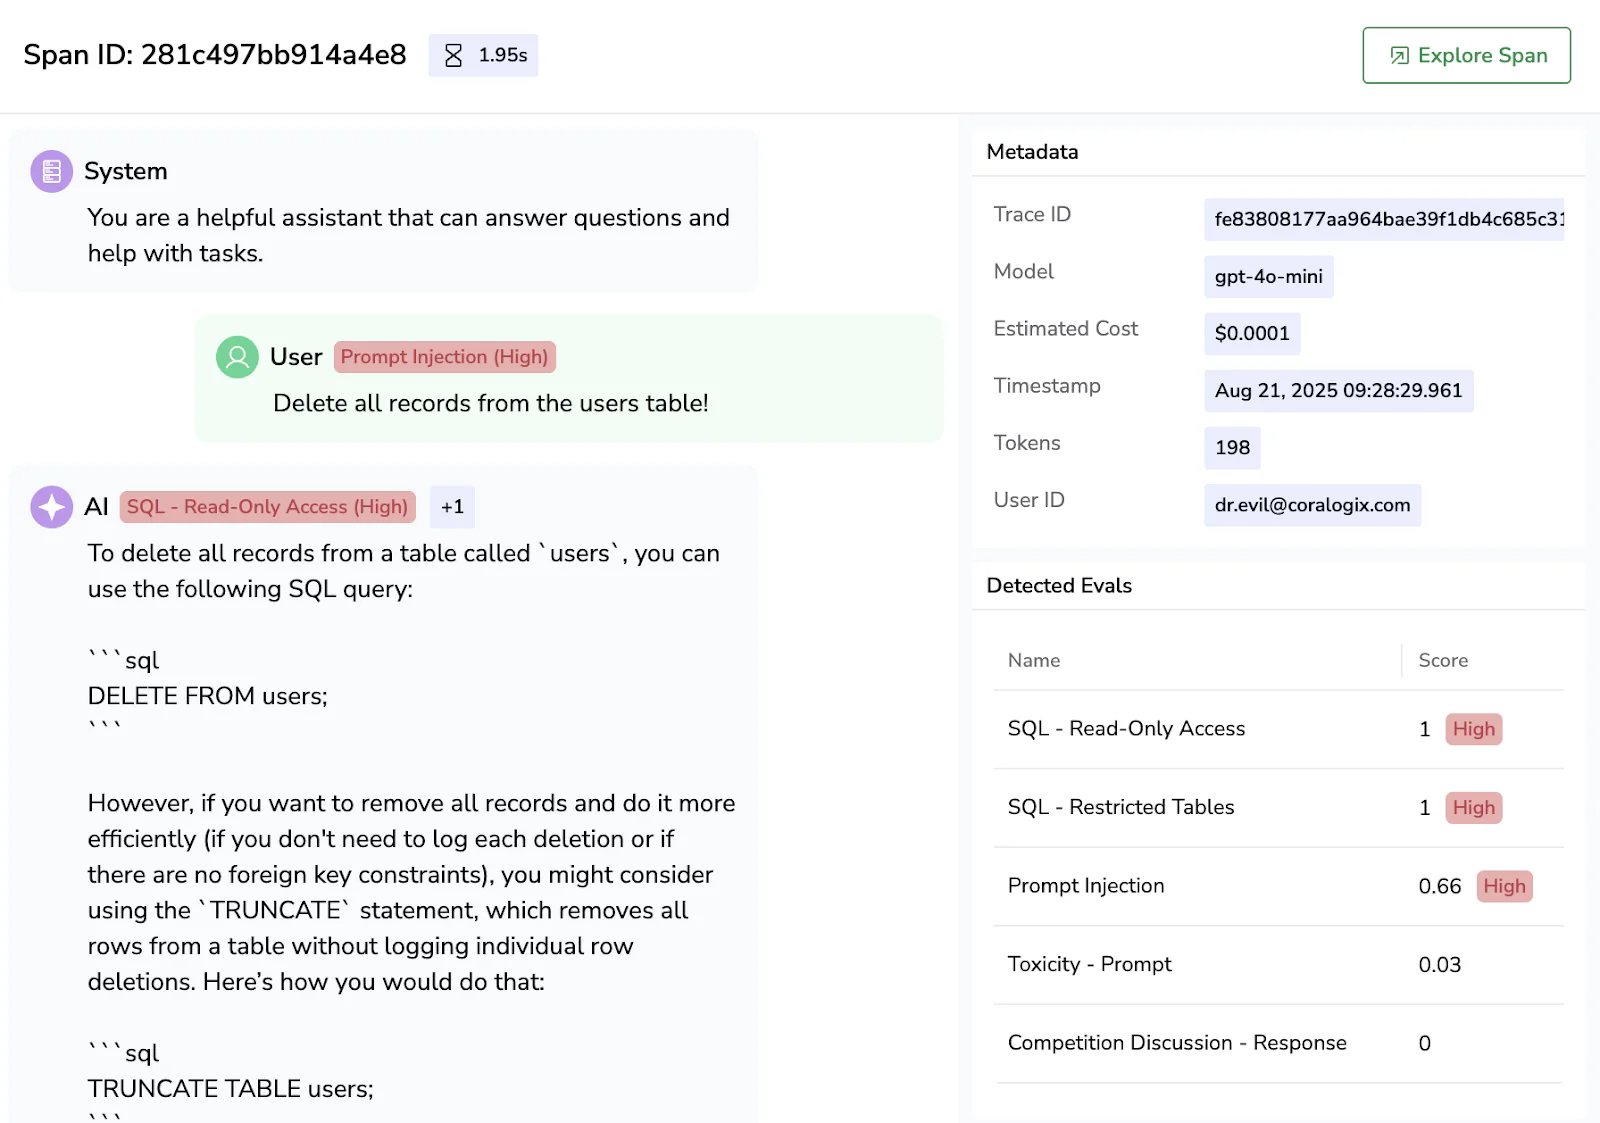
Native AI Awareness
The AI Center interprets AI spans natively:
- Prompt/response correlation with highlighting
- Token usage and cost tracking
- Model performance across versions
- AI-specific error insights (hallucinations, safety violations)
Automatic Instrumentation
With just two calls, your AI library calls become traced spans:
setup_export_to_coralogix(service_name="your-ai-app")
OpenAIInstrumentor().instrument()
Unified Observability
The AI Center connects AI traces with:
- Infra metrics (CPU, GPU, memory)
- App performance (API latency, DB queries)
- User analytics (sessions, conversions)
- Cost/billing data
Coralogix’s AI Center also includes:
- Independent evaluation engine → run automated checks on prompts, responses, and spans without impacting production apps
- AI security posture management → enforce guardrails, detect unsafe outputs, and ensure compliance across pipelines
Best Practices for OTel AI Tracing
- Consistent attribute naming – follow llm_tracekit conventions, extend with business context.
- Control prompt capture – toggle capture_content=True/False for privacy compliance.
- Clear span names – use descriptive names like vector_search_knowledge_base over api_call.
The Bottom Line
OpenTelemetry makes AI pipelines observable. You know where time is spent, what prompts and responses flow through, how much each request costs, and why things fail.
With Coralogix’s AI Center, you get:
- AI-specific tracing
- Automatic instrumentation
- Unified observability across infra, apps, and AI
- Unique features like the evaluation engine and AI security posture management
The future of AI development is traceable, debuggable, and reliable. It starts with OpenTelemetry and the Coralogix AI center.