4 Killer Coralogix Tracing Features

Tracing is often the last thought in any observability strategy. While engineers prioritize logs and metrics, tracing is truly the hallmark of a mature observability platform, but it is also the most difficult to implement. Once tracing is in place, engineers typically discover something else – many tracing solutions aren’t particularly feature-rich.
At Coralogix, we’ve built world-class tracing, and we’re going to look at four features that illustrate just how exciting that functionality is!
Feature 1: Related Logs
A big mistake we see in the market is the separation of data. You tend to silo logs, metrics, traces, and security information off into different solutions. This eliminates any opportunity to correlate between these values, and instead you are forced to do the work yourself.
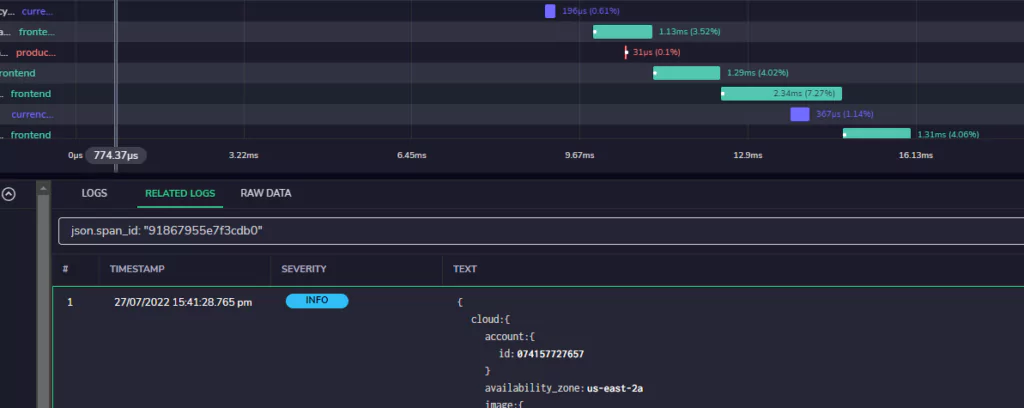
At Coralogix, we believe in full-stack observability, which is why we’ve created the Related Logs feature. Related logs are all of the logs associated with a given span. This means that when you want to look at the true context of an event in your tracing data, you can do so with the full support of your logs.
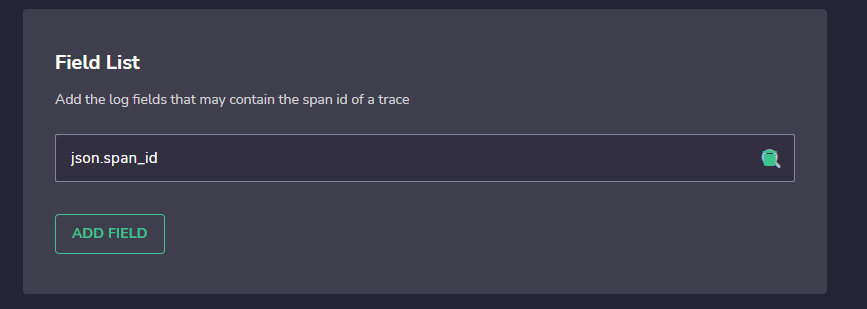
You can also specify custom fields that may include the span ID, if you already have a field you would like to track. This is common for users who include things like sessionId or transactionId in their logs.
This is most useful when you have a span that stands out from the rest. Perhaps it’s anomalous and it takes twice as long as comparable operations, or perhaps a normally fast operation intermittently throws errors. Rather than tracking down the time of your span and switching to your logs screen, potentially losing context, and missing important information, your associated logs are visible right there in the UI.
Feature 2: Dependencies View
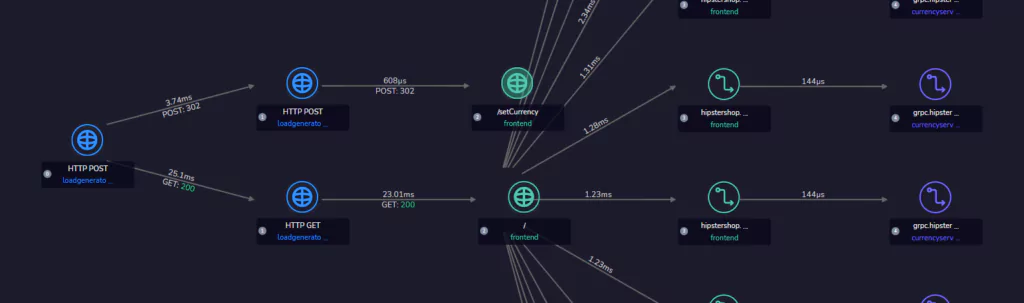
The span view of any tracing solution is excellent when you’re trying to see where an issue might be, but as your traces include more and more spans, with more and more services interacting with one another, it can become difficult to read the span view. To combat this, we’ve implemented the Dependencies View.
The dependencies view is a living process flow diagram showing how each service communicates with its dependent services, including latency information, HTTP methods, HTTP status, and where the errors are located. This view scales far more elegantly than other tracing views and couples as a snapshot of detailed interactions in a given service.
Feature 3: Save a custom view of your traces
Recurring issues are widespread in complex software systems. Bugs that have multiple potential causes will often repeat until they are eventually squashed, so it’s crucial that when an incident does occur, you can immediately understand what your observability data is telling you.
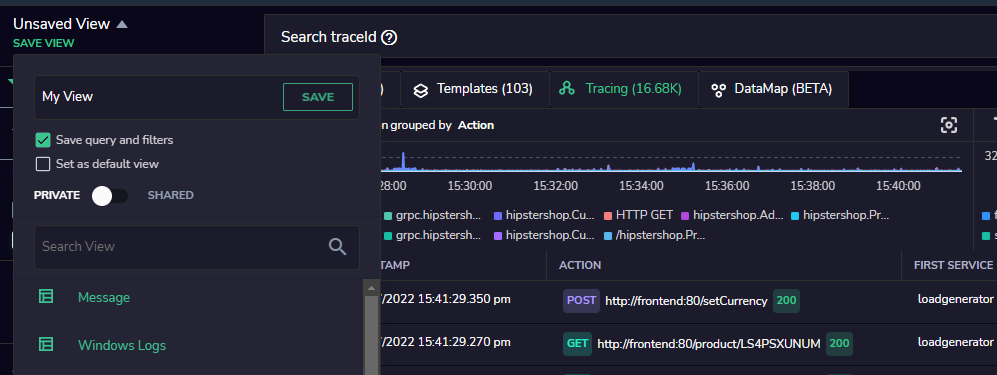
In these situations, you don’t have time to reconfigure your UI with the correct filters, values, and queries to find out what you need to know. This is why Coralogix allows you to save your current view and reload it later. This powerful productivity boost will enable you to quickly zoom back in on the root cause of a problem.
Saved views, coupled with the detailed tracing view in Coralogix, allows you to quickly get a precise breakdown of your traces for a given system, time frame, or collection of services with only a single button click.
Feature 4: Lock-in free, open source integration

A key concern that engineering teams have is “vendor lock-in.” Some vendors deploy as much of their proprietary software as possible into their client’s systems, so the customer and vendor are tightly coupled. This makes migrations more complex and is often listed as a risk associated with a given vendor.
To help with this, we offer a completely open-source method for integrating with Coralogix tracing. Customers install widely used open-source tooling into their environments using the OpenTelemetry specification and telemetry agent, and Coralogix can transparently consume it.
On top of this, you can view your data in a completely open-source, managed instance of Jaeger, allowing you to decide how much to engage with the Coralogix feature set, or keep it all open-source.
Take Away
Tracing is one of the 3 pillars of observability for a reason. As your architecture scales, your traces become indispensable. At Coralogix, we know how crucial effective tracing is, which is why we’ve added, and continue to add, exciting features to our tracing UI.
Coralogix supports elegant, open-source, lock-in free integration and decorates it with cutting-edge features to give you the best of both worlds.