Understanding the Three Pillars of Observability


Data observability and its implementation may look different to different people. But, underneath all the varying definitions is a single, clear concept:
Observability enables you to understand what is happening in your software by looking at externally available information.
Most software that’s run today uses microservices or loosely coupled distributed architecture. While this design makes scaling and managing your system more straightforward, it can make troubleshooting issues more difficult.
The three pillars of observability are different methods to track software systems, especially microservices. Individual pillars of observability include event logs, metrics, and traces. Using the three pillars together rather than individually will significantly increase DevOps teams’ productivity and give your users a better experience interacting with your system.
Let’s dive into each of the three pillars and what insights and drawbacks they have. We will also examine how using them in combination will vastly improve your system’s observability.
Working with Logs
A log is a timestamped record of an event that occurred in your software. This record is the most granular information available in any of the three pillars. It is up to the developers to implement logging in code, ideally using some kind of standard. Logs are easy to implement since most software libraries and languages provide built-in support.
The DevOps team might want logs to be:
- Plaintext or Unstructured: some free-form human-readable string
- Structured: formatted in a consistent manner such as JSON objects
The format chosen depends on how DevOps teams will use the logs in troubleshooting. Plaintext logs are common to use when first prototyping a system or mocking data. These logs are helpful because they are easily read and created by developers working on software. Structured logs are the preferred format for modern software development since structures like JSON lend well to analytics.
Insights from Logs
DevOps professionals need to know what happened in the software to troubleshoot issues at the system or software level. Logs provide insights into what happened before, during, and after a problem occurred. A trained eye who is monitoring logs can tell what went wrong during a specific time segment in a specific piece of software.
Logs allow for analysis at the most granular level of any of the three pillars. Use logs to uncover root causes for your system’s issues and find why incorrect, unpredictable, or suboptimal system behaviors occur.
Limitations of Logs
Logs can show what is happening in a specific piece of software. For companies running microservices, the issue may not lie within a given service but how different functions are connected. To understand the linkages between microservices, DevOps professionals need to look at another of the three pillars of observability: traces.
DevOps and business teams may need to define the urgency of a problem based on how often an issue is occurring in some situations. Logs alone may show the problem but do not also show how often the problem has occurred. To solve this issue, DevOps professionals need to again look to another of the three pillars of observability for the solution: metrics.
Saving logs that go back a long time can increase costs due to the amount of storage required to save all the information. Similarly, spinning up new containers or instances to handle increases in client activity means increasing the logging amount and storage cost. That’s why a platform like Coralogix is indispensable, especially with its new pricing model and philosophy that helps you categorize your data and pay for the usage.
The Value of Metrics
Metrics represent system performance data measured over some time as a numerical value. A metric conveys information about a defined and measurable attribute of your system, such as a service-level indicator (SLI).
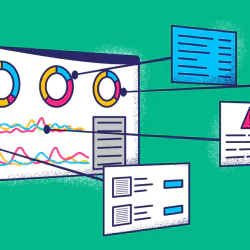
Since metrics are numerical values fluctuating over time, teams often choose to represent them in graphical format. The graphical analysis allows DevOps professionals to quickly see how aspects of the system are behaving over time. Often, different tools are required for collecting and displaying metrics. Prometheus, an open-source metric tool, can send data to tools like Grafana, a popular tool for visualization.
Metrics can trigger alerts when their value crosses a preset threshold. Typical metric measuring tools such as Prometheus have built-in alerting capabilities. Alerts give DevOps teams knowledge of when the system needs maintenance or troubleshooting and what issues have arisen at any given time.
Insights from Metrics
Unlike logs, metrics do not necessarily scale up in cost and storage requirements as your client activity increases. Since they are just summations or averages of measurable system attributes, the numbers will shift with changing activity rates. Adding more containers or instances to your system may add more dimensions to your metrics, but being compact as they are, this should not significantly affect cost.
Metrics are better suited for alerting than logs since they are already a numerical value and can apply a simple threshold. They are also malleable in applying statistical analysis to make the data useful in visualization and troubleshooting.
Some log analysis and observability tools are also adding features that convert log data to metrics since it’s more scalable and easier to monitor and alert on.
Limitations of Metrics
Metrics tend to include a name and key-value pairs containing metadata relevant to the metric. The metadata values are called labels in Prometheus. The more labels provided, the more detail you have about what the metric means in your system. Another way of saying this is that the data has dimensionality. Without labels, the metric data has no context and is more challenging to use when troubleshooting system issues.
Some labels may need to use high cardinality data in labels. High cardinality data is a label that has many distinct values, such as a single user identifier in a system with thousands or millions of users. High cardinality data is difficult to query and can cause time delays and efficiency issues for tools processing your metric data.
For metrics to be helpful, you need first to identify what to track. Ops teams will track system aspects such as availability, request rate, system utilization, and error rates. It’s up to you to work out the best metrics to track.
Before setting up metrics, Ops teams need to identify what to track in metrics. They must also take care not to track too many items in metrics. Otherwise, they will have more data than can be effectively analyzed.
Understanding Tracing
Tracing is a valuable paradigm for any distributed system. Traces use a universally unique identifier for each piece of data. This unique identifier travels with the data, allowing for tracking its lifecycle as it travels throughout your microservices.
This concept of tracing was introduced as distributed computing and microservices rose in popularity. Systems using stateless computing can quickly become difficult to track data sent to multiple services for subsequent processing. Tracing is useful whenever multiple components exist in a system and data is passed between them.
Insights from Traces
The trace will pick up data allowing DevOps teams to understand what path data has taken, how long the data takes to traverse the path and the data’s architecture at each step. With this information, ops teams can identify bottlenecks in your system to debug steady-state problems with data flows.
Limitations of Traces
Tracing is the most difficult of the three pillars to implement. If you need to add tracing to an existing system, this is especially true. Every component or function along the data’s path needs to propagate the trace data for it to be effective. For large codebases, this can mean developers need to update many functions.
If your system uses different coding languages or frameworks, tracing can also be complicated to implement. Since all functions need to propagate traces, developers may need to find different tracing methods for each language or framework used in a system. Systems that use the same language and framework can be retrofit with tracing more easily than heterogeneous systems.
Greater than the Sum of its Parts
The three pillars of observability include event logs, metrics, and traces. Each pillar provides different insights into the health of your system. Implementing only some of the three pillars means your teams will not have complete insight into the system’s functions and cannot troubleshoot or enhance the system efficiently. Implement the three pillars of observability together to give your system the best possible outcome.
By using a holistic approach to observability, teams can take both a proactive and reactive approach to maintain their system’s health. They can proactively receive alerts when metrics operate outside of known thresholds. They can effectively react to alerts and customer feedback by looking at high-cardinality traces and high granularity logs to understand what happened in the system at any given time. Having all this data together reduces the meantime for a resolution of any given problem.
Other support tools use machine learning to understand where thresholds and issues can arise where the DevOps or business teams have not foreseen them. These algorithms learn your system’s behavior over time and detect when abnormal logs, traces, or metrics are present. Coralogix’s Machine Learning tools, such as their Flow Anomaly detector, can alert DevOps teams to investigate issues expeditiously.