5 Essential MySQL Database Logs To Keep an Eye On

MySQL is the de facto choice for open-source relational databases, and you should learn how to use MySQL database logs to improve efficiency and security. As an open-source product, it is free to use and has a large and active developer community. It is crucial to understand how to diagnose and monitor the performance of a MySQL instance in the long run.
Logs to the rescue!
Why is logging important?
A highly available and performant database is essential for an application’s performance. While using a MySQL instance in production, you will come across issues like slow queries, deadlocks, and aborted connections. Logging is essential to diagnosing these issues. A good understanding of your MySQL database logs will help you improve operations by reducing the mean time to recovery and the mean time between failures.
Log monitoring is also key to detecting and diagnosing security issues within your MySQL instance. In the event of a compromise, logs track the details of an attack and the actions taken by the attackers. This information provides context to your data and helps you take remedial action.
Is monitoring logs a complex affair?
Logging is often ignored because analyzing logs is considered a complex activity. However, monitoring logs from a MySQL instance isn’t a complex task, provided you know which variables to watch and where to find them.
If your MySQL instance is generating a large amount of log data each day, it might not be feasible to review all of them manually. You can automate the review process by using log monitoring software that can pinpoint problematic events. Some monitoring software can even be configured to send out email alerts when something suspicious is detected.
In this post, we’ll discuss five important logs and the specific ways in which they can help you monitor your MySQL instance.
- General Query Log
- Slow Query Log
- Error Log
- Binary Log
- Relay Log
Enable Logging on MySQL
Before moving ahead, it’s important to note that logging is disabled by default on MySQL except for the error log. Let’s take a quick look at how to enable the general and slow query logs.
To start using MySQL commands, open your command prompt, and log in to your MySQL instance with the following command.
mysql -u root -p
First, check the current state of the system variables by using the command
mysql> show variables;
If variables like general_log and slow_query_log are OFF, we need to switch them on.

![]()
You can enable the general query log with the following command. The default name of the log file is host_name.log but you can change the name and path as required.
mysql>SET GLOBAL general_log = ‘ON’;
mysql>SET GLOBAL general_log_file = ‘path_on_your_system’;
The slow query log can be enabled with the commands below.
mysql>SET GLOBAL slow_query_log = ‘ON’;
mysql>SET GLOBAL slow_query_log_file = ‘path_on_your_system’;
You can also control the destination of logs by setting the value of the log_output variable to FILE TABLE or FILE,TABLE . FILE selects logging to log files while TABLE selects logging to the MySQL system schema.
Now, let’s see which 5 logs you’ll want to keep an eye out for in your MySQL instance!
1. General Query Log
As the name implies, the general query log is a general record of what MySQL is doing. Information is written to this log when clients connect or disconnect to the server. The server also logs each SQL statement it receives from clients. If you suspect an error in a client, you can know exactly what the client sent to the MySQL instance by looking at the general query log.
You should be aware that MySQL writes statements to the general query log in the order in which it receives them. The order might differ from the order in which the queries are executed because, unlike other log formats, the query is written to this log file before MySQL even attempts to execute the query. MySQL database logs are therefore perfect for debugging MySQL crashes.
Since the general query log is a record of every query received by the server, it can grow large quite quickly. If you only want a record of queries that change data, it might be better to use the binary log instead (more on that later).
Impact on performance
In terms of performance, enabling the general query log does not have a noticeable impact on performance in most cases. However, it has been observed that writing logs to a file is faster than writing them to a table. If you want a detailed analysis of the performance impact of the general query, you can go through this article which goes into greater depth on this.
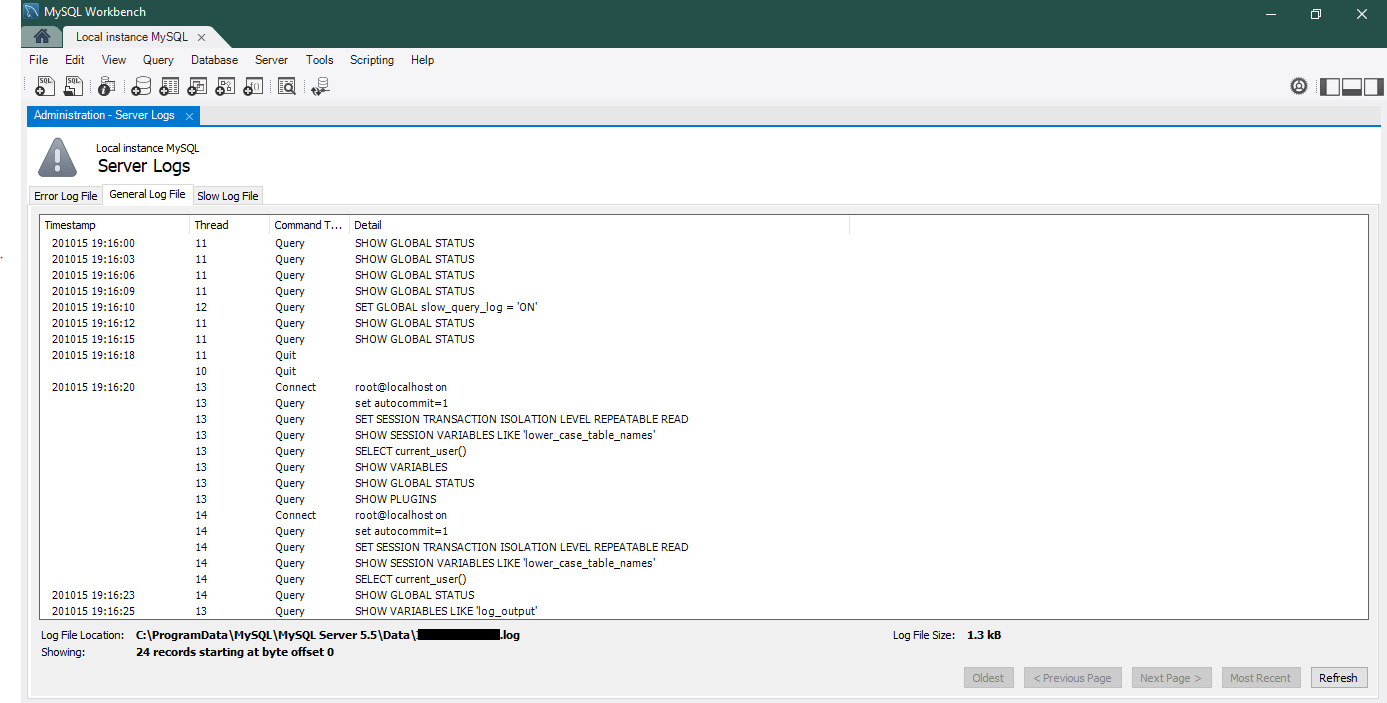
Viewing MySQL Database Logs on the workbench
To view logs on the MySQL workbench, go to the ‘Server’ navigation menu and then choose ‘Server Logs’. The following picture shows an example of entries in a general log file.
2. Slow Query Log
As applications scale in size, queries that were once extremely fast can become quite slow. When you’re debugging a MySQL instance for performance issues, the slow query log is a good starting place to see which queries are the slowest and how often they are slow.
The slow query log is the MySQL database log queries that exceed a given threshold of execution time. By default, all queries taking longer than 10 seconds are logged.
Configuration options
You can change the threshold query execution time by setting the value of the long_query_time system variable. It uses a unit of seconds, with an optional milliseconds component.
SET GLOBAL long_query_time = 5.0;
To verify if the slow query log is working properly, you can execute the following query with a time greater than the value of the long_query_time .
SELECT SLEEP(7);
Queries not using indexes are often good candidates for optimization. The log_queries_not_using_indexes system variable can be switched on to make MySQL log all queries that do not use an index to limit the number of rows scanned. In this case, logging occurs regardless of execution time of the query.
Parsing slow query logs
For large applications, the slow query log can become difficult to investigate. Fortunately, MySQL has a tool called mysqldumpslow which parses the slow query log files and prints a summary result with similar queries grouped. Normally, mysqldumpslow groups queries that are similar except for the particular values of number and string data values.
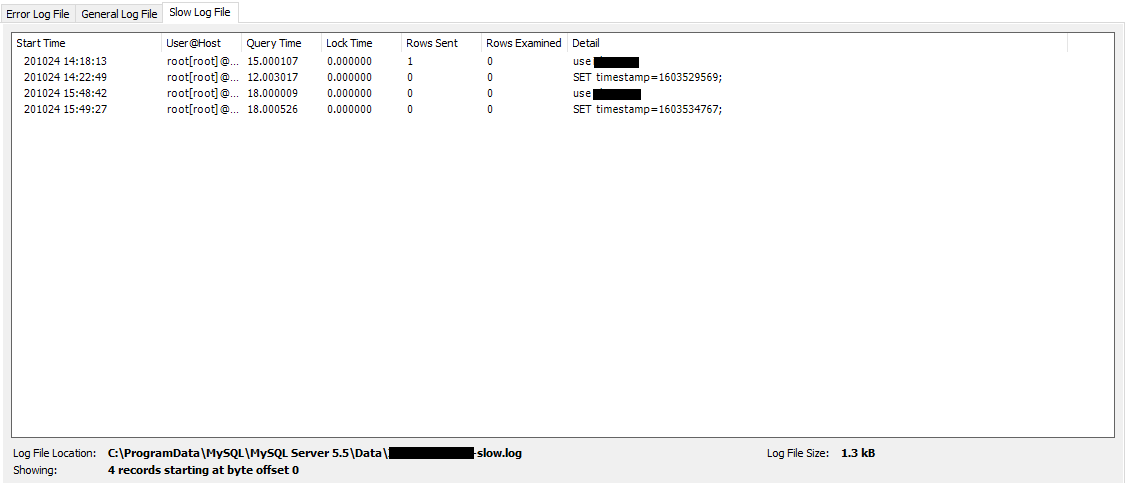
Finally, you should understand that not every query logged on the slow query log needs to be optimized. A query that takes long to run but is only run once a month is probably not a source of concern. On the other hand, a query that has a smaller execution time but runs thousands of times an hour may be a good candidate for optimization.
The following picture shows an example of entries in a slow query log file.

3. Error Log
MySQL uses the error log to record diagnostic messages, warnings, and notes that occur during server startup and shutdown, and while the server is running. The error log also records MySQL startup and shutdown times.
Error logging is always enabled. On Linux, if the destination is not specified, the server writes the error log to the console and sets the log_error system variable to stderr. On Windows, by default, the server writes the error log to the host_name.err file in the data directory. You can customize the path and file name of the error log by setting the value of the log_error system variable.
Commonly logged errors
Some common errors that MySQL logs to the error log are as follows:
- Permission errors
- Configuration errors
- Out of memory errors
- Errors with initiation or shutdown of plugins and InnoDB
Filtering the error log
MySQL database logs have the option to filter error logs, should you want to focus on critical errors. You can set the verbosity of the error log by changing the value of the log_error_verbosity system variable. Permitted values are 1 (errors only), 2 (errors and warnings), 3 (errors, warnings, and notes), with a default of 3.
MySQL 8.0 also provides error filtering based on user-defined rules using the log_filter_dragnet system variable. You can read more about how to enable this filtering on the official MySQL documentation.
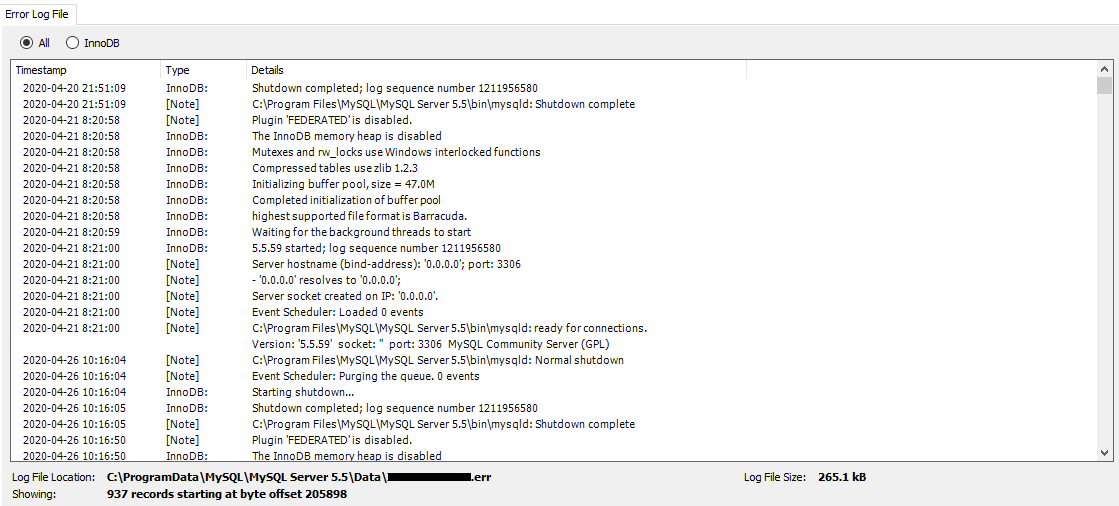
The picture below shows a snippet of the error log.

4. Binary Log
The binary log is used by MySQL to record events that change the data within the tables or change the table schema itself. For example, binary logs record INSERT, DELETE and UPDATE statements but not SELECT or SHOW statements that do not modify data. Binary logs also contain information about how long each statement took to execute.
The logging order of a binary login is in contrast with that of the general query log. Events are logged only after the transaction is committed by the server.
MySQL writes binary log files in binary format. To read their contents in text format, you need to use the mysqlbinlog utility. For example, you can use the code below to convert the contents of the binary log file named binlog.000001 to text.
mysql> mysqlbinlog binlog.0000001
Purpose of the binary log
The primary purpose of the binary log is to keep a track of changes to the server’s global state during its operation. Thus binary log events can be used to reproduce the changes which have happened on a server earlier. The binary log has two important applications.
- Replication: The binary log is used on the main server to record all of the events that modify database structure or content. Each replica that connects to the main server requests a copy of the binary log. The replica then executes the events from the binary log in order to reproduce the changes just as they were made on the main server.
- Data Recovery: Data recovery operations also make use of binary logs. When a database is restored from a backup file, the events in the binary log that were recorded after the backup was made are re-executed. This makes the restored database up to date with the original.
Binary logging formats
MySQL database logs offer three formats for binary logging.
- Statement-based logging: In this format, MySQL records the SQL statements that produce data changes. Statement-based logging is useful when many rows are affected by an event because it is more efficient to log a few statements than many rows.
- Row-based logging: In this format, changes to individual rows are recorded instead of the SQL statements. This is useful for queries that require a lot of execution time on the source but result in just a few rows being modified.
- Mixed logging: This is the recommended logging format. It uses statement-based logging by default but switches to row-based logging when required.
The binary logging format can be changed using the code below. However, you should note that it is not recommended to do so at runtime or while replication is ongoing.
SET GLOBAL binlog_format = 'STATEMENT';
SET GLOBAL binlog_format = 'ROW';
SET GLOBAL binlog_format = 'MIXED';
Enabling binary logging on your MySQL instance will lower the performance slightly. However, the advantages discussed above generally outweigh this minor dip in performance.
5. Relay Log
Relay logs are a set of numbered log files created by a replica during replication from the main server. Relay logs also consist of an index file that contains the names of all used relay log files.
During replication, the replica reads events from the main server’s binary log and writes it onto its relay logs. It then performs all the events in order to be in sync with the main server. After all events in the file have been executed, the replication SQL thread automatically deletes relay log files that are no longer needed.
The format of the relay log is the same as that of the binary log, so the mysqlbinlog utility can be used to display its contents.
Configuration options
By default, relay log names are of the form host_name-relay-bin.nnnnnn where host-name is the name of the replica server and #nnnnnn is the sequence number. The default filename for the relay log index file is host_name-relay-bin.index. Both relay log files and the relay log index file are stored in the data directory.
The filename and path of relay logs and the relay log index file can be changed by setting the relay_log and relay_log_index system variables respectively. This is useful if you anticipate that the replica’s hostname might change from time to time.
Managing Log Files
Over time, MySQL database logs become large and cumbersome. It is necessary to manage log files for two important reasons.
First, you need to restrict the volume of log data to prevent old logs from taking up too much of your disk space. Second, breaking up your log files into smaller organized files makes troubleshooting and analyzing them much simpler.
Log rotation is a simple way to achieve this.
Log Rotation
Log rotation is the process in which the current log file is renamed, usually by appending a “1” to the name, and a new log file is set up to record new log entries. Each time a new log file is started, the numbers in the file names of old log files are increased by one. Based on the threshold of files to be retained, old log files are then compressed, deleted, or archived separately to save space.
Depending on your requirements, you can decide on the maximum size of a log file, the frequency of rotations, and how many old log files you want to retain.
On Linux, the logrotate utility can be used to automate rotation compression, removal, and mailing of log files. Logrotate can be run as a scheduled job daily or weekly or when the log file gets to a certain size. On other systems, you can run a similar script using a scheduler.
Conclusion
Logging is an indispensable tool for managing your MySQL instances. Gaining a deeper understanding of the five logs mentioned above will help you preempt, diagnose, and monitor issues as your application scales.
Although it may seem daunting at first, you will get better at troubleshooting and debugging logs over time. Start using them today!


