One Click Visibility: Coralogix expands APM Capabilities to Kubernetes
There is a common painful workflow with many observability solutions. Each data type is separated into its own user interface, creating a disjointed workflow that increases cognitive load and slows down Mean Time to Diagnose (MTTD).
At Coralogix, we aim to give our customers the maximum possible insights for the minimum possible effort. We’ve expanded our APM features (see documentation) to provide deep, contextual insights into applications – but we’ve done something different.
Why is APM so important?
Application Performance Monitoring (APM) is one of the most sophisticated capabilities in the observability industry. It allows engineers and operators to inspect detailed application and infrastructure performance metrics. This can include everything from correlated host and application metrics to the time taken for a specific subsystem call.
APM has become essential due to two major factors:
- Engineers are reusing more and more code. Open-source libraries provide vast portions of our applications. Engineers don’t always have visibility of most of our application(s).
- As the application stack grows more extensive, with more and more components performing increasingly sophisticated calculations, the internal behavior of our applications contains more and more useful information.
What is missing in other providers?
Typically, most providers fall victim to the data silo. A siloed mentality encourages engineers to separate their interface and features from the data, not the user journey. This means that in most observability providers, APM data is held in its own place, hidden away from logs, metrics, traces, and security data.
This makes sense from a data perspective. They are entirely different datasets typically used, with varying data demands. This is the basis for the argument to separate this data. We saw this across our competitors and realized that this was slowing down engineers, prolonging outages, and making it more difficult for users to convert their data into actionable insights.
How is Coralogix approaching APM differently?
Coralogix is a full-stack observability platform, and the features across our application exemplify this. For example, our home dashboard covers logs, metrics, traces, and security data:
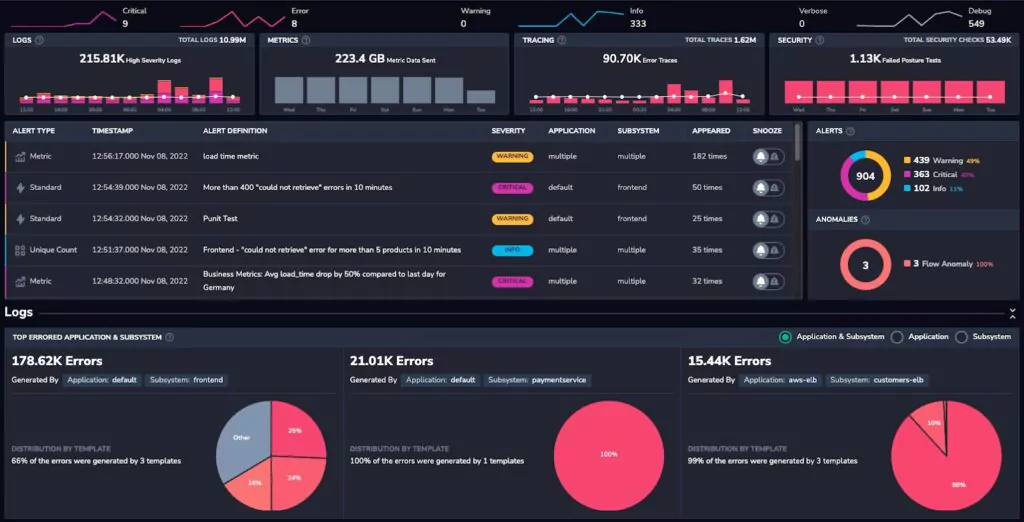
The expansion of our APM capability (see documentation) is no different. Rather than segregating our data, we want our customers to journey through the stack naturally rather than leaping between different data types to try and piece together the whole picture. With this in mind, It all begins with traces.
Enter the tracing UI and view traces. The filter UI allows users to slice data in several ways, for example, filtering by the 95th Percentile of latency.
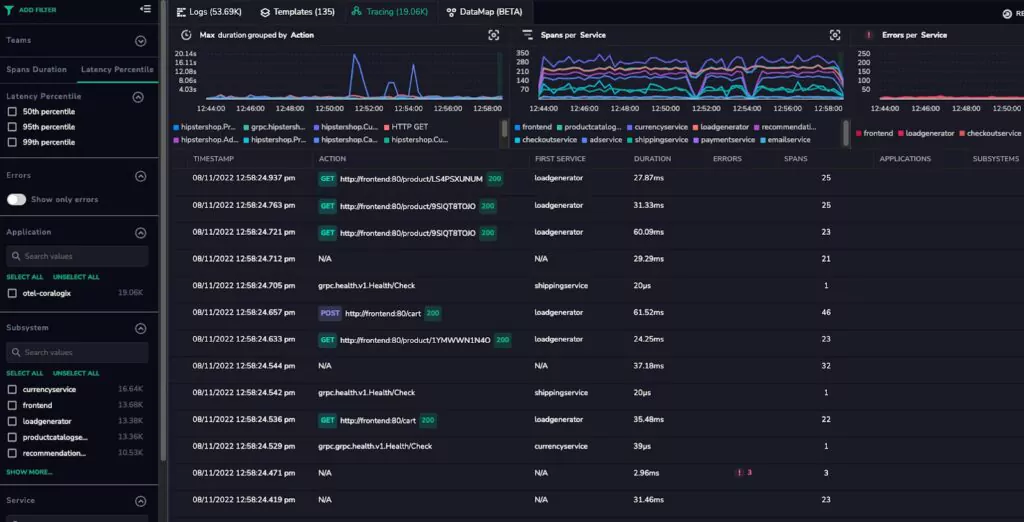
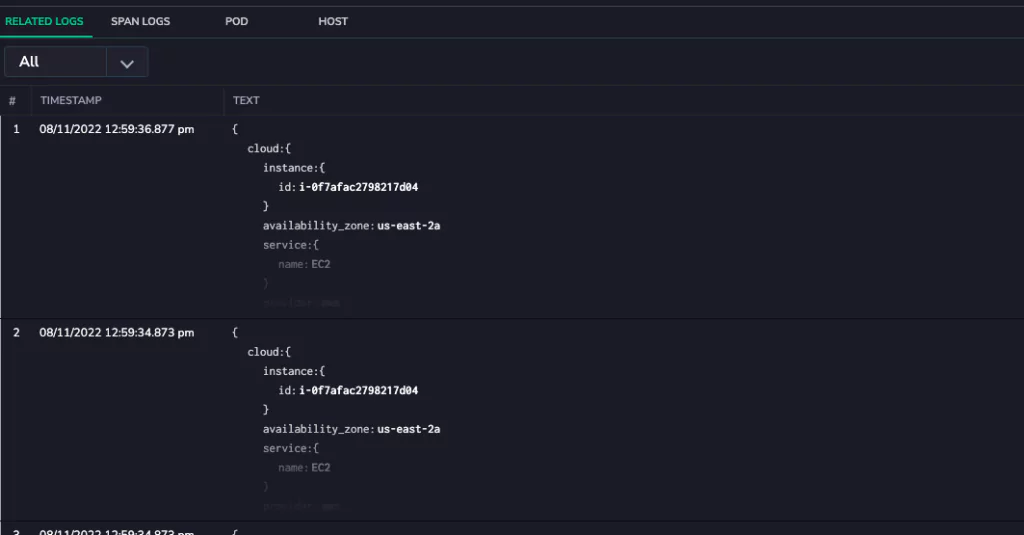
Select a span within a trace. This opens up a wealth of incredibly detailed metrics related to the source application. Users can view the logs that were written during the course of this span. This workflow is typically achieved by noting the time of a span and querying them in the logging UI. At Coralogix, this is simply one click.
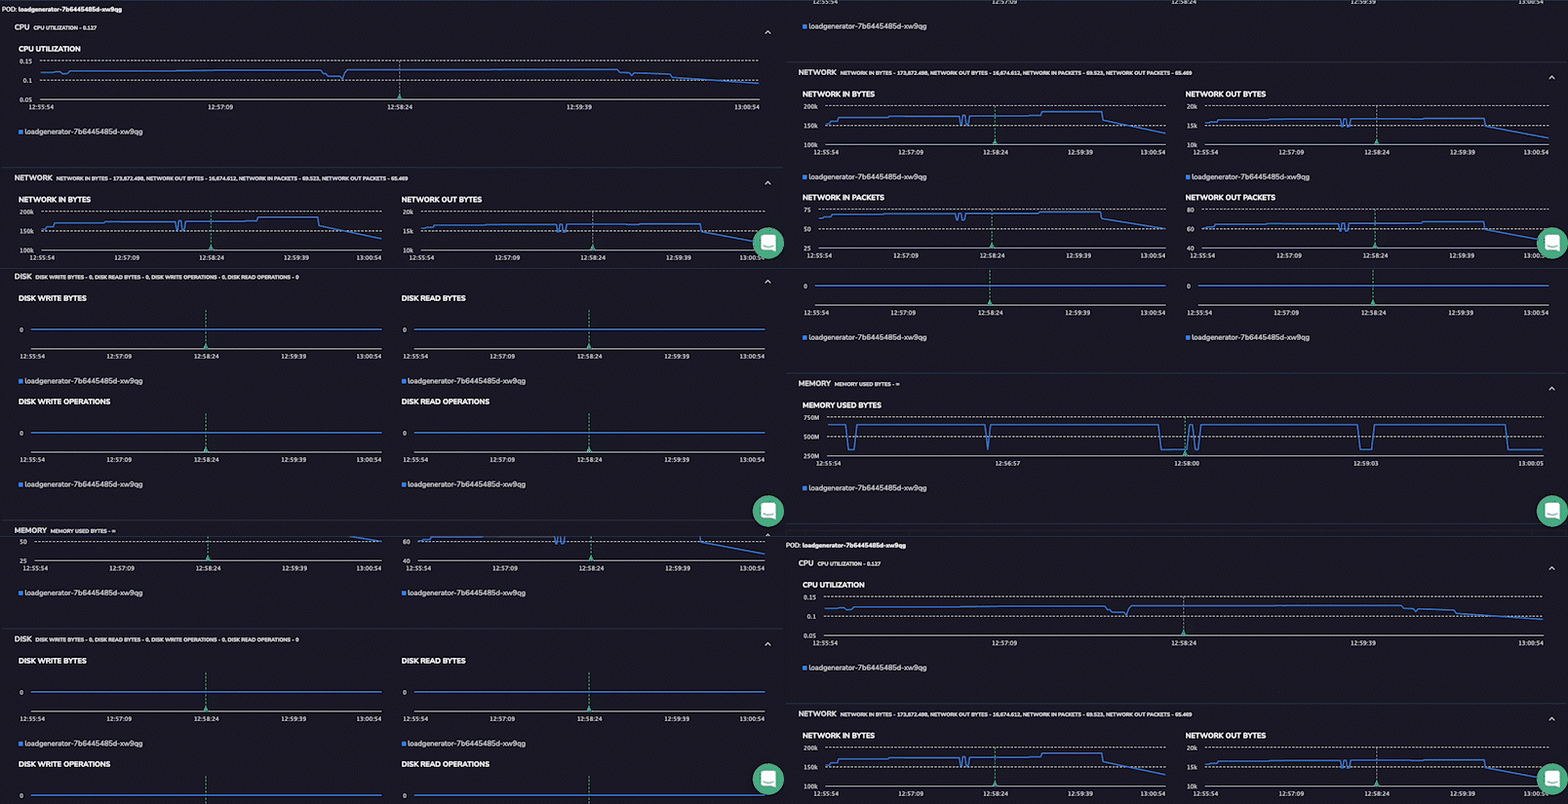
Track Application Pod Metrics
However, the UI now has the Pod and Host metric for a more detailed insight into application health at the time that the span was generated. These metrics will provide detailed insights into the health of the application pod itself within the Kubernetes cluster. It shows metrics from a few minutes before and after the span so that users can clearly see the sequence of events leading to their span. This level of detail allows users to diagnose even the most complex application issues immediately.
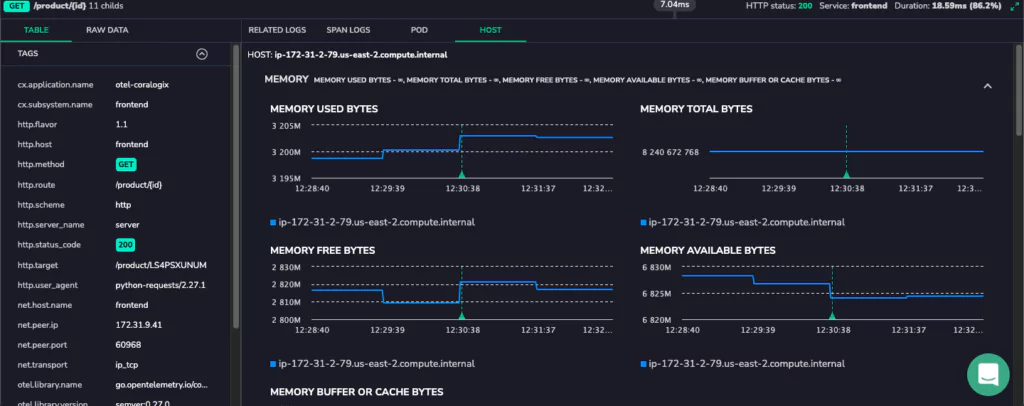
Track Infrastructure Host Metrics
In addition to tracking the application’s behavior, users can also take a wider view of the host machine. Now, it’s possible to detect when the root cause isn’t driven by the application but by a “noisy neighbor.” All this information is available, alongside the tracing information, with only one click between these detailed insights.
Tackle Novel Problems Instantly
If a span took longer than expected, inspect the memory and CPU to understand if the application was experiencing a high load. If an application throws an error, inspect the logs and metrics automatically attached to the trace to better understand why. This connection, between application level data and infrastructure data, is the essence of cutting-edge APM.
Combined with a user-focused journey, with Coralogix, a 30-minute investigation becomes a 30-second discovery.


