Comparing REST and GraphQL Monitoring Techniques

Maintaining an endpoint, especially a customer-facing one, requires constant log monitoring, whether using REST or GraphQL. As the industry has looked for solutions to build a more adaptive endpoint technology, it is also a must to monitor these endpoints. GraphQL and REST are two different technologies that allow user-facing clients to link to databases and platform logic. Both GraphQL and REST include monitoring techniques. Here, we will compare enterprise monitoring an endpoint using AWS API Gateway backed by a REST or GraphQL.
REST and GraphQL Monitoring Architecture
The architecture of a GraphQL versus a REST endpoint is fundamentally different. The architecture gives different locations available for monitoring your solution. Both RESTful and GraphQL systems are stateless, meaning the server and client do not need to know what state the other is in for interactions. Both RESTful and GraphQL systems also separate the client from the server. Either architecture can modify the server or client without affecting operations of the other as long as the format of the requests on the endpoint(s) remain consistent.
GraphQL Monitoring and Server Architecture
GraphQL uses a single endpoint and allows users to select what portion of the available returned data is required, making it more flexible for developers to integrate and update. GraphQL endpoints include these components:
- A single HTTP endpoint
- A schema that defines data types
- An engine that uses the schema to route inputs to resolvers
- Resolvers process the inputs and interact with resources.
Developers can place GraphQL Monitoring in any of several locations. Monitoring the HTTP endpoint itself will reveal all the traffic hitting the GraphQL server. Developers can monitor the GraphQL server where the server routes data from the endpoint to a specific resolver. Each resolver, query or mutation, can have monitoring implemented.
REST Monitoring and Server Architecture
RESTful architecture is similar in components to GraphQL but requires a very different and more strict setup. REST is a paradigm for how to set up an endpoint following some relatively strict rules. Many endpoints exist claiming to be REST, but they do not precisely follow these rules. Endpoints that do not conform to the rules are better defined as HTTP APIs. REST is robust but inflexible in its capabilities since each endpoint requires its own design and building. It is up to the developers to design their endpoints as needed, but many believe only endpoints following these rules should be labeled as REST.
Designing a RESTful API includes defining the resources that will be made accessible using HTTP, identifying all resources with URLs (or resources), and mapping CRUD operations to standard HTTP methods. CRUD operations (create, retrieve, update, delete) are mapped to POST, GET, PUT, and DELETE methods, respectively.
Each RESTful URL expects to receive specific inputs and will return results based on those inputs. Inputs and outputs of each resource are set and known by both client and server to interact.
Monitoring on RESTful APIs has some similarities to GraphQL. Developers can set up monitoring on the API endpoints directly. Monitoring may be averaged across all endpoints with the same base URL or broken up for each specific resource. When developers use compute functions between the database and the endpoint, developers can monitor these functions as well. If using AWS monitoring, it is common to use Lambda to power API endpoints.
REST and GraphQL Error Monitoring
REST Error Format
RESTful APIs use well-defined HTTP status codes to signify errors. When a client makes a request, the server notifies the client if the request was successfully handled. A status code is returned with all request results, signifying what kind of error has occurred or what server response the client should expect. HTTP includes a few categories of status codes. These include 200 level (success), 400 level (client errors), and 500 level (server errors).
Errors can be caught in several places and monitored for RESTful endpoints. The API itself may be able to monitor the status codes and provide metrics for which codes are returned and how often. Logs from computing functions behind the endpoint can also be used to help troubleshoot error codes. Logs can be sent to third-party tools like Coralogix’s log analytics platform to help alert developers of systemic issues.
GraphQL Error Format
GraphQL monitoring looks at server responses to determine if an issue has arisen. Errors returned are categorized based on the error source. GraphQL’s model combines errors with data. So, when the server cannot retrieve some data, the server will return all available data and append an error when appropriate. The return format for GraphQL resolvers is shown below:
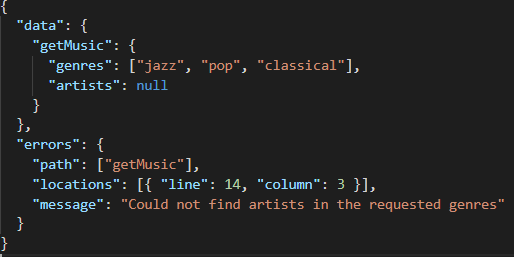
The Apollo server library allows developers to use internally generated syntax and validation errors that are applied automatically. Developers can also define custom error logic in resolvers so errors can be handled gracefully by the client.
A typical HTTP error can still be seen when there is an error in the API endpoint in front of a GraphQL server. For example, if the client was not authorized to interact with the GraphQL server, a 401 error is returned in the HTTP format.
Monitoring errors in a GraphQL endpoint is more complex than Restful APIs. The status codes returned tend towards success (200) since any data that is found is returned. Error messages are secondary if only parts of the data needed are missing. Errors could instead be logged in the compute function behind the GraphQL server. If this is the case, CloudWatch log analytics would be helpful to track the errors. Custom metrics can be configured to differentiate errors. Developers can use third-party tools like Coralogix’s log analytics platform to analyze GraphQL logs and automatically find the causes of errors.
AWS API Gateway Monitoring
Developers could use many tools to host a cloud server. AWS, Azure, and many third-party companies accommodate API management tools that accommodate either RESTful or GraphQL architecture. Amazon’s API Gateway tool allows developers to build, manage, and maintain their endpoints.
API Gateway is backed by AWS’s monitoring tools, including but not limited to CloudWatch CloudTrail, and Kinesis.
GraphQL Monitoring using CloudWatch API integration
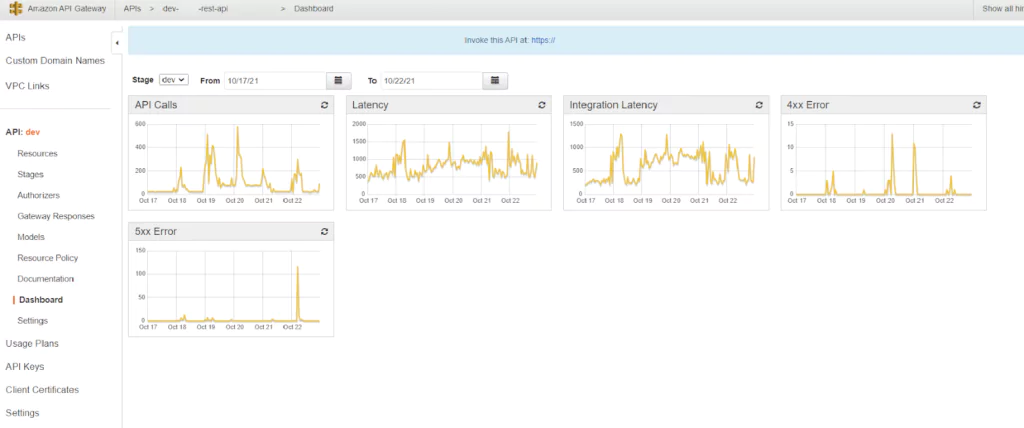
The API Gateway Dashboard page includes some high-level graphs. These all allow developers to check how their APIs are currently functioning. Graphs include the number of API calls over time, both latency and integration latency over time, and different returned errors (both 4xx and 5xx errors over time). While these graphs are helpful to see the overall health of an endpoint, they do little else to help determine the actual issue and fix it.
In CloudWatch, users can get a more clear picture of which APIs are failing using CloudWatch metrics. The same graphs in the API Dashboard shown above are available for each method (GET, POST, PUT, etc.) and each endpoint resource. Developers can use these metrics to understand which APIs are causing issues, so troubleshooting and optimization can be focussed on specific APIs. Metrics may be sent to other systems like Coralogix’s scalable metrics platform for alerting and analysis.
Since RESTful endpoints have different resources defined for each unique need, these separate graphs help find where problems are in the server. For example, if a single endpoint has high latency, it would bring up the average latency for the entire API. That endpoint can be isolated using the resource-specific graphs and fixed after checking other logs. With GraphQL endpoints, these resource-specific graphs are less valuable since GraphQL uses a single endpoint to access all endpoint data. So, while the graphs show an increased latency, users cannot know which resolvers are to blame for the problem.
Differences in Endpoint Traffic Monitoring
GraphQL and REST use fundamentally different techniques to get data for a client. Differences in how traffic is routed and handled highlight differences in how monitoring can be applied.
Caching
Caching data allows for reducing the traffic requirements of your endpoint. The HTTP specification used by RESTful APIs has caching requirements. Different endpoints can set up caching based on which path semantics are used. Servers can cache GET requests according to HTTP. However, since GraphQL uses a single POST endpoint, these defined specifications do not apply to GraphQL. It is up to developers to implement caching for non-mutable (query) endpoints. It is also critical that developers implement their requirements to separate mutable (mutation) and non-mutable (query) functions on their GraphQL server.
Resource Fetching
REST APIs typically require data chaining to get a complete data set. Clients first retrieve data about a user, then can retrieve other vital data subsequently using different calls. By design, REST endpoints are generally split to get data separately and point to different, single resources or databases. GraphQL, on the other hand, was designed to have a single endpoint that can point at many resources. So, clients can retrieve more data with a single query. GraphQL endpoints tend to require less traffic. This fundamental difference emphasizes the importance of traffic monitoring on REST endpoints over that need in GraphQL servers.
Summary
GraphQL uses a single HTTP endpoint for all functions and allows different requests to route to the appropriate location in the GraphQL server. Monitoring these endpoints can be more difficult since only a single endpoint is used. Log analytics plays a vital role in troubleshooting GraphQL endpoints because GraphQL monitoring is a uniquely tricky challenge.
RESTful endpoints use HTTP endpoints for each available request. Each request will return an appropriate status code and message based on whether the request was successful or not. Status codes can be used to monitor the health of the system and logs used to troubleshoot when functionality is not as expected.
Third-party metrics tools can be used to monitor and alert on RESTful endpoints using status codes. Log analytics tools will help developers isolate and repair issues in both GraphQL and RESTful endpoints.