Introducing System Datasets: Observing the Observability Platform
Modern observability platforms are great at explaining what’s happening in your apps and your infrastructure. However, all too often the observability platform itself remains a black box. As observability data and usage grow, governance almost always lags behind, and teams struggle to answer basic operational questions like:
- Why didn’t a specific alert trigger, or why did the notification never arrive?
- Which departments are driving our observability costs?
- Who changed a permission, schema, or quota last week?
- Which dashboards are no longer used?
This valuable data is typically fragmented across admin UIs, billing pages, support tickets, and tribal knowledge. As a consequence, the data is not queryable and hard to analyze, making it difficult for platform admins, FinOps, and others to extract meaningful operational or business insights.
That’s a problem. And it’s generally accepted as normal.
Today, Coralogix changes that.
Introducing System Datasets
We are introducing System Datasets: a new way to observe, analyze, and govern Coralogix using the same workflows you already use to observe everything else. System Datasets expose Coralogix user and platform activity as first-class, queryable data. In other words: observability for observability.
System Datasets allow teams to:
- Identify cost drivers
- Improve alert quality and reliability
- Audit access and configuration changes
System Datasets are stored as Parquet, queryable via DataPrime, and managed as a separately from your production telemetry.
The observability platform itself stops being a black box.
Why this exists and why it’s different
Most observability platforms stop at your applications and infrastructure. Internally, they rely on admin-only views, manual exports, and lengthy support-mediated investigations.
That model doesn’t scale, not operationally, not financially, and not from a governance standpoint. System Datasets take a different approach:
Platform behavior is data, and data should be observable, queryable, and governable.
Instead of introducing opaque UIs or a parallel audit system, Coralogix exposes platform activity alongside telemetry itself, using the same data model, tools, and workflows teams already trust.
In practice, every Coralogix account now includes opt-in System Datasets, hosted within a dedicated System Dataspace. The System Dataspace is a managed container for Coralogix-generated operational data, with System Datasets representing the individual, structured datasets within it.
System Datasets at launch
At launch, the System Dataspace includes a set of high-impact Datasets, each designed to answer real operational questions. Some examples include:
system/engine.queriesA full execution history of every query, who ran it, where it came from, how long it took, and how long it ran. This makes usage and performance analysis concrete instead of speculative.
system/alerts.historyA complete record of alert evaluations and triggers over time. Useful for identifying noisy or misconfigured alerts – using data, not anecdotes and feelings.
system/notification.deliveriesTracks alert notification deliveries to downstream systems, like Slack, PagerDuty etc. If a notification didn’t arrive, you can immediately know where and why it failed.
aaa.audit_eventsAuthentication events, permission changes, API key usage, and configuration updates. Security and compliance teams can finally self-serve auditability without exports or admin bottlenecks.
Additional Datasets cover schema changes, quota enforcement, and limit violations, with more Datasets rolling out continuously. Read about them all here.
Managing System Datasets in the UI
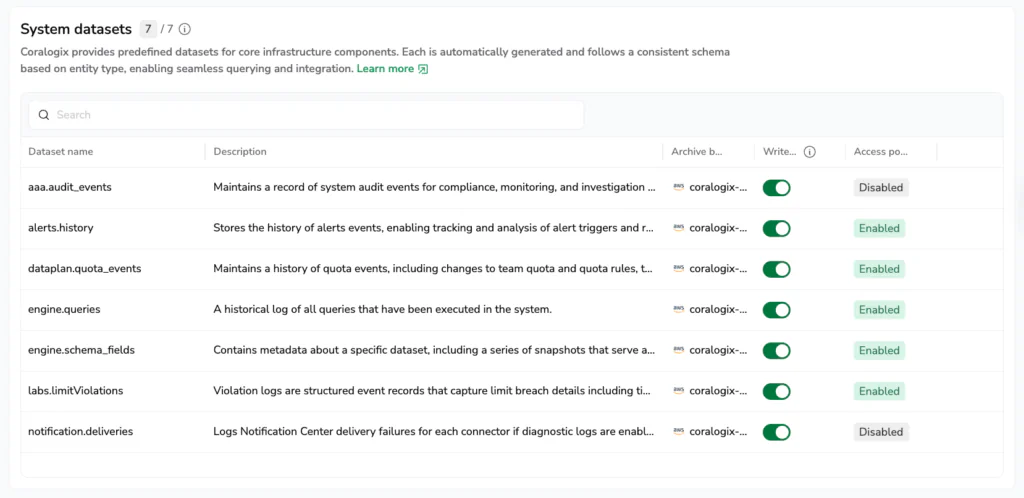
System Datasets are treated as first-class data and are managed directly in the Coralogix Dataset Management UI, under Data Flow → Dataset Management. From there, administrators can:
- View all available System Datasets and their descriptions
- Opt-in and enable or disable specific Datasets
- Apply fine-grained access policies and retention controls
This ensures platform metadata remains logically separated from production telemetry, while still being fully governable and secure.
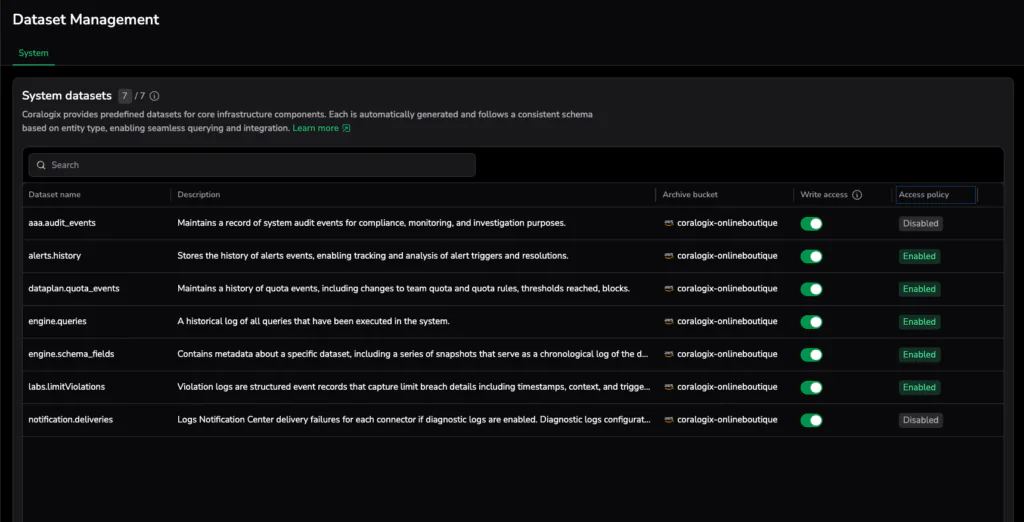
The image above shows the System Dataspace and its Datasets as they appear in the Dataset Management UI.
Read more about managing System Datasets, including how to enable or disable system datasets, here.
How you use it
System Datasets are available now in the dedicated System Dataspace. There’s no new tooling to learn.
To start analyzing query behavior, you can run:
source system/engine.queriesNote: Ensure you have the permission to access this Dataset in the Dataspace Management UI.
From there, you can build dashboards, alerts, and governance workflows exactly as you would for application telemetry, subject to the same access controls and retention policies.
Use-Case example: Reviewing complex queries
Teams often want to understand and optimize how complex or expensive queries are used, or even justify their cost.
In this example, the system/engine.queries dataset helps skip guesswork by identifying the most complex (and typically resource-intensive) queries, making usage patterns and ownership clear:
system/engine.queries
| filter queryInfo.semanticLabels.containsJoins == true
| groupby clientInfo.originatingTeamId:number as team aggregate count() as queries
| sortby queries desc
The query highlights teams executing JOIN-heavy queries. From here, you can easily break usage down by user, query type, or time range.
For example, you can replace clientInfo.originatingTeamId with clientInfo.originatingUserId to view usage per individual user, or add a time filter such as | filter $m.timestamp > now() - 1d to view recent join activity.
These help teams attribute cost and drive informed data-driven conversations about platform usage, through coaching teams, setting guardrails, or aligning observability spend with business priorities.
This is just one example. Explore our cookbook documentation for more System Dataset use cases and variations.
Looking ahead
System Datasets are the first step in treating observability platforms as governable systems that scale with organizations. By exposing platform behavior as data, Coralogix strives to enable teams with deeper operational control, accountability, and optimization. Future phases will build on this foundation by introducing Dataspaces and Datasets to additional areas.