Kafka Consumer Issues: Fixing JVM Garbage Collection Problems


Kafka has become the last word in data streaming. It provides a highly performant, highly available messaging capability. We, at Coralogix, make heavy use of Kafka and this forces us to tweak our services to get the best performance out of Kafka. The internet is littered with stories of mysterious issues when working with Kafka. These issues frequently arise from the underlying JVM, which is exactly where our issue originated for us.
Our Kafka Consumer Issues
Kafka supports different record sizes. The tuning of record size is a key part of improving cluster performance. If your data is too small, then records will suffer from network bandwidth overhead (more commits are needed) and slower throughput. Larger batch sizes offer the opportunity to minimize network overhead in your messaging.
In our case, our Kafka records contain the logs of our clients with additional metadata. We switched our data type from one log per record to many logs per record which allows us to reduce the duplication of the metadata in the records and generating fewer records. The observed behavior was simple. Our garbage collection pauses increased sharply and some Full-GC start to show up. So why did this happen?
Reason
Garbage collection is a JVM process that frees up memory and removes unused pointers to objects. There are lots of different algorithms for garbage collection. Each algorithm has its strengths and weaknesses. Most of our services use the G1GC algorithm so naturally, this was the GC algorithm that used on our Kafka Consumers. So how does the G1GC algorithm work and how did it contribute to our issues?
How G1GC works?
The G1GC algorithm starts by dividing all of the memory in the JVM into ~2,000 regions. The actual region size depends on the heap size (memory) in the JVM at the time.
| Min Heap Size | Region Size |
| heap < 4GB | 1MB |
| 4GB <= heap < 8GB | 2MB |
| 8GB <= heap < 16GB | 4MB |
| 16GB <= heap < 32GB | 8MB |
| 32GB <= heap < 64GB | 16MB |
| 64GB <= heap | 32MB |
Once the heap has been split up into regions, the algorithm then assigns one of four designations to each region that has been created:
- Eden – where brand new objects are stored.
- Survivor – where objects that survive after a garbage collection run are stored.
- Old – where objects that have been in survivor for a certain amount of time are stored.
- Free – Consists of regions not allocated to any logical heap and objects are allocated from here in exceptional circumstances (read below!)
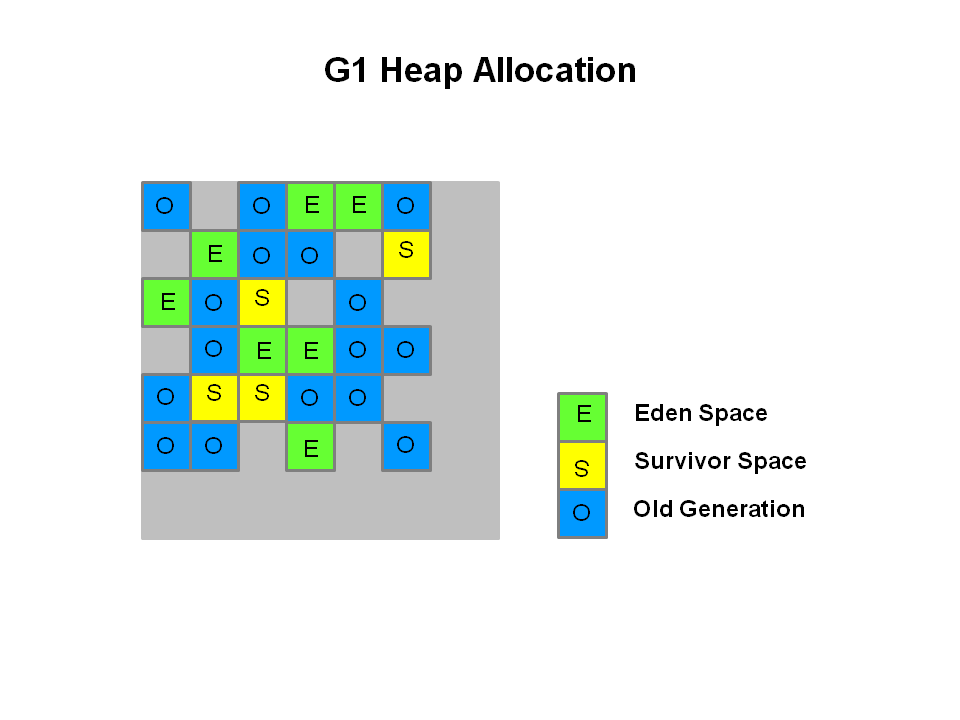
These designations are important because they impact how and where the algorithm begins looking for memory to free up. Let’s look at how the algorithm uses the regions and associated designations to remove unused objects from the heap.
GC events:
- Minor GC event:
- When allocating an object, it is allocated in the Eden space. This means that those regions that have been designated as “Eden” are the first place that new objects will be added.
- After the Eden space gets full, a “Minor Garbage Collection” (Minor GC) will start. A Minor GC seeks to free up memory by removing objects from Eden and Survivor regions only. This helps to keep these regions empty and available for new objects.
- After the Minor GC has finished, any objects that remain in the Eden space will be moved into the Survivor space.
- Objects in the survivor space that pass the age threshold are moved to the “Old Generation” region. Any objects that haven’t met the age threshold will remain in the survivor space.
- Mixed GC event: It is a Minor GC with some of the old regions are also cleared out (This event is more complicated than a Minor event and will not be explained here).
- Full GC event: Everything is evacuated. This is typically a bad sign.
This means that quick-use objects, such as Kafka records, flow through this algorithm quite nicely and should be freed in Minor GC events. Alas, our issues persisted. What was going on?
Humongous Objects
Humongous objects are larger than typical objects. An object is deemed humongous if its size is greater than or equal to the size of a single region / 2. For example, if each region is 1MB, an object that is 550KB is humongous. This has a series of nasty side effects:
- If the regions contain humongous objects, space between the last humongous object in the region and the end of the region will be unused. For example, our 550KB object prevents any other objects from being stored in the 1MB region, meaning 450KB remains unused. When we have lots of these objects, it results in a great deal of unused space and creates fragmentation.
- Humongous objects are allocated out of Free space and in the event of failure while allotting space, it will trigger a Full GC to clear some room. Yikes!
- Until Java 1.8u40, the releasing of humongous regions was only done during full GC events. Fortunately, we used jdk8u190 and so didn’t run into this issue.
- It can trigger a Minor GC to clear out unreferenced humongous objects. It doesn’t matter if the Eden space is full or not. This means more GC cycles, which can impact performance.
Here is an example of how the heap may look, when littered with humongous objects:
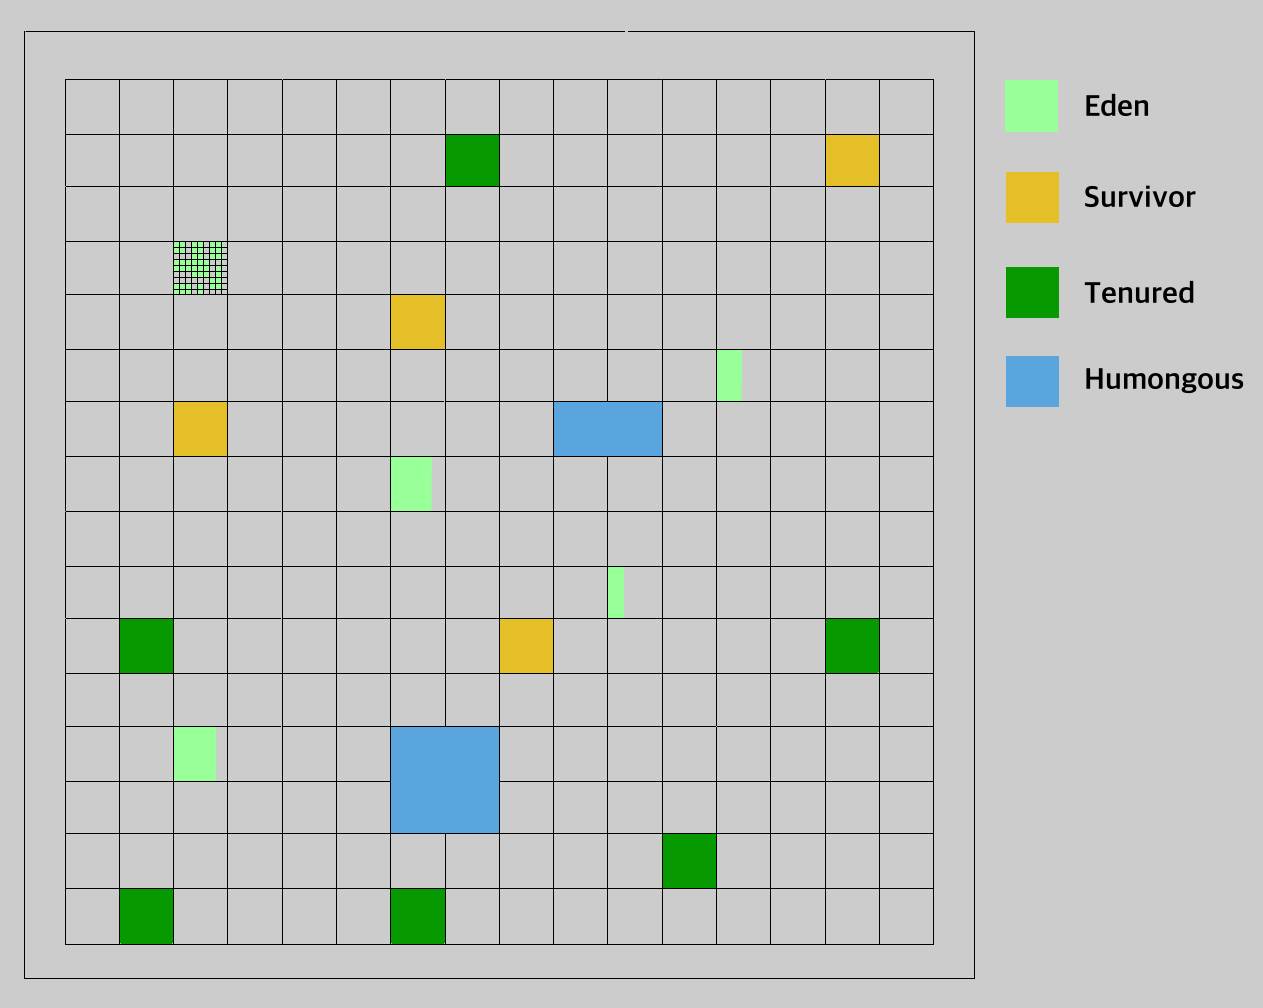
We were creating a lot of Humongous Objects
When we started batching multiple logs into the same record, the records became larger. This resulted in larger objects in the JVM. Many of these objects were larger than 500KB, which passed the threshold to be classified as a humongous object. The fragmentation began. When the problems began piling up, we began investigating.
Experimenting with Batch Sizes
We had a suspicion that the problem was these batch sizes, so we ran an experiment on a small scale with both small and large batch sizes. The results were clear and gave us the signal we needed to make the fix.
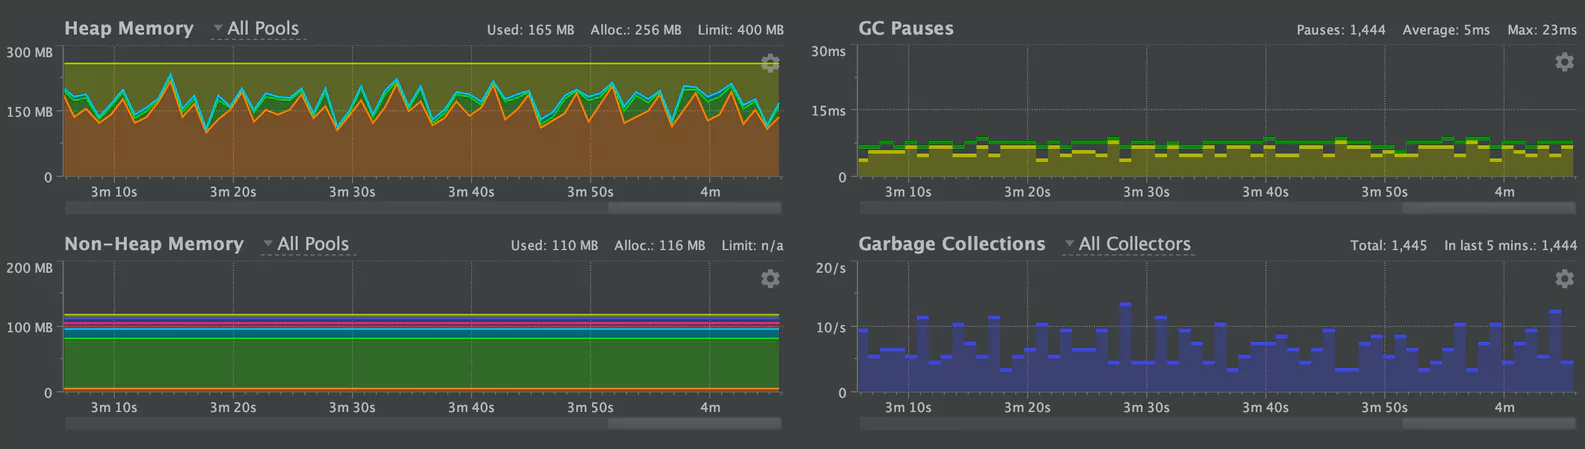
Large Batch Sizes (Intentionally Humongous)
We ran our test against large batch sizes (3MB) which greatly exceeded the size of our regions. This would guarantee a humongous object. We observed a high number of garbage collections, but that wasn’t all. We also saw that the “old” regions were very volatile, indicating that the objects were persisting long enough to make it into the old region.
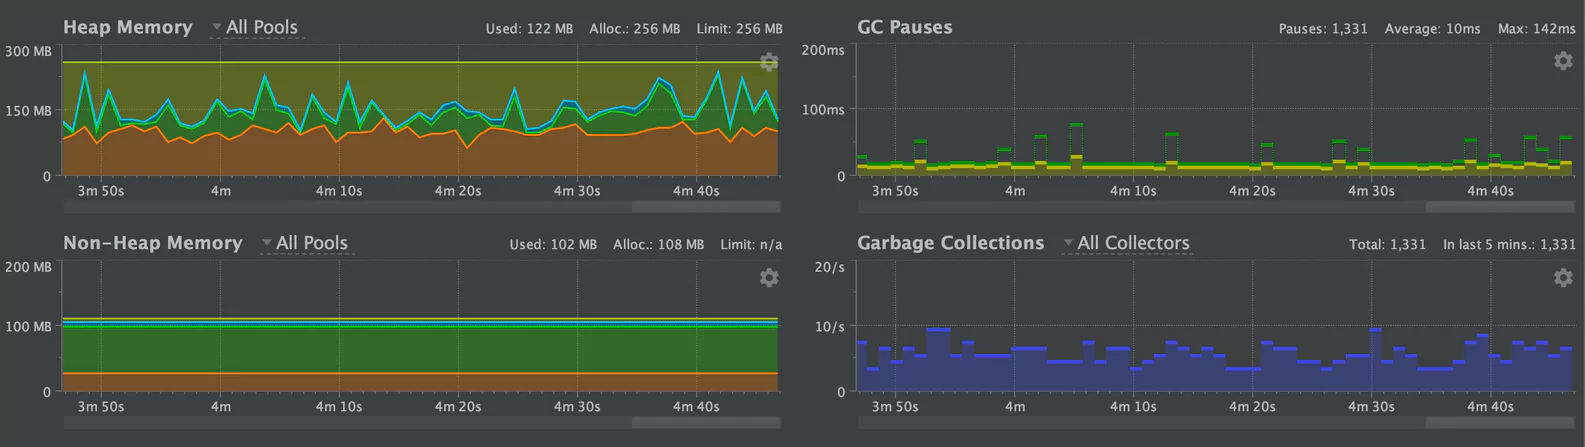
By now, we had a repeatable test case. The only thing left to do was to test our hypothesis, by using smaller batch sizes.
Small Batch Sizes
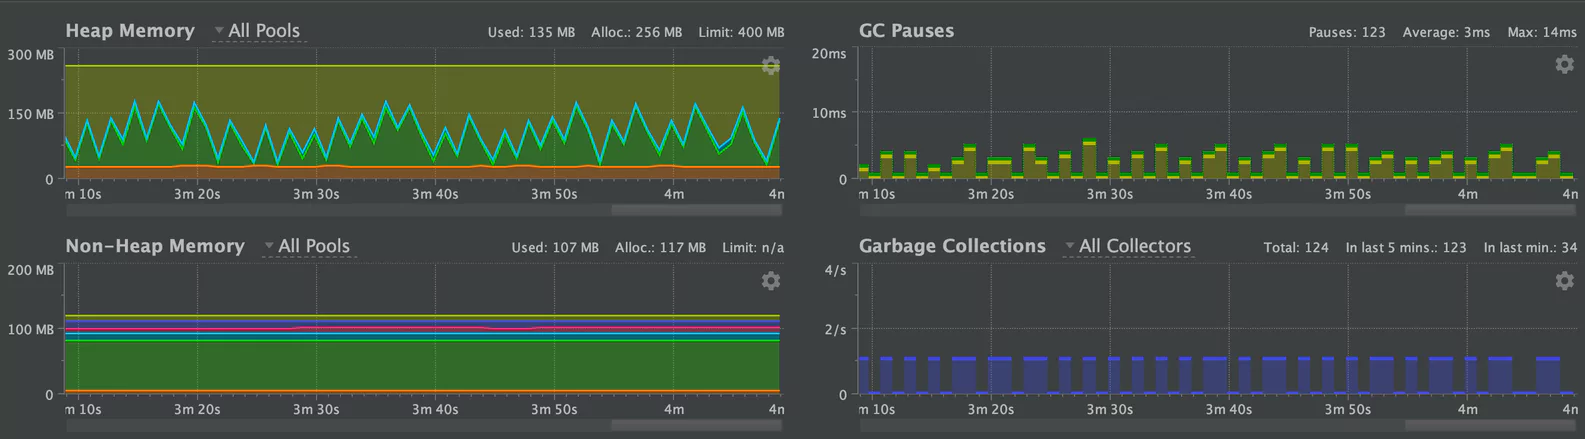
We ran our test with batch sizes of 25KB. This was well below the size threshold for a humongous object. We saw the following results for small batches:
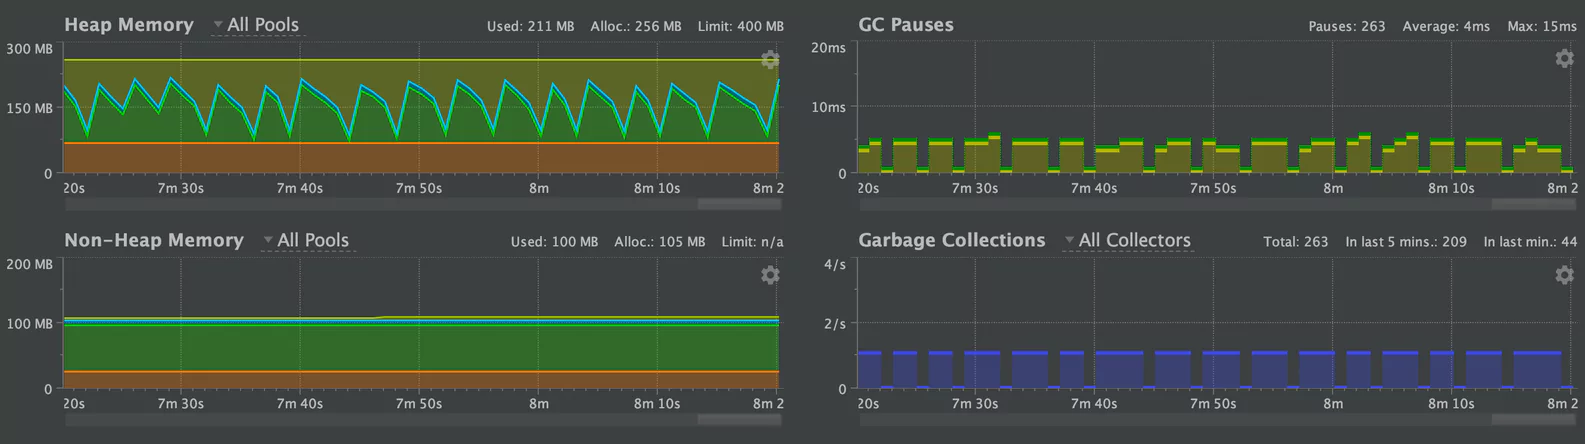
This tells a completely different story. Now, the old region is entirely flat. Objects are being cleared out of survivor space and are not hitting the timeout threshold. Crucially, the average GC pause time is 4ms – less than half the 10ms with large objects. Armed with this information, we designed a solution.
Solution
First, upgrade to JDK 11
The G1GC algorithm has been greatly improved between JDK8 and JDK11. Our version of Scala was compatible with JDK11, so upgrading was straight forward. These improvements greatly increased the performance of the garbage collector. Here is the same measurement, with a 3MB object. Note the average GC pause time of 5ms:
Tune our new JVM
While things are running better, we still weren’t happy with the performance. Using 25KB batch sizes on our new JVM indicated that the G1GC algorithm was still having some trouble:
We came up with two steps that we thought might improve performance, driven by docs on humongous allocations, the G1GC algorithm and the experience of other engineers.
- Change the region size to a bigger region with -XX:G1HeapRegionSize=n. However, that has a serious trade-off. Bigger regions mean fewer regions which can lead to worse performance.
- Allocate more space to the Free regions, using the -XX:G1ReservePercent flag.
There was one other option. This took a little bit of work, but the results were excellent.
The big one – Changing to ZGC
In JDK11, a new GC was delivered – ZGC. ZGC boasts some outstanding benchmarks when dealing with large objects. We did this cautiously, but in the end, the comparison between our different deployments left no room for doubt – ZGC was the winner:
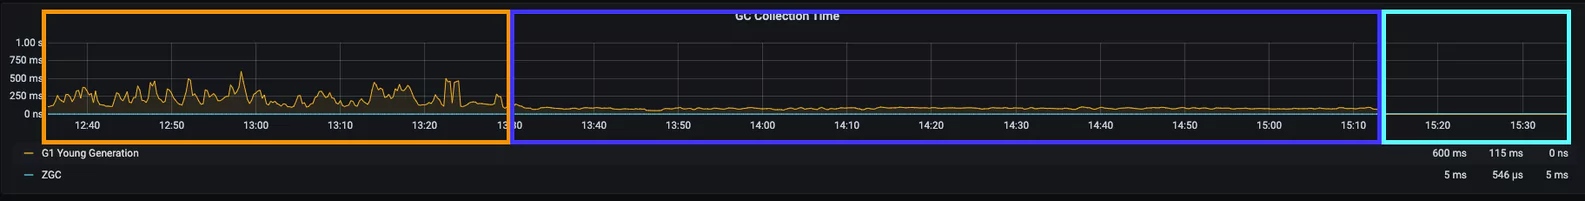
Orange: JDK8 G1GC (Average of 231 ms for young GC)
Blue: JDK11 G1GC (Average of 79 ms for young GC)
Light Blue: JDK11 ZGC (Average of 5 ms for ZGC)
There is still a lot for us to learn about the underlying garbage collection algorithms. Using the data, some patience and creative thinking, we solved our issues and greatly improved the stability of our pipeline.
It is an exciting time to join Coralogix’s engineering team. If this sounds interesting to you, please take a look at our job page — Work at Coralogix. If you’re particularly passionate about stream architecture, you may want to take a look at these two openings first: FullStack Engineer and Backend Engineer.
Thanks for reading. Drop us a message if you have questions or want to discuss more how we use Kafka Streams.
References
- https://plumbr.io/handbook/gc-tuning-in-practice/other-examples/humongous-allocations
- https://product.hubspot.com/blog/g1gc-fundamentals-lessons-from-taming-garbage-collection#HumongousObjects
- https://ionutbalosin.com/2019/12/jvm-garbage-collectors-benchmarks-report-19-12/
- https://www.oracle.com/technetwork/tutorials/tutorials-1876574.html
- https://xmlandmore.blogspot.com/2014/11/g1-gc-humongous-objects-and-humongous.html
- https://www.youtube.com/watch?v=OhPGN2Av44E
- https://www.baeldung.com/jvm-zgc-garbage-collector
- https://www.youtube.com/watch?v=WU_mqNBEacw