Keeping digital services reliable is more important than ever. When something goes wrong in production, on-call teams face significant pressure to identify and resolve the incident quickly – in order to keep customers happy. But it can be difficult to get the right signals to the right person in a timely fashion. Most teams use a combination of observability platforms (like Coralogix) to identify and alert on signals, and then some type of paging or routing system that passes these alerts onward.
Being able to automate this process – so the first time an on-call responder sees an alert, they have all the necessary information to triage the severity of the incident and understand the root cause – saves significant time, helping teams restore services faster and keep customers satisfied.
In this post, we’ll cover how StackPulse and Coralogix can be used together to automatically enrich alerts for faster and better incident management.
What is StackPulse?
StackPulse is an integration first platform — it easily connects to all the systems you are using today to ingest data. As data is sent to the platform, it’s automatically enriched using the characteristics of the event and by pulling more information from other integrations (eg. reaching out to a Kubernetes cluster or using a cloud service provider’s API). StackPulse can also bundle this information and deliver it to the communications platforms that your teams are already using.
One core capability of StackPulse is the ability to take an alert and enrich it before an operator starts their process of responding to the event. This helps to minimize alert fatigue, as this real-time context and information reduces time invested in triaging, analyzing, and responding to events. With StackPulse you can create automated, code-based playbooks to investigate and remediate events across your infrastructure.
StackPulse Playbooks are built from reusable artifacts called Steps. StackPulse allows you to easily build and link steps together to perform actions that interface with multiple systems, as we’ll do with this example. We’ll cover this in more detail later on, as this adds a lot of power to the integration between Coralogix and StackPulse.
Using StackPulse and Coralogix to Enrich and Alert on Data
StackPulse can communicate bi-directionally with Coralogix, an observability platform that analyzes and prioritizes data before it’s indexed and stored. This ability allows for teams to more effectively and efficiently respond to incidents as the time needed for manual investigations and setting up alerts is eliminated almost entirely.
In this example, we’ll spotlight how StackPulse ingests alerts from Coralogix, reacts to an event, and goes on to gather additional context-specific information from the Coralogix platform and a Kubernetes cluster. The enrichment of the initial event is done automatically, without any manual steps — based on the context of the alert.
Along the way, we’ll cover different components of the scenario in detail. In this example, Coralogix is receiving logs from an application — a Sock Shop microservices demo running on a Google Kubernetes Engine cluster.
Coralogix is configured to monitor the health of the application and sends dynamic alerts powered by machine learning to StackPulse via a webhook configuration when critical application or cluster errors are found. We also have a Slack workspace setup with the StackPulse app installed and configured.
StackPulse will ingest the alerts and use the information in the alert payload to provide context for a StackPulse Playbook to perform the alert enrichment and remediation actions.
Incidence Response for Kubernetes Log Error
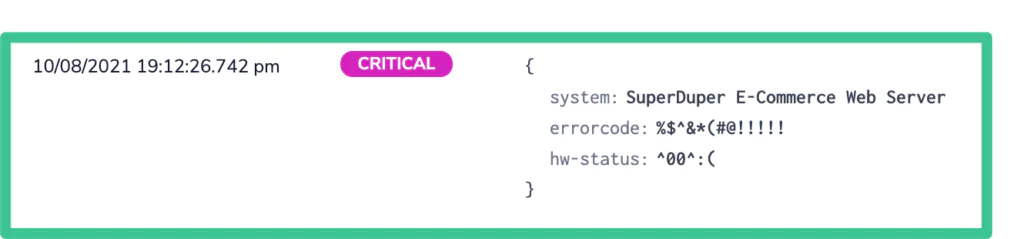
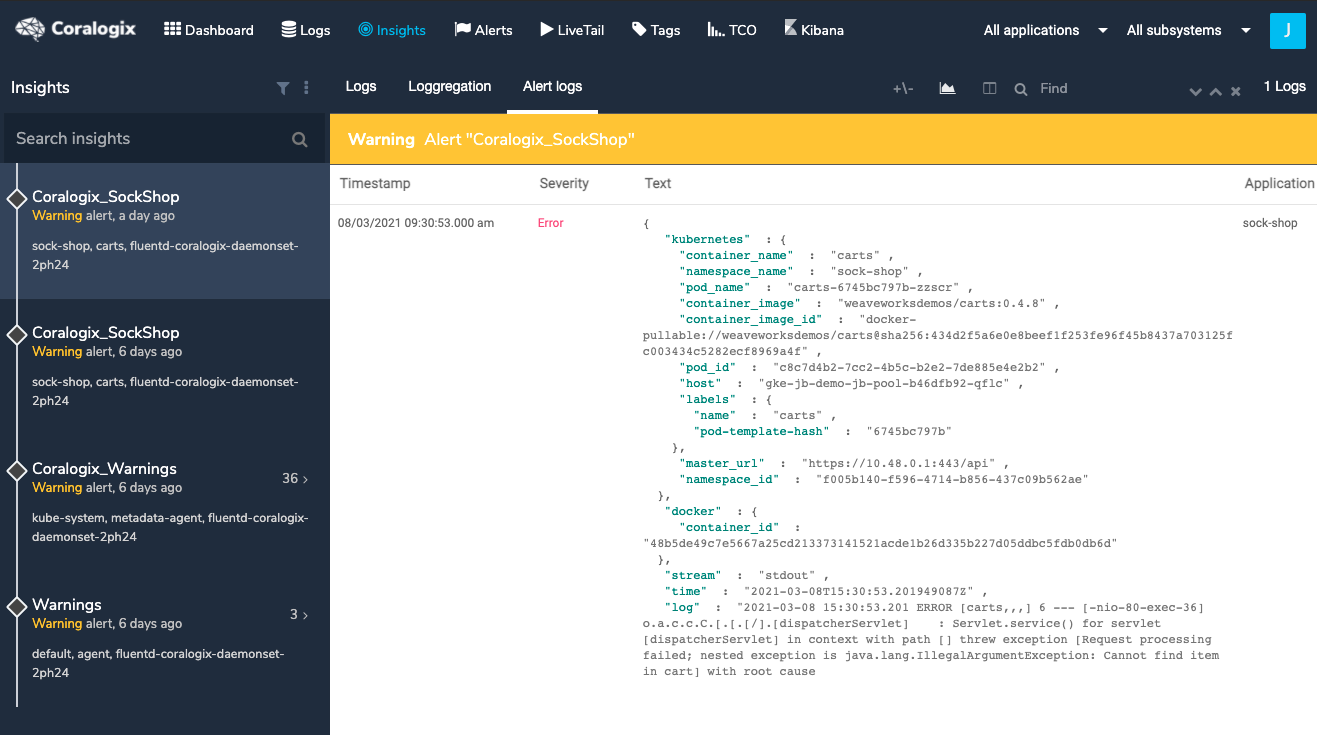
Our example begins when an alert is generated in the Coralogix platform after an error is identified in the Kubernetes logs.
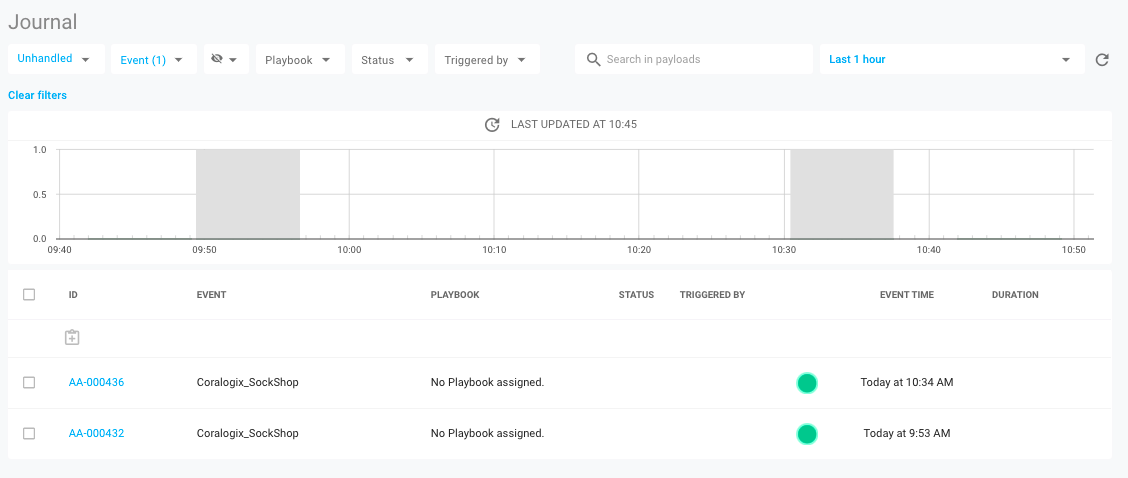
When this happens, the Coralogix platform sends the event to a configured integration in StackPulse. The first view of this data in StackPulse is in the Journal, which is a federated view of all events passing into the StackPulse Platform.
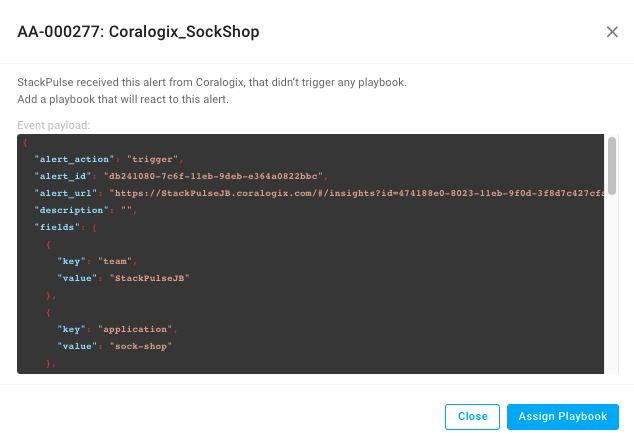
If we click on the event in the Journal we can see the raw payload coming from Coralogix.
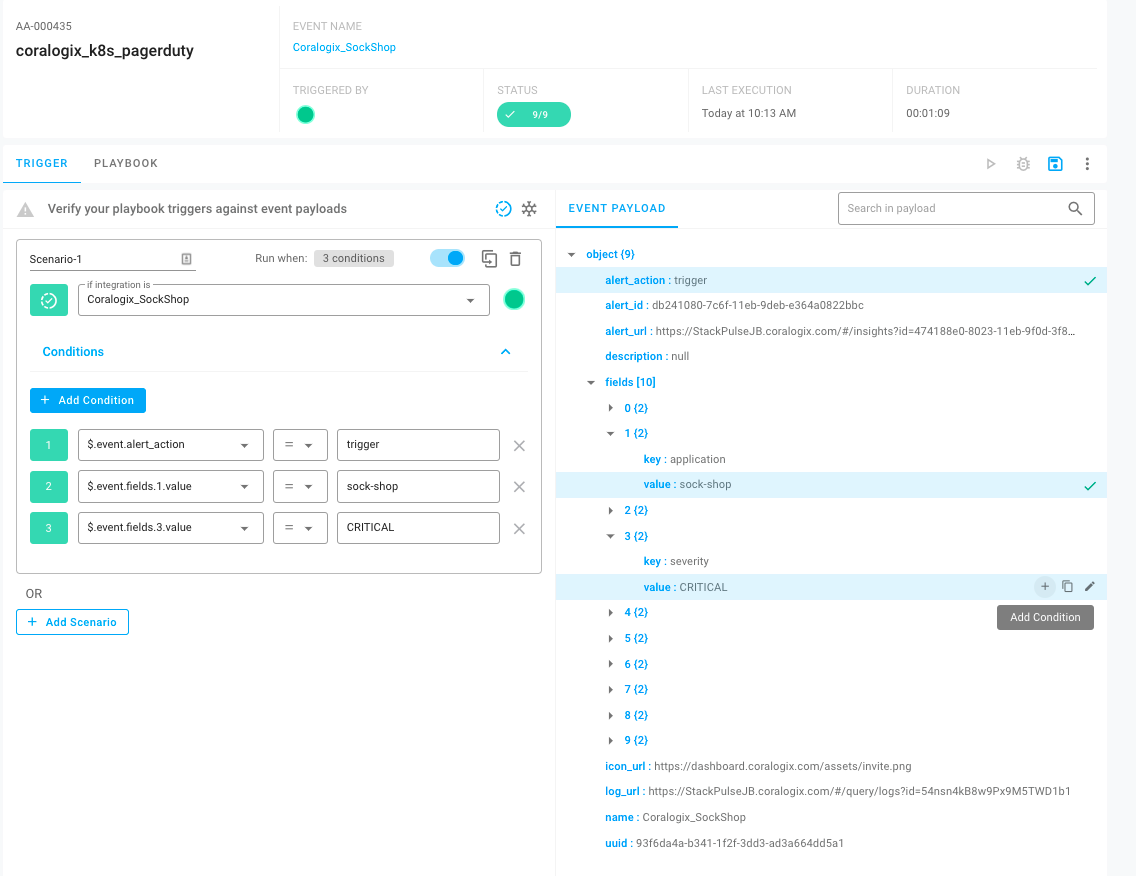
Using the payload from the event, we can build a Trigger based on a set of conditions that will initiate a Playbook. To configure the Trigger, we can use the StackPulse interface to view the payload of the event in the Playbook Planner and easily select the conditions within the payload.
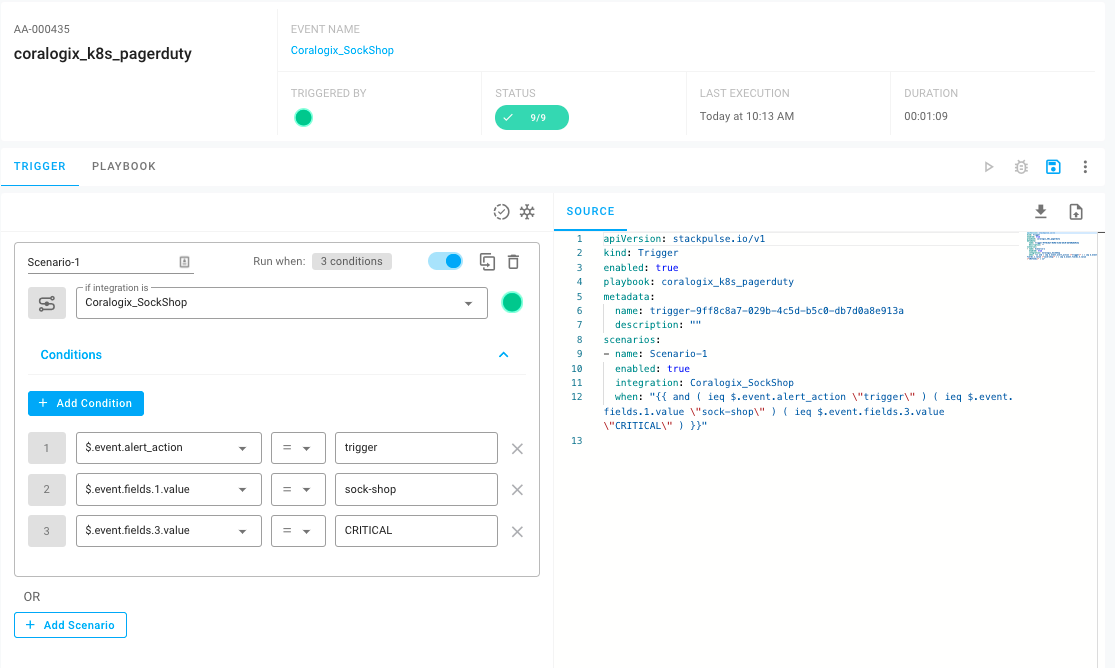
Here we can see the Trigger’s definition in YAML. The nice thing here is that you don’t have to type any of that out, it’s all built from clicks within the GUI. If you’ve worked with Kubernetes before, this will look similar to a custom resource definition.
For this Trigger, we’re looking first for an event coming in from Coralogix_SockShop. Next, we’re looking for three values within the event payload — the Alert Action is trigger, the Application is sock-shop and the Alert Severity is critical. When all of these conditions are met, this would cause a Playbook to run.
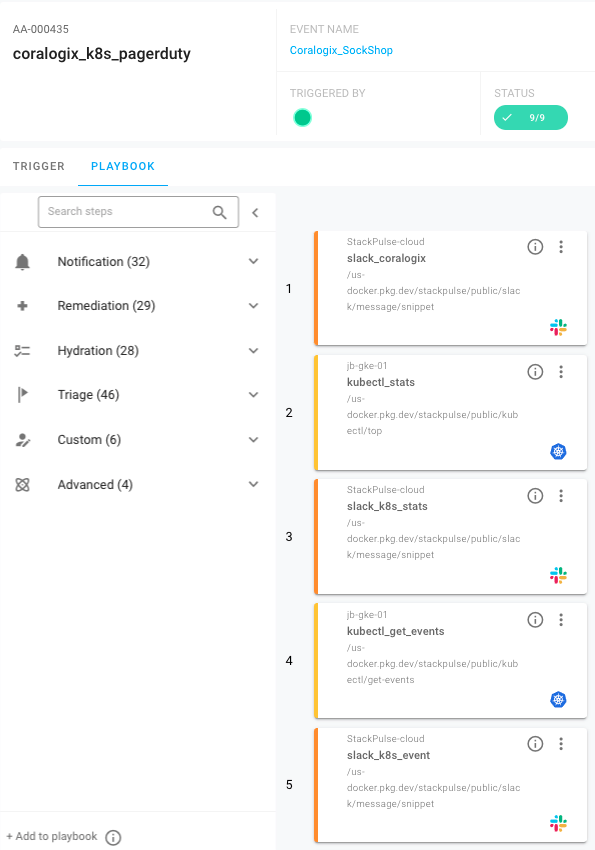
Now that we have the Trigger defined, we can build out the Playbook itself. This Playbook will run when a payload is received from Coralogix matching the conditions in the Trigger above, and it will have a few steps:
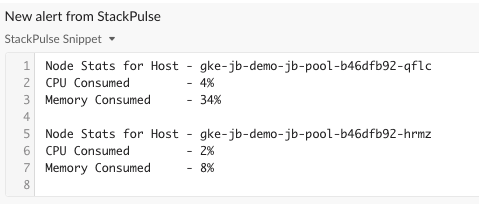
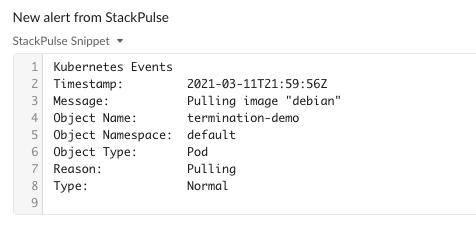
- Communicate with the Kubernetes cluster to gather statistics and events
- Combine that information with the original alert from Coralogix, sending it to slack
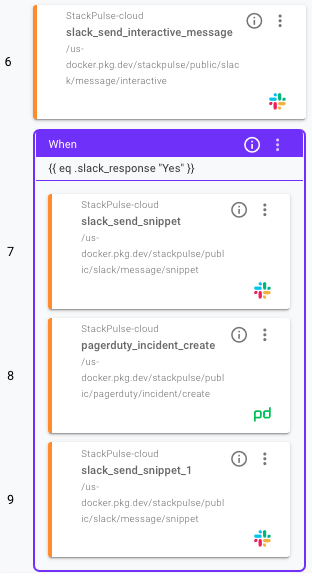
- Ask the Slack channel if they would like to escalate to the on-call engineer. If so, it will create an incident in PagerDuty
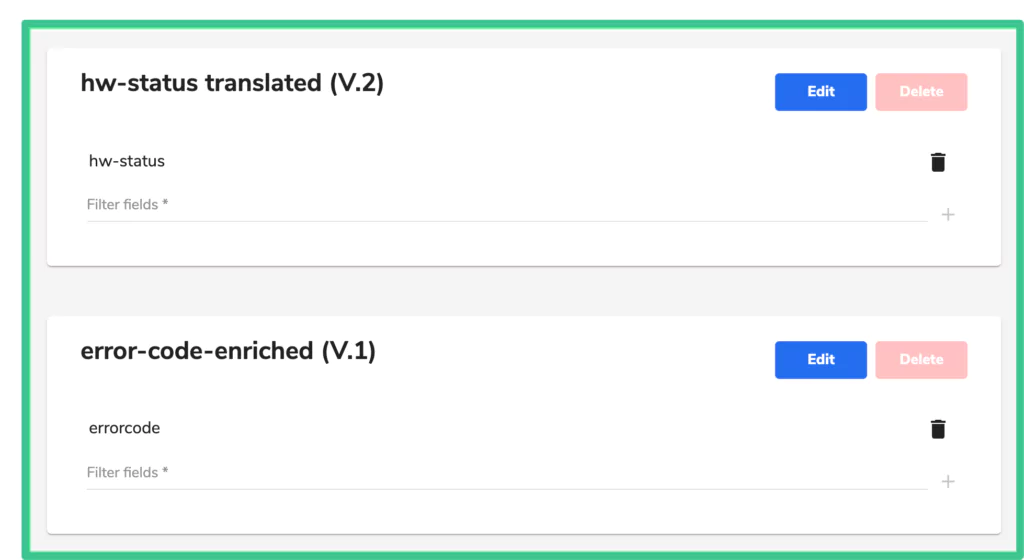
We can use the StackPulse Playbook Planner to build out each individual step. Using the library of prebuilt steps, you can simply drag and drop from the planner to your Playbook.
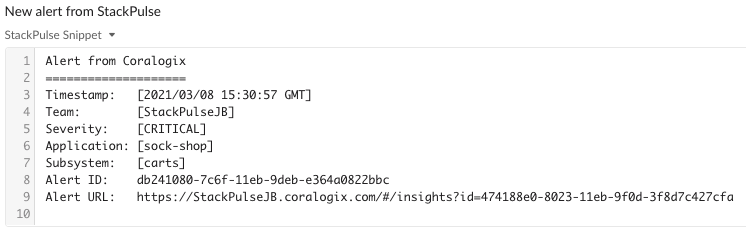
These first steps gather information from Kubernetes, posting that to Slack along with the original Coralogix alert. Here’s what that looks like:
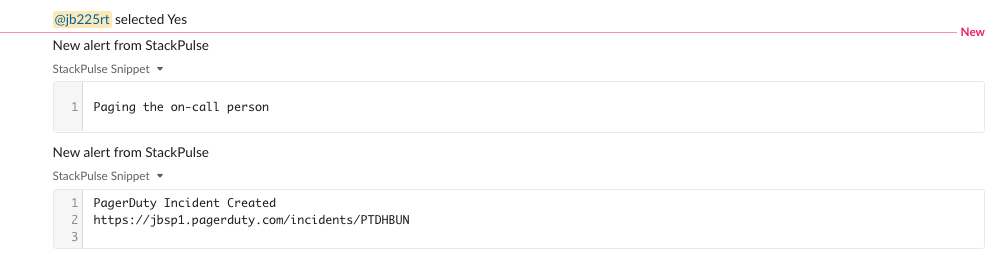
After we provide the alert enrichment to Slack, StackPulse will ask the channel if they’d like to page the on-call person. If a teammate selects Yes, a PagerDuty incident will be created to alert the on-call person.
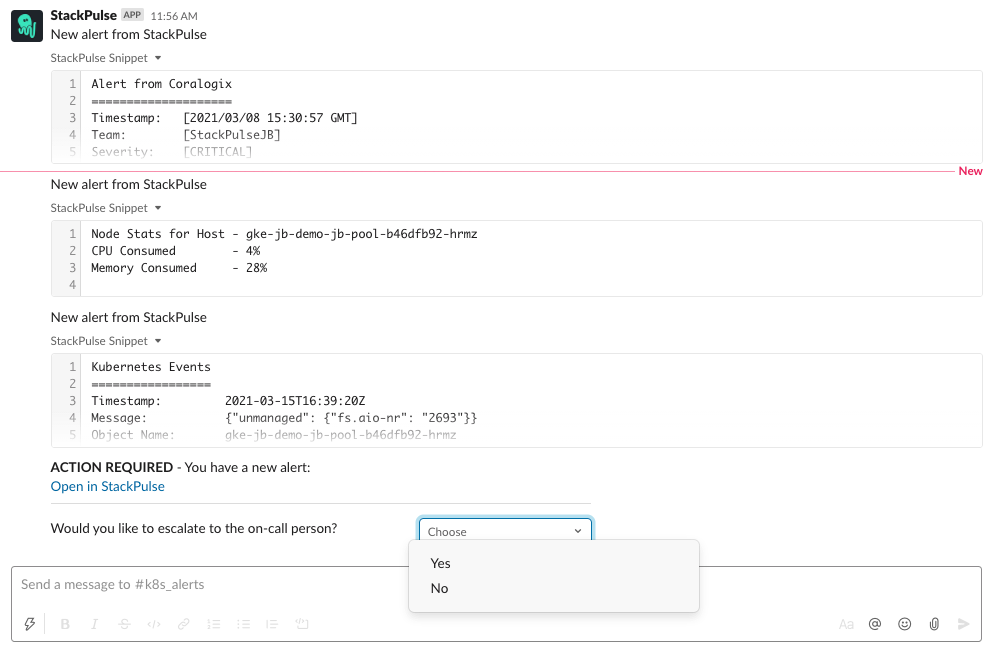
Here’s the complete picture of the output and interaction within Slack.
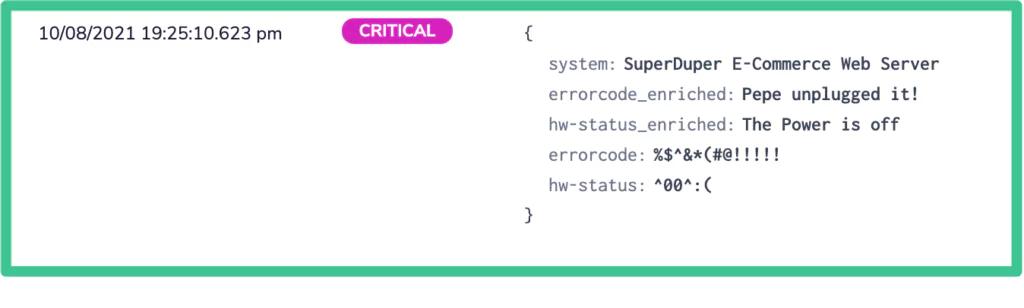
As you can see, StackPulse automatically enriched the alert with relevant information from the cluster. This means the operator responding to the alert has all the context needed to evaluate the health of the cluster without having to perform any manual actions.
Summary
There you have it! Hopefully this post provides you with some clarity on how easy it is to use the StackPulse and Coralogix integration to ingest alerts and automatically react to events using context-specific information.
StackPulse offers a complete, well-integrated solution for managing reliability — including automated alert triggers, playbooks, and documentation helpers. Ready to try? Start a free trial with Coralogix or with StackPulse to see what we have to offer.
 The new standard of observability is here. Discover Olly, the industry’s first