The new standard of observability is here. Discover Olly, the industry’s first
Knocking On The Party Door
Some of your users are having a party; dancing away, having a great time. But a couple of users are stuck outside in the rain, knocking on the door, trying to get in. Unfortunately, you can’t hear them because of all the noise happening inside.
That’s what it feels like when you gradually roll out new features across your user base without the right monitoring. A small slice of users can be having a terrible time and you don’t realise until support tickets spike or the 1-star reviews start rolling in. If you’re using feature flags to ship safely, you also need a clear way to watch those rollouts and roll them back if needed – so no users get left outside in the rain.
Feature Flags Need Special Treatment
Feature flags from a remote configuration service let you gradually roll out new features to users. That’s powerful: you can turn features on and off with no code changes or deployments – often with a single click. But feature flags aren’t “just configuration”. They change how your system needs to be monitored in a few important ways.
Firstly, you now have multiple behaviours running side by side. A single screen or endpoint may have a control version and one or several treatments. Secondly, rollouts are usually gradual. You start with 1%, then 5%, then 10% of traffic, watching to see what happens before you ramp up. Thirdly, different cohorts see different things depending on platform, geography, account type, or even experiment group.
Most engineering teams wire up flags, ship the code, and keep staring at the same aggregate charts: overall error rate, overall latency, overall conversion. If those lines stay flat, everyone relaxes. Meanwhile, the 10% of traffic behind the new variant might be hitting more crashes, longer wait times, or mysteriously worse conversion – and nobody notices until finance or support starts asking awkward questions.
Questions You Should Be Able to Answer
For every important feature flag, your observability setup should make these questions almost boringly easy to answer:
- Who is seeing this flag, and how much traffic is behind it?
- Is it technically healthy? (errors, crashes, latency, resource usage)
- Is it good for user experience? (RUM, performance, session behaviour)
- Is it good for the business? (conversion, drop-off points, revenue, refunds, cancellations)
- Under what conditions should I stop the rollout and turn off the flag?
When you can answer those in seconds, flags stop being scary. They become just another dimension you slice by, like a platform or region. You’re no longer asking “Is the app okay?” but “Is the app okay for users on this new path?”.
Making Feature Flags Observable in Your Telemetry
The first step is obvious but often skipped: your telemetry has to know the flag exists. If your logs, metrics, traces, and RUM events can’t see the flag, they can’t tell you anything about it.
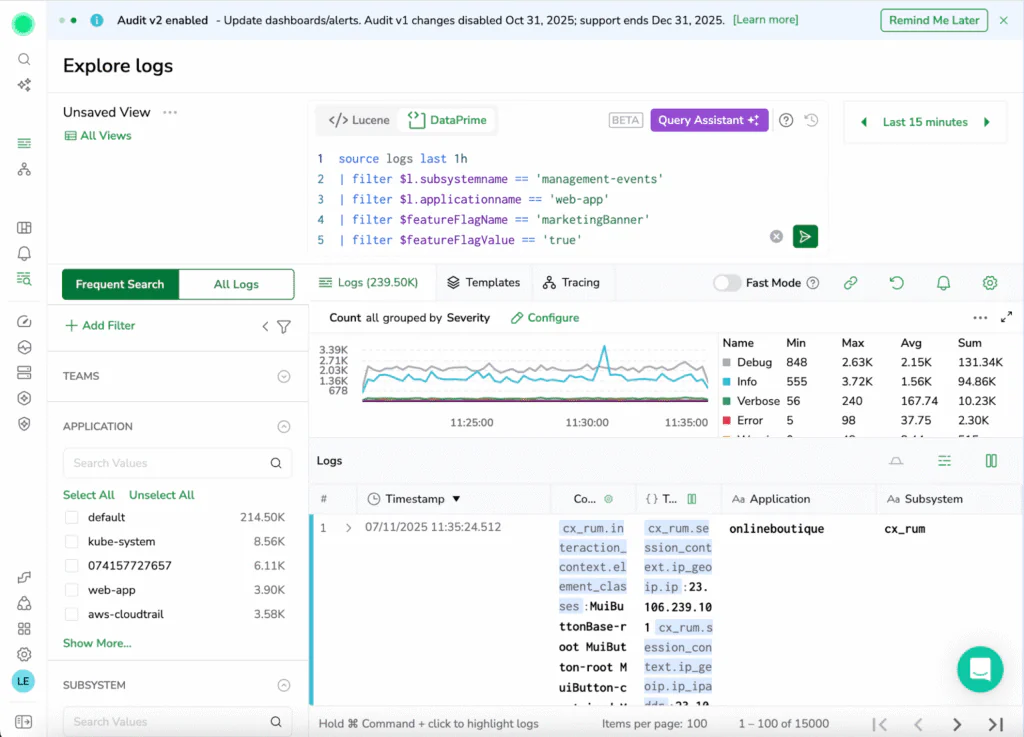
Wherever a feature flag changes behaviour, add context. That usually means including one or more custom fields such as feature_flag_name and feature_flag_value.
Once that context flows through your telemetry, you can:
- Build custom dashboards that compare users who see the new feature against those who don’t. Crash rate, latency, funnel drop-off – all sliced by flag value.
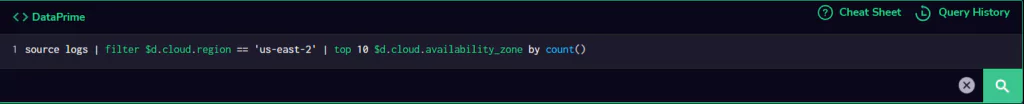
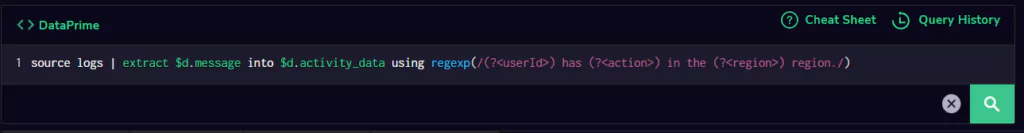
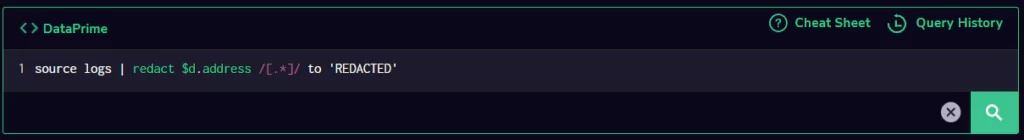
- Use Coralogix DataPrime queries over your logs and RUM events to drill into exactly what’s happening for users within the rollout. You can filter to specific paths, error codes, or user cohorts and see whether the new experience behaves differently from the control.
This is where gradual rollout really becomes a superpower. Instead of “we turned it on and nothing exploded… probably fine?”, you can say “for the 5% of traffic on the new checkout, crash rate is flat, latency is slightly better, and completion rate is up. Let’s take it to 25%.”
Defining the “Pull the Plug” Moment
The other side of the coin is knowing when to stop. Before you start a rollout, decide what “too risky” looks like. That could be as simple as:
- If crash-free sessions for the treatment drop more than 0.5% below control, stop the rollout.
- If median checkout time for the new flow is 20% slower than control for more than 15 minutes, turn the flag off.
- If conversion is worse for two consecutive ramp steps (1% → 5% → 10%), pause and investigate before going further.
Bringing Everyone Into the Party
Feature flags are meant to make experimentation safer. Without the right observability, they can quietly make things riskier, because problems hide in small cohorts.
If you propagate feature flag context into all your telemetry, build a few simple flag-aware dashboards, and define clear, pre-agreed stop conditions, then gradual rollouts go from nerve-wrecking to routine. You know who’s outside in the rain, you can hear them knocking early, and you can either invite them back into the party or politely shut the experiment down before it ruins the night.