 The new standard of observability is here. Discover Olly, the industry’s first
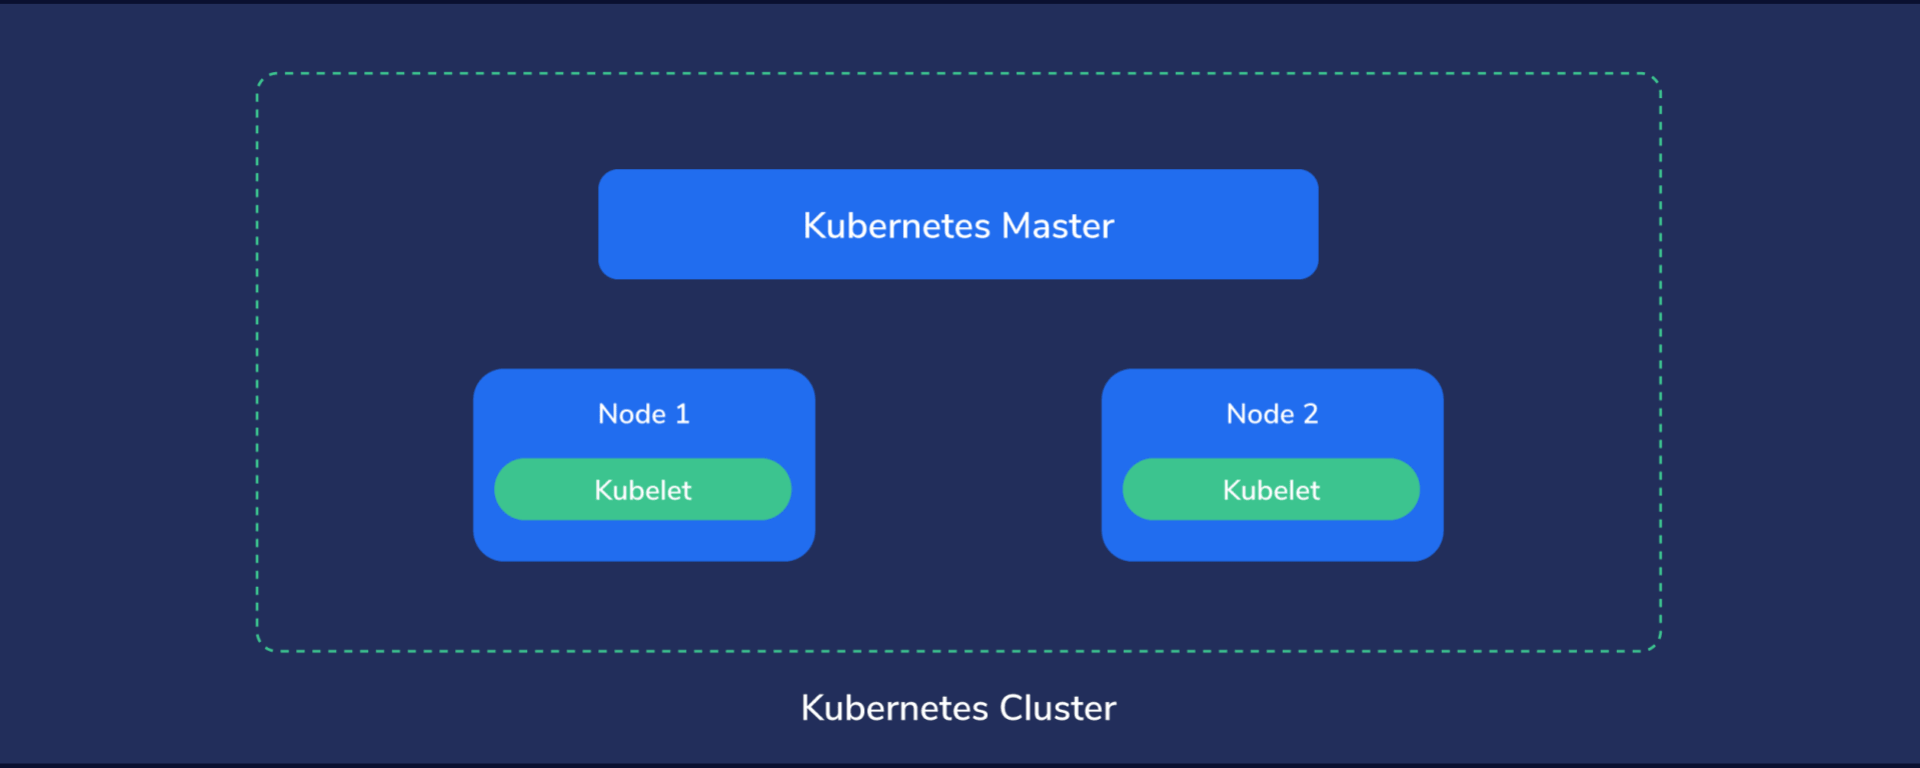
This part 2 of a 3-part series on running ELK on Kubernetes with ECK. If you’re just getting started, make sure to checkout Part 1.
Setting Up Elasticsearch on Kubernetes
Picking up where we left off, our Kubernetes cluster is ready for our Elasticsearch stack. We’ll first create an Elasticsearch Node and then continue with setting up Kibana.
Importing Elasticsearch Custom Resource Definitions (CRD) and Operators
Currently, Kubernetes doesn’t yet know about how it should create and manage our various Elasticsearch components. We would have to spend a lot of time manually creating the steps it should follow. But, we can extend Kubernetes’ understanding and functionality, with Custom Resource Definitions and Operators.
Luckily, the Elasticsearch team provides a ready-made YAML file that defines the necessary resources and operators. This makes our job a lot easier, as all we have to do is feed this file to Kubernetes.
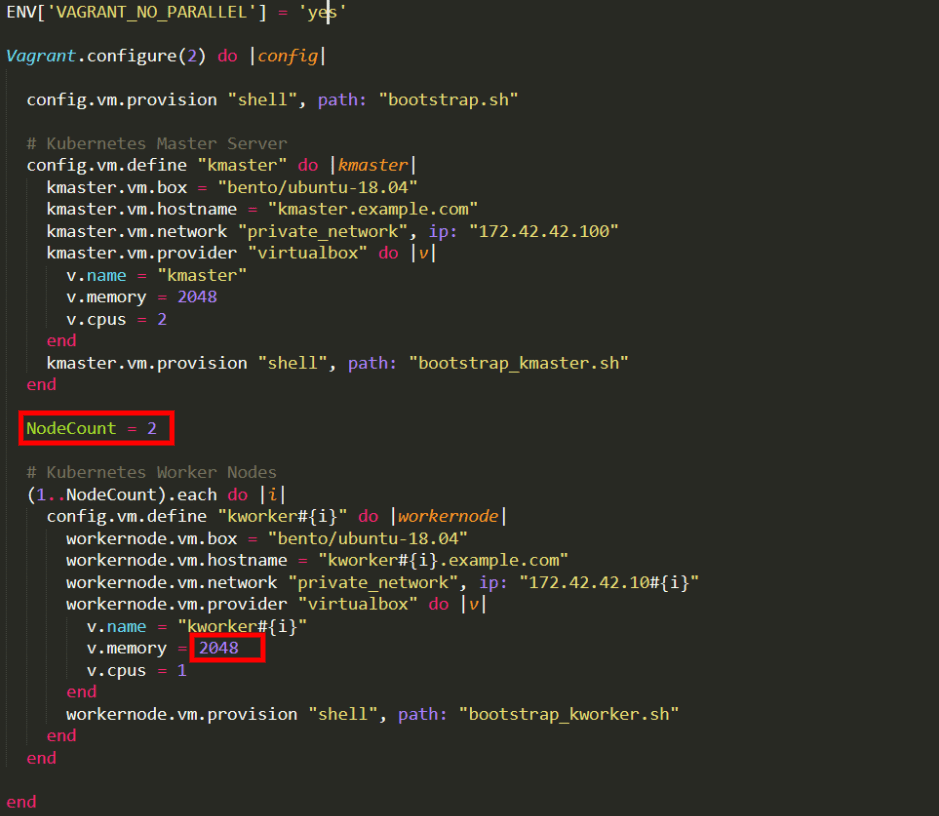
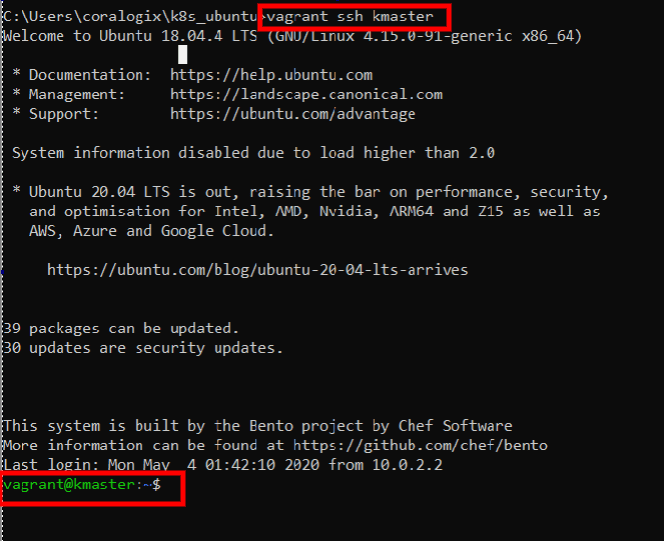
Let’s first log in to our master node:
vagrant ssh kmaster
Note: if your command prompt displays “vagrant@kmaster:~$“, it means you’re already logged in and you can skip this command.
With the next command, we import and apply the structure and logic defined in the YAML file:
kubectl apply -f https://download.elastic.co/downloads/eck/1.1.1/all-in-one.yaml
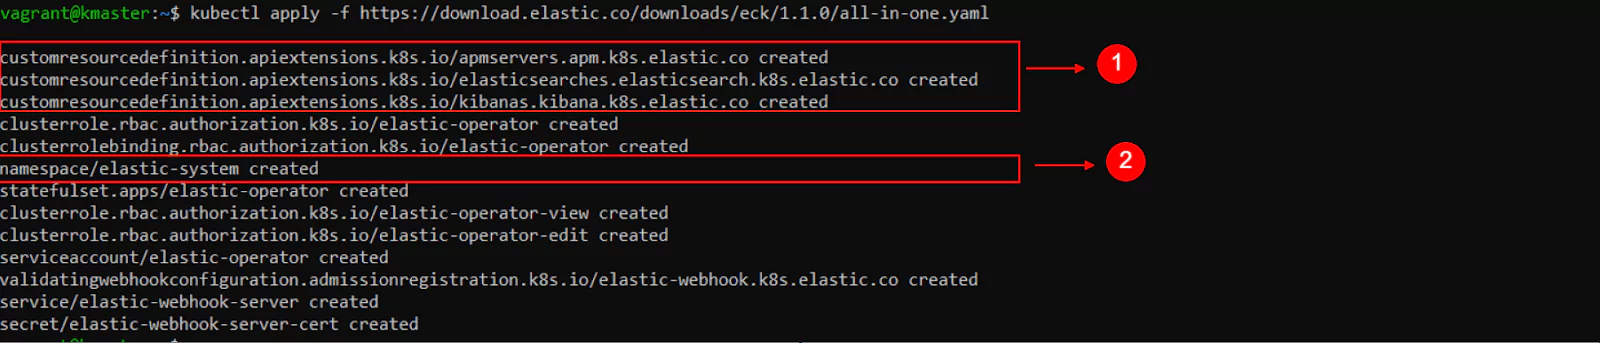
Optionally, by copying the “https” link from the previous command and pasting it into the address bar of a browser, we can download and examine the file.
Many definitions have detailed descriptions which can be helpful when we want to understand how to use them.
We can see in the command’s output that a new namespace was created, named “elastic-system”.
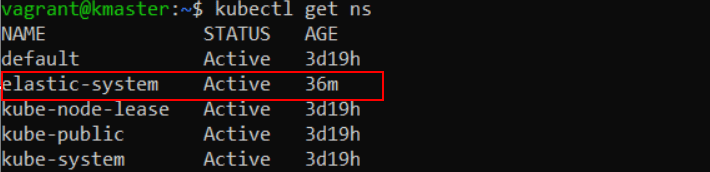
Let’s go ahead and list all namespaces in our cluster:
kubectl get ns
Now let’s look at the resources in this namespace:
kubectl -n elastic-system get all
“-n elastic-system” selects the namespace we want to work with and “get all” displays the resources.
The output of this command will be useful when we need to check on things like which Pods are currently running, what services are available, at which IP addresses they can be reached at, and so on.
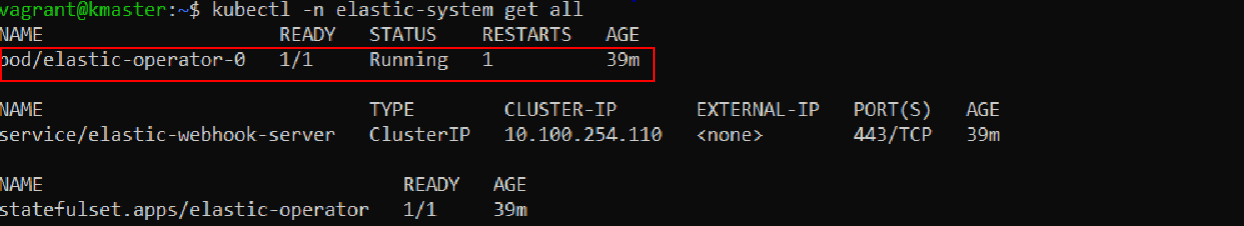
If the “STATUS” for “pod/elastic-operator-0” displays “ContainerCreating“, then wait a few seconds and then repeat the previous command until you see that the status change to “Running“.
We need the operator to be active before we continue.
Launching an Elasticsearch Node in Kubernetes
Now it’s time to tell Kubernetes about the state we want to achieve.
The Kubernetes Operator will then proceed to automatically create and manage the necessary resources to achieve and maintain this state.
We’ll accomplish this with the help of a YAML file. Let’s analyze its contents before passing it to the kubectl command:
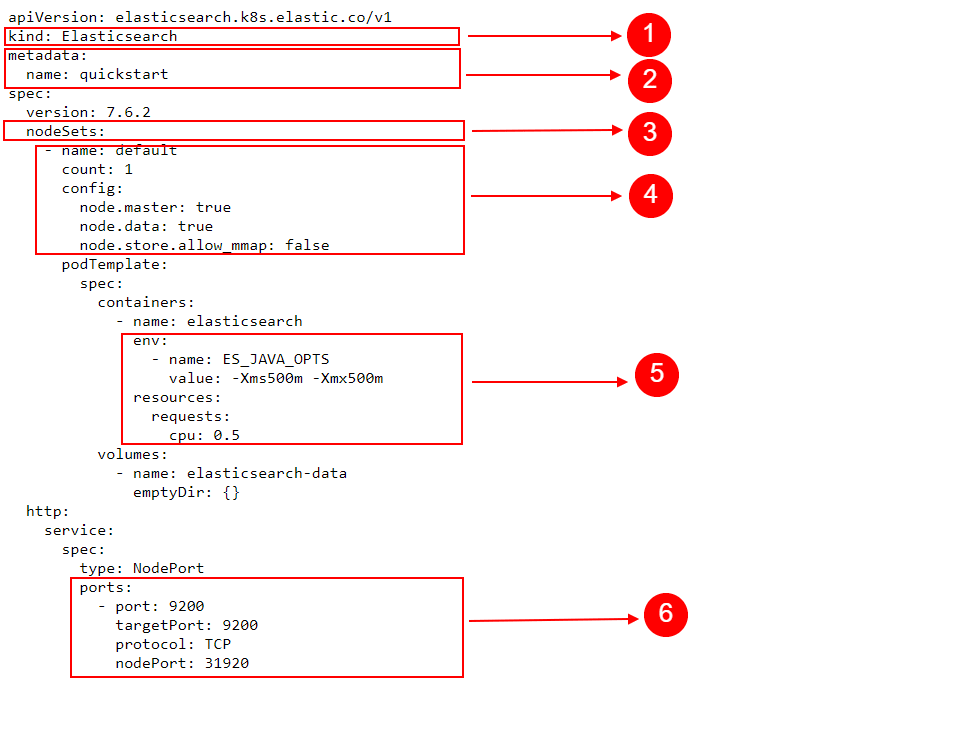
- kind here means the type of object that we’re describing and intend to create
- Under metadata, the name, a value of our choosing, helps us identify the resources that’ll be created
- Under nodeSets, we define things like:
- The name for this set of nodes.
- In count, we choose the number of Elasticsearch nodes we want to create.
- Finally, under config, we define how the nodes should be configured. In our case, we’re choosing a single Elasticsearch instance that should be both a Master Node and a Data Node. We’re also using the config option “node.store.allow_mmap: false“, to quickly get started. Note, however, that in a production environment, this section should be carefully configured. For example, in the case of the allow_mmap config setting, users should read Elasticsearch’s documentation about virtual memory before deciding on a specific value.
- Under podTemplate we have spec (or specifications) for containers.
- Under env we’re passing some environment variables. These ultimately reach the containers in which our applications will run and some programs can pick up on those variables to change their behavior in some way. The Java Virtual Machine, running in the container and hosting our Elasticsearch application, will notice our variable and change the way it uses memory by default.
- Also, notice that under resources we define requests with a cpu value of “0.5“. This decreases the CPU priority of this pod.
- Under http, we define a service, of the type: NodePort. This creates a service that will be accessible even from outside of Kubernetes’ internal network. In this lesson, we will analyze why this option is important and when we’d want to use it.
Under the ports section we find:
- Port tells the service on which port to accept connections. Only apps running inside the Kubernetes cluster can connect to this, so no external connections allowed. For external connections, nodePort will be used.
- targetPort makes the requests received by the Kubernetes service on the previously defined port to be redirected to this targetPort in one of the Pods. Of course, the application running in that Pod/Container will also need to listen on this port, to be able to receive the requests. For example, a program makes a request on port 12345, the service will redirect the request to a pod, on targetPort 54321.
- Kubernetes runs on Nodes, that is physical or virtual machines. Each physical or virtual machine can have its own IP address, on which other computers can communicate with it. This is called the Node’s IP address or external IP address. nodePort opens up a port, on every node in your cluster, that can be accessed by computers that are outside of Kubernetes’ internal network. For example, if one node would be using a publicly accessible IP address, we could connect to that IP and the specified nodePort and Kubernetes would accept the connection and redirect it to the targetPort to one of the Pods.
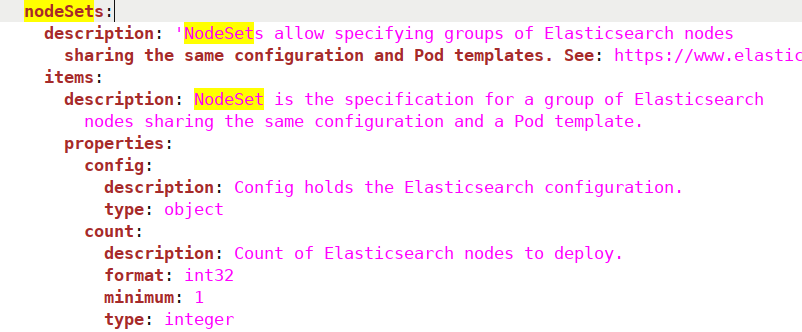
As mentioned earlier, we can find a lot of the Elasticsearch-specific objects defined in the “all-in-one.yaml” file we used to import Custom Resource Definitions. For example, if we would open the file and search for “nodeSets“, we would see the following:
With that out of the way, let’s finally pass this desired state to Kubernetes:
kubectl apply -f https://raw.githubusercontent.com/coralogix-resources/elastic-cloud-on-kubernetes-webinar/master/01_single-node-elasticsearch.yaml
This will take a while, but we can verify progress by looking at the resources available. Initially, the status for our Pod will display “Init:0/1”.
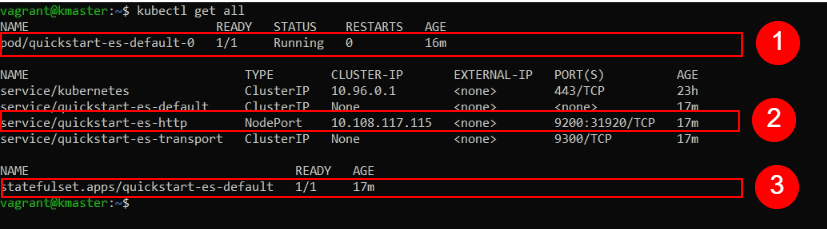
kubectl get all
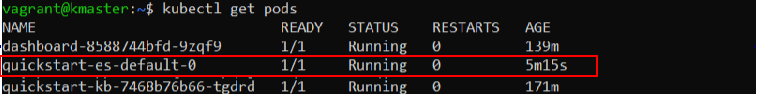
When the Pod containing our Elasticsearch node is finally created, we should notice in the output of this command that “pod/quickstart-es-default-0” has availability of “1/1” under READY and a STATUS of “Running“.
Link to image file
Now we’re set to continue.
Retrieving a Password from Kubernetes Secrets
First, we’ll need to authenticate our cURL requests to Elasticsearch with a username and password. Storing this password in the Pods, Containers, or other parts of the filesystem would not be secure, as, potentially, anyone and anything could freely read them.
Kubernetes has a special location where it can store sensitive data such as passwords, keys or tokens, called Secrets.
To list all secrets protected by Kubernetes, we use the following command:
kubectl get secrets
In our case, the output should look something like this:
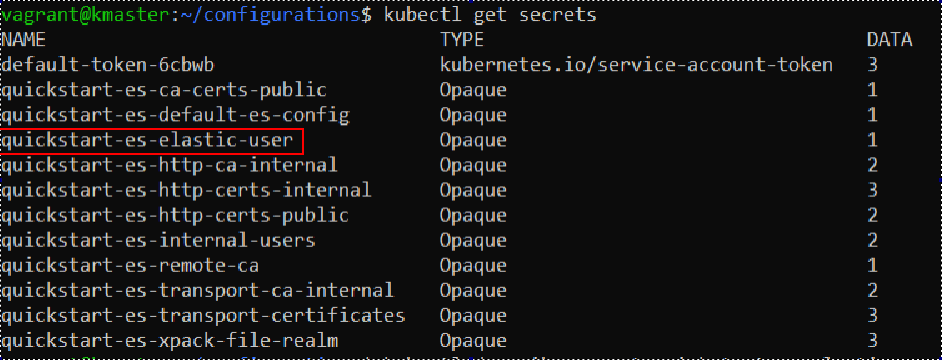
We will need the “quickstart-es-elastic-user” secret. With the following command we can examine information about the secret:
kubectl describe secret quickstart-es-elastic-user
We’ll get the following output:
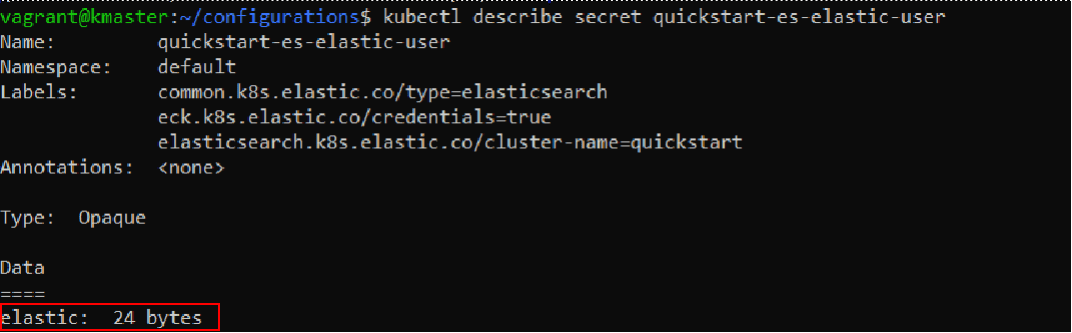
Let’s extract the password stored here and save it to a variable called “PASSWORD”.
PASSWORD=$(kubectl get secret quickstart-es-elastic-user -o go-template='{{.data.elastic | base64decode}}')
To display the password, we can type:
echo $PASSWORD
Making the Elasticsearch Node Publicly Accessible
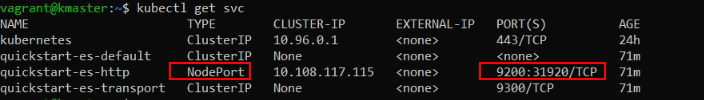
Let’s list the currently available Kubernetes services:
kubectl get svc
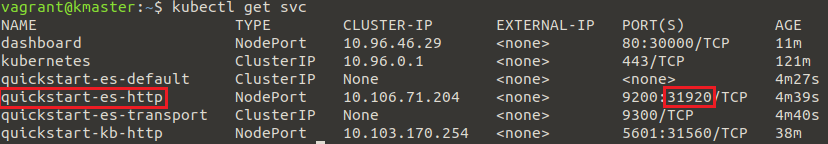
Here’s an example output we will analyze:
A lot of IP addresses we’ll see in Kubernetes are so-called internal IP addresses. This means that they can only be accessed from within the same network. In our case, this would imply that we can connect to certain things only from our Master Node or the other two Worker Nodes, but not from other computers outside this Kubernetes cluster.
When we will run a Kubernetes cluster on physical servers or virtual private servers, these will all have external IP addresses that can be accessed by any device connected to the Internet. By using the previously discussed NodePort service, we open up a certain port on all Nodes. This way, any computer connected to the Internet can get access to services offered by our pods, by sending requests to the external IP address of a Kubernetes node and the specified NodePort number.
Alternatively, instead of NodePort, we can also use a LoadBalancer type of service to make something externally available.
In our case, we can see that all incoming requests, on the external IP of the Node, to port 31920/TCP will be routed to port 9200 on the Pods.
We extracted the necessary password earlier, so now we can fire a cURL request to our Elasticsearch node:
curl -u elastic:$PASSWORD -k https://localhost:31920
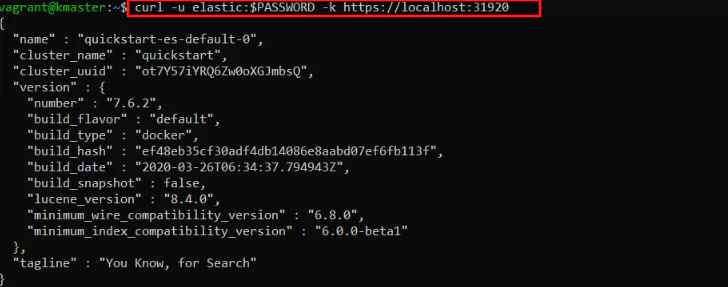
Since we made this request from the “kmaster” Node, it still goes through Kubernetes’ internal network.
So to see if our service is indeed available from outside this network, we can do the following.
First, we need to find out the external IP address for the Node we’ll use. We can list all external IPs of all Nodes with this command:
kubectl get nodes --selector=kubernetes.io/role!=master -o jsonpath={.items[*].status.addresses[?(@.type=="InternalIP")].address} ; echo
Alternatively, we can use another method:
ip addr
And look for the IP address displayed under “eth1”, like in the following:
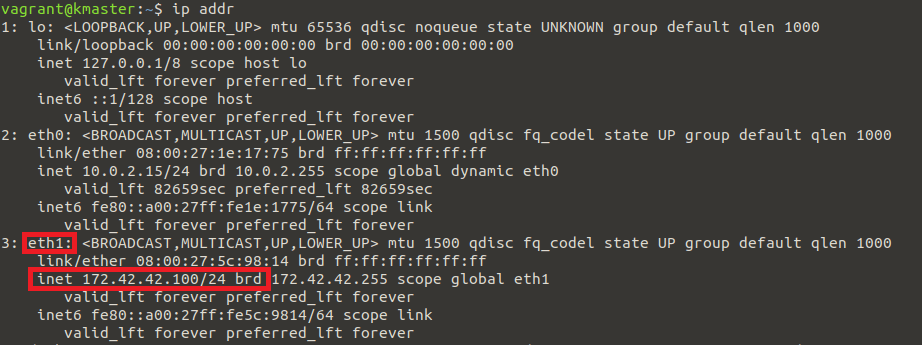
However, this method requires closer attention, as the external IP may become associated with a different adapter name in the future. For example, the identifier might start with the string “enp”.
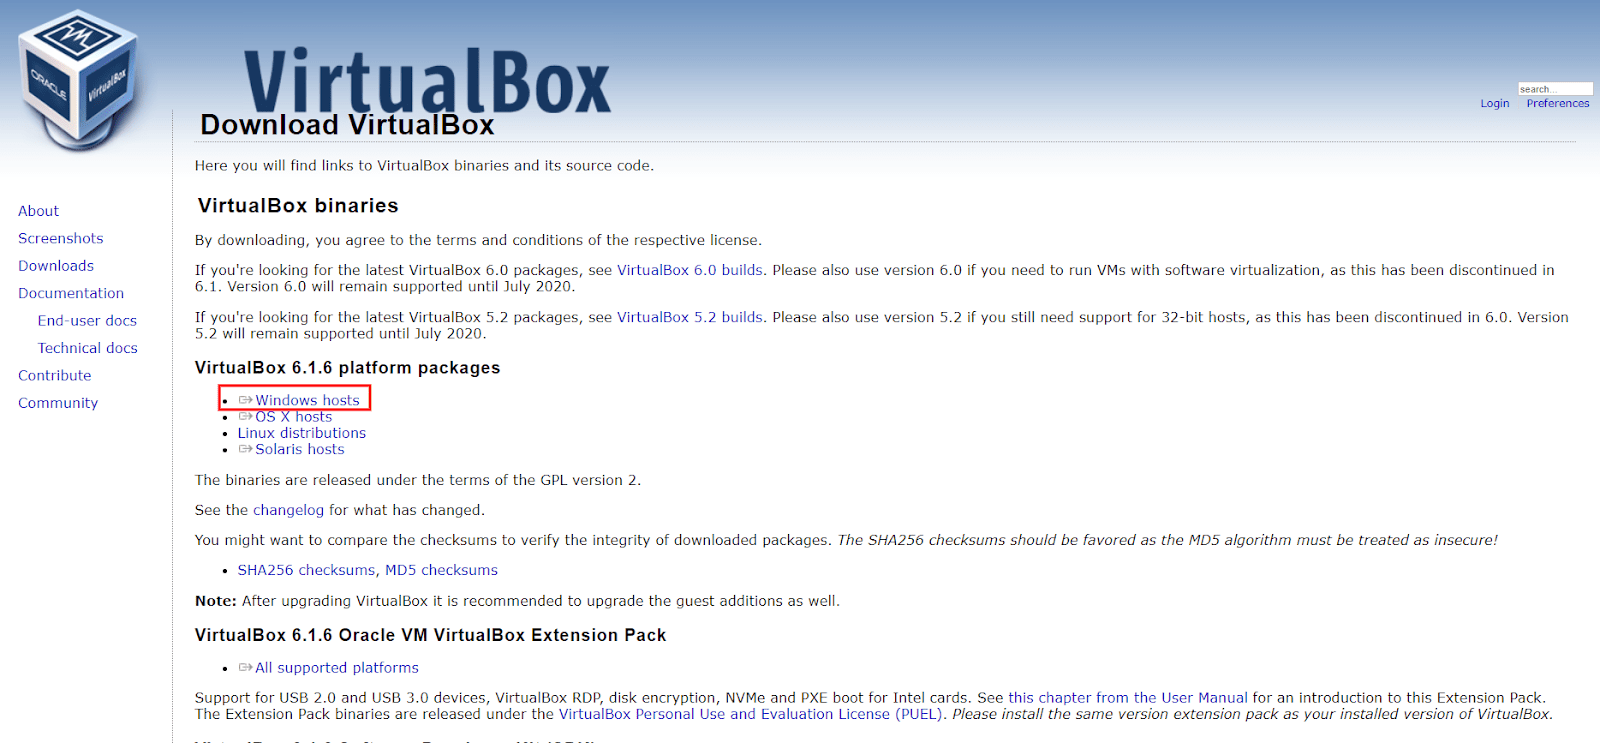
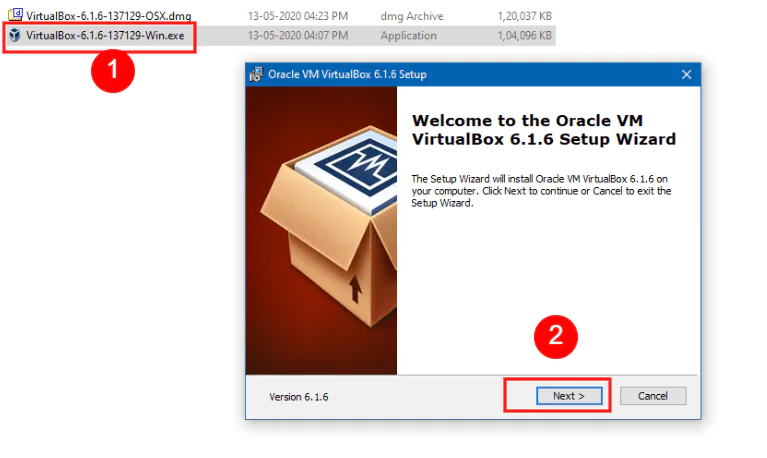
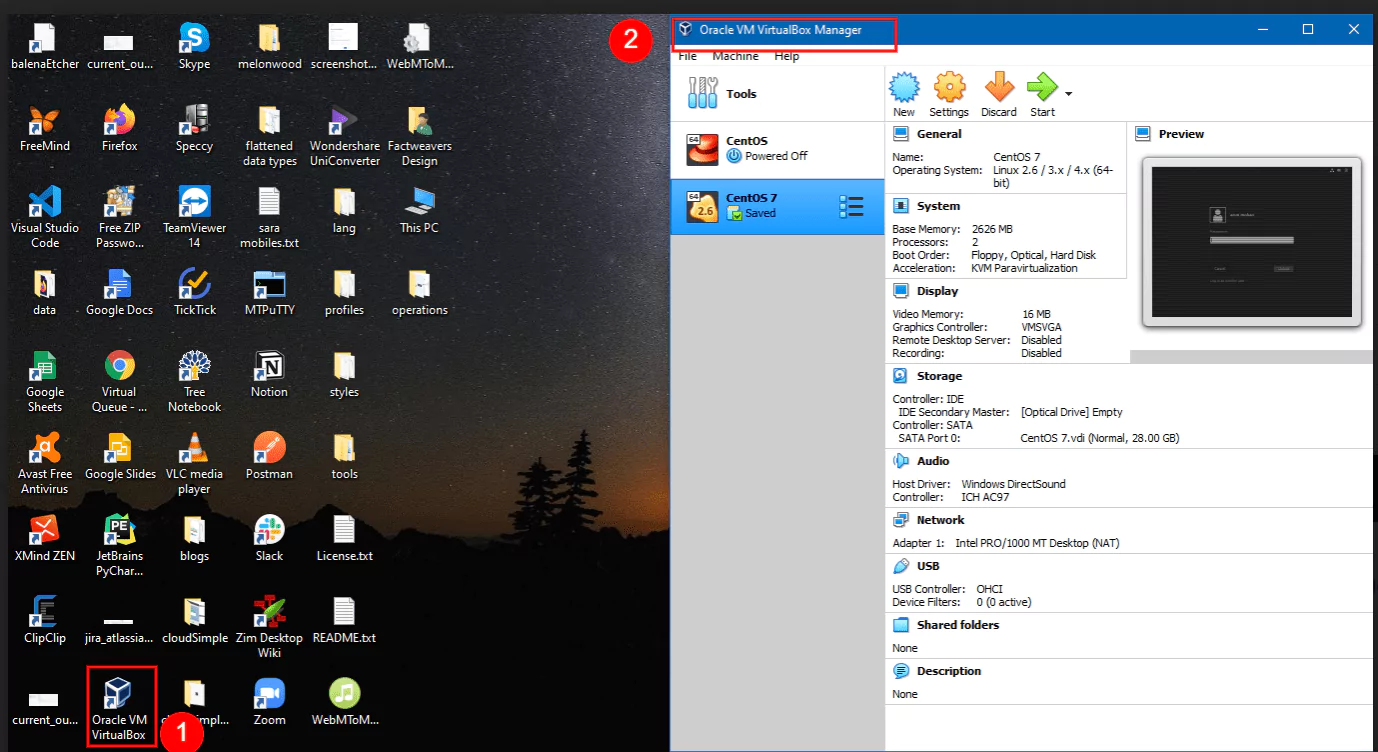
In our case, the IP we extracted here belongs to the VirtualBox machine that is running this specific Node. If the Kubernetes Node would run on a server instead, it would be the publicly accessible IP address of that server.
Now, let’s assume for a moment that the external IP of our node is 172.42.42.100. If you want to run this exercise, you’ll need to replace this with the actual IP of your own Node, in case it differs.
You will also need to replace the password, with the one that was generated in your case.
Let’s display the password again:
echo $PASSWORD
Select and copy the output you get since we’ll need to paste it in another window.
In our example, the output is 3sun1I8PB41X2C8z91Xe7DGy, but you shouldn’t use this. We brought attention to this value just so you can see where your password should be placed in the next command.
Next, minimize your current SSH session or terminal window, don’t close it, as you’ll soon return to that session.
Windows: If you’re running Windows, open up a Command Prompt and execute the next command.
Linux/Mac: On Linux or Mac, you would need to open up a new terminal window instead.
Windows 10 and some versions of Linux have the cURL utility installed by default. If it’s not available out of the box for you, you will have to install it before running the next command.
Remember to replace highlighted values with what applies to your situation:
curl -u "elastic:3sun1I8PB41X2C8z91Xe7DGy" -k "https://172.42.42.100:31920"
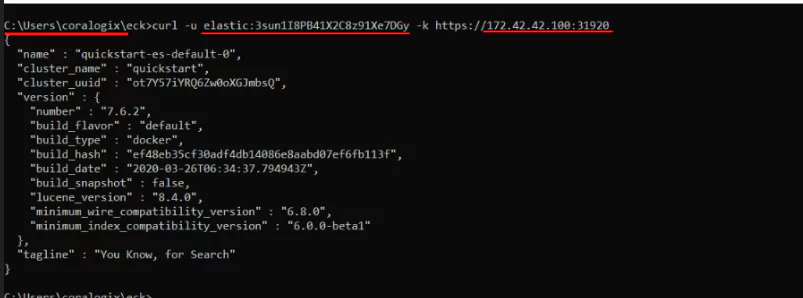
And there it is, you just accessed your Elasticsearch Node that’s running in a Kubernetes Pod by sending a request to the Kubernetes Node’s external IP address.
Now let’s close the Command Prompt or the Terminal for Mac users and return to the previously minimized SSH session, where we’re logged in to the kmaster Node.
Setting Up Kibana
Creating the Kibana Pod
As we did with our Elasticsearch node, we’ll declare to Kubernetes what state we want to achieve, and it will take the necessary steps to bring up and maintain a Kibana instance.
Let’s look at a few key points in the YAML file that we’ll pass to the kubectl command:
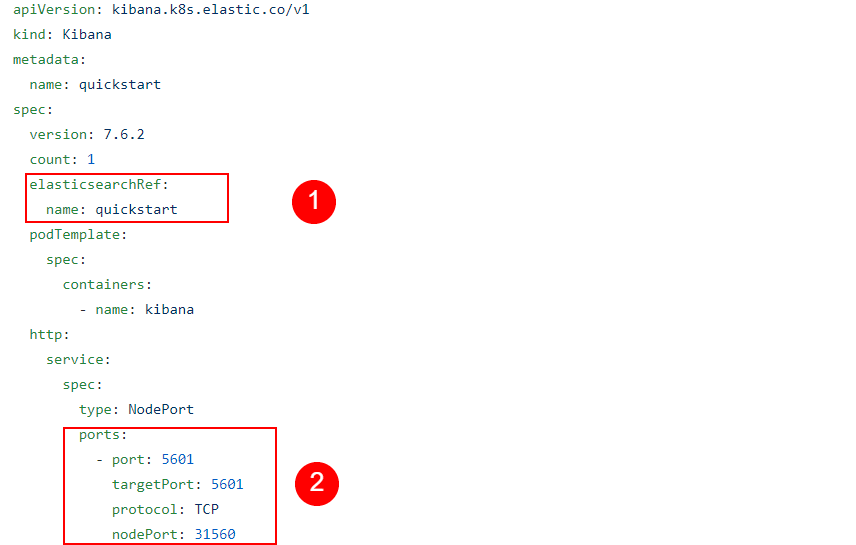
- The elasticsearchRef entry is important, as it points Kibana to the Elasticsearch cluster it should connect to.
- In the service and ports sections, we can see it’s similar to what we had with the Elasticsearch Node, making it available through a NodePort service on an external IP address.
Now let’s apply these specifications from our YAML file:
kubectl apply -f https://raw.githubusercontent.com/coralogix-resources/elastic-cloud-on-kubernetes-webinar/master/02_kibana.yaml
It will take a while for Kubernetes to create the necessary structures. We can check its progress with:
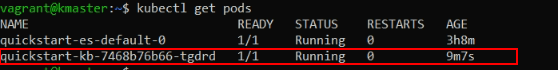
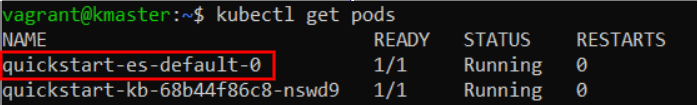
kubectl get pods
The name of the Kibana pod will start with the string “quickstart-kb-“. If we don’t see “1/1” under READY and a STATUS of Running, for this pod, we should wait a little more and repeat the command until we notice that it’s ready.
Accessing the Kibana Web User Interface
Let’s list the services again to extract the port number where we can access Kibana.
kubectl get svc
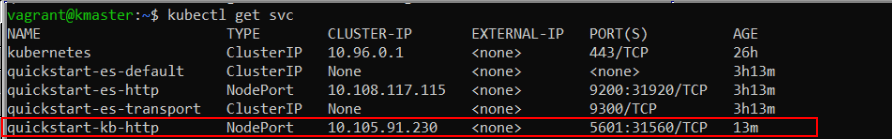
We can see the externally accessible port is 31560. We also need the IP address of a Kubernetes Node.
The procedure is the same as the one we followed before and the external IPs should also be the same:
kubectl get nodes --selector=kubernetes.io/role!=master -o jsonpath={.items[*].status.addresses[?(@.type=="InternalIP")].address} ; echo
Finally, we can now open up a web browser, where, in the URL address bar we type “https://” followed by the IP address and the port number. The IP and port should be separated by a colon (:) sign.
Here’s an example of how this could look like:
https://172.42.42.100:31560
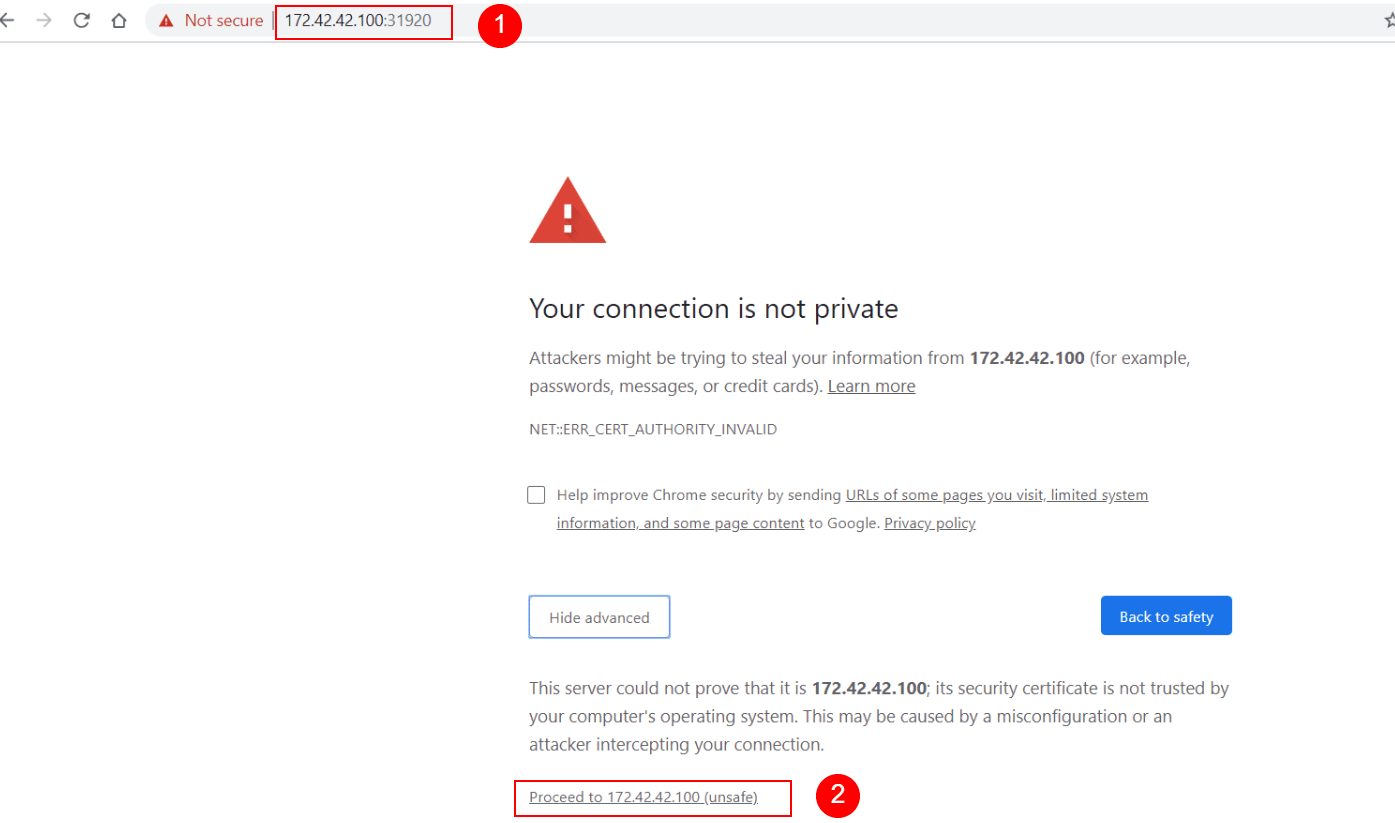
Since Kibana currently uses a self-signed SSL/TLS security certificate, not validated by a certificate authority, the browser will automatically refuse to open the web page.
To continue, we need to follow the steps specific to each browser. For example, in Chrome, we would click on “Advanced” and then at the bottom of the page, click on “Proceed to 172.42.42.100 (unsafe)“.
On production systems, you should use valid SSL/TLS certificates, signed by a proper certificate authority. The Elasticsearch documentation has instructions about how we can import our own certificates when we need to.
Finally, the Kibana dashboard appears:
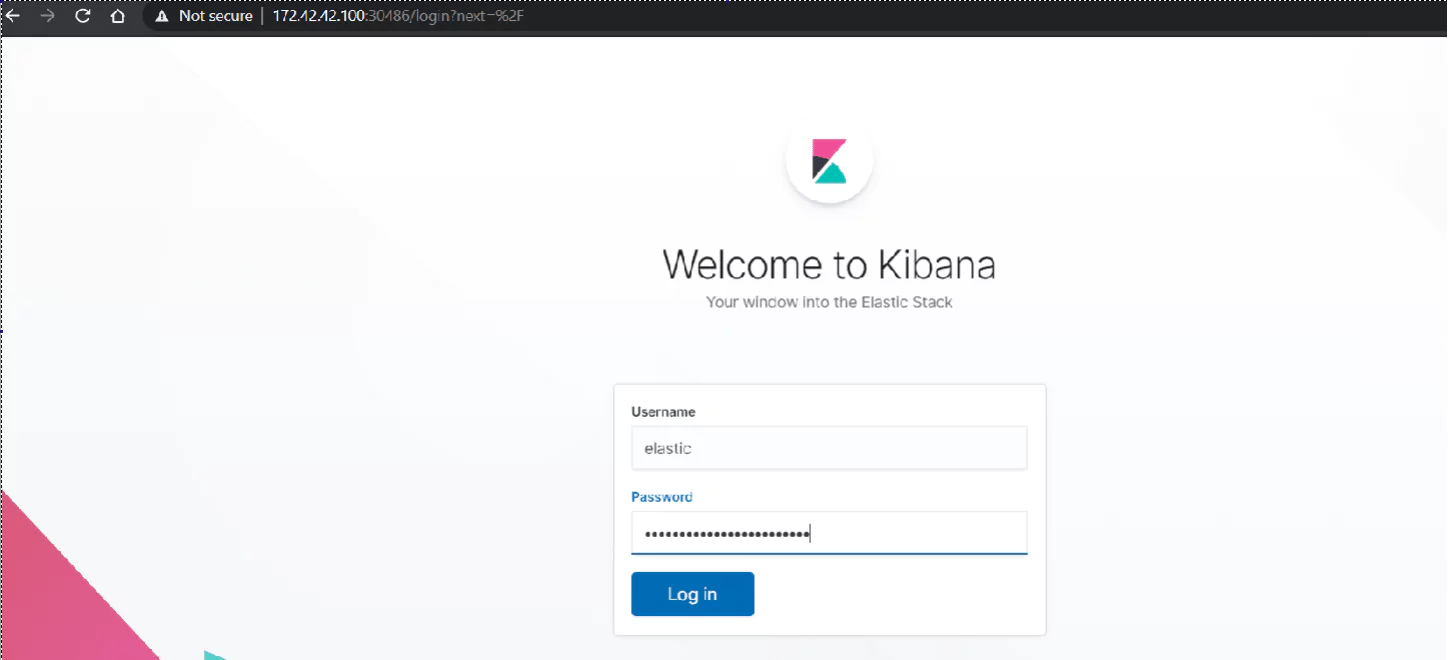
Under username, we enter “elastic” and the password is the same one we retrieved in the $PASSWORD variable. If we need to display it again, we can go back to our SSH session on the kmaster Node and enter the command:
echo $PASSWORD
Inspecting Pod Logs
Now let’s list our Pods again:
kubectl get pods
By copying and pasting the pod name to the next command, we can look at the logs Kubernetes keeps for this resource. We also use the “-f” switch here to “follow” our log, that is, watch it as it’s generated.
kubectl logs quickstart-es-default-0 -f
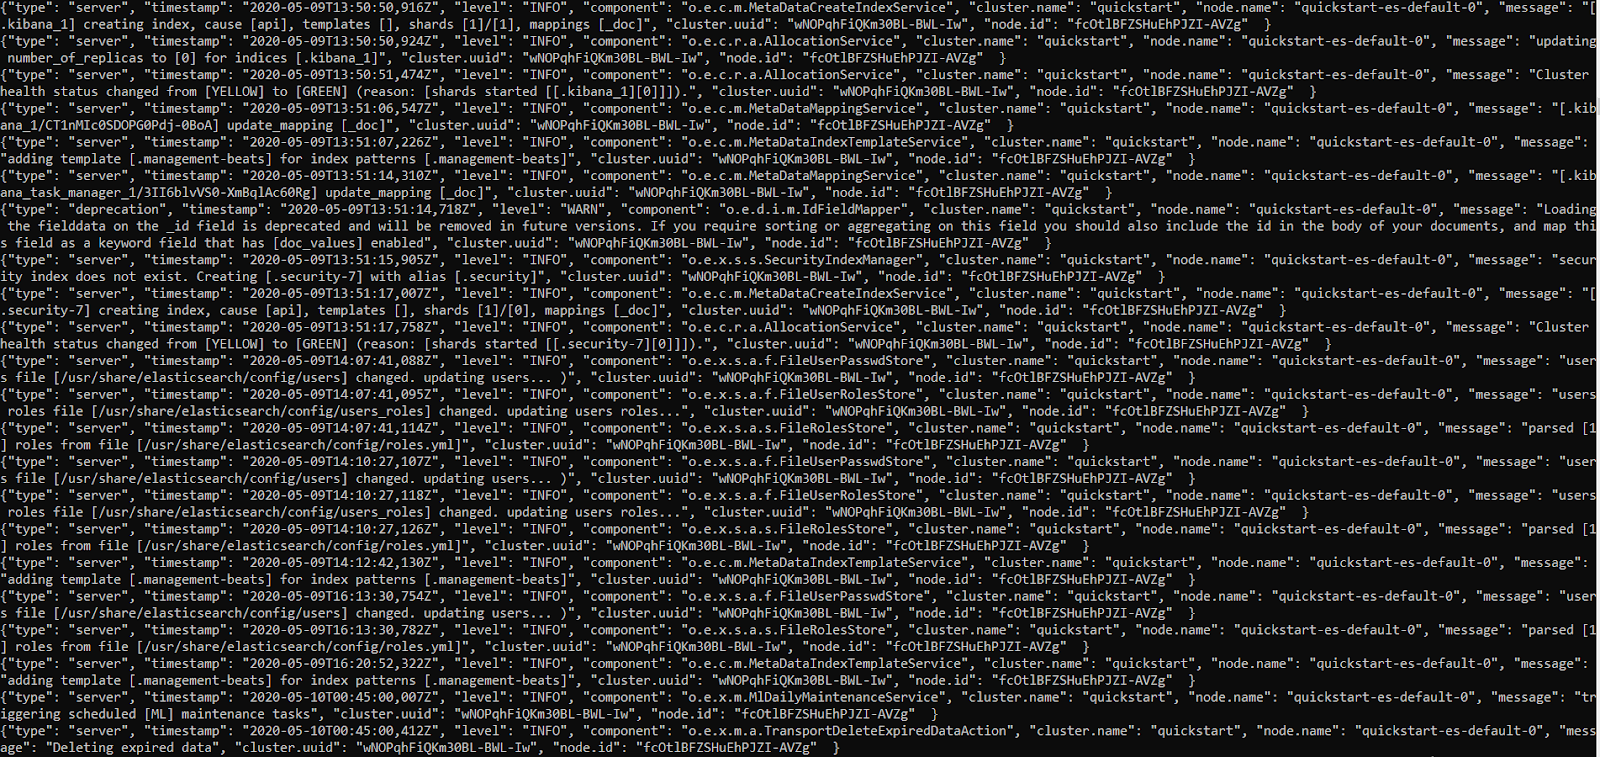
Whenever we open logs in this “follow” mode, we’ll need to press CTRL+C when we want to exit.
Installing The Kubernetes Dashboard
So far, we’ve relied on the command line to analyze and control various things in our Kubernetes infrastructure. But just like Kibana can make some things easier to visualize and analyze, so can the Kubernetes Web User Interface.
Important Note: Please note that the YAML file used here is meant just as an ad-hoc, simple solution to quickly add Kubernetes Web UI to the cluster. Otherwise said, we used a modified config that gives you instant results, so you can experiment freely and effortlessly. But while this is good for testing purposes, it is NOT SAFE for a production system as it will make the Web UI publicly accessible and won’t enforce proper login security. If you intend to ever add this to a production system, follow the steps in the official Kubernetes Web UI documentation.
Let’s pass the next YAML file to Kubernetes, which will do the heavy lifting to create and configure all of the components necessary to create a Kubernetes Dashboard:
kubectl apply -f https://raw.githubusercontent.com/coralogix-resources/elastic-cloud-on-kubernetes-webinar/master/03_k8s_dashboard-not-safe-for-production.yaml
As usual, we can check with the next command if the job is done:
kubectl get pods
Once the Dashboard Pod is running, let’s list the Services, to find the port we need to use to connect to it:
kubectl get svc
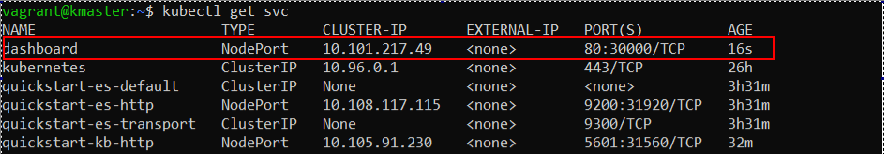
In our example output, we see that Dashboard is made available at port 30000.
Just like in the previous sections, we use the Kubernetes Node’s external IP address, and port, to connect to the Service. Open up a browser and type the following in the address bar, replacing the IP address and port, if necessary, with your actual values:
https://172.42.42.100:30000
The following will appear:
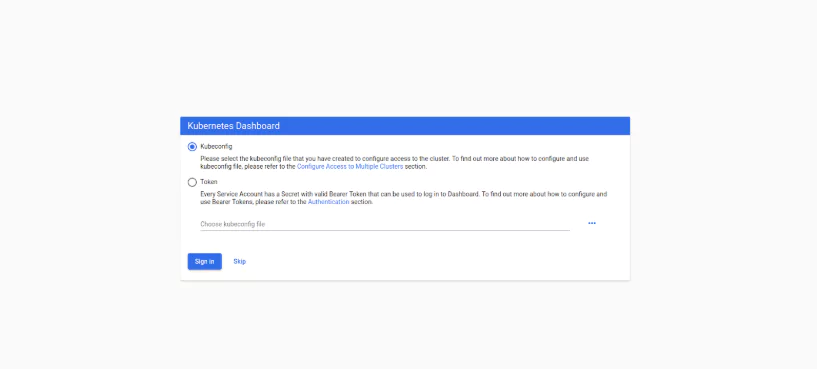
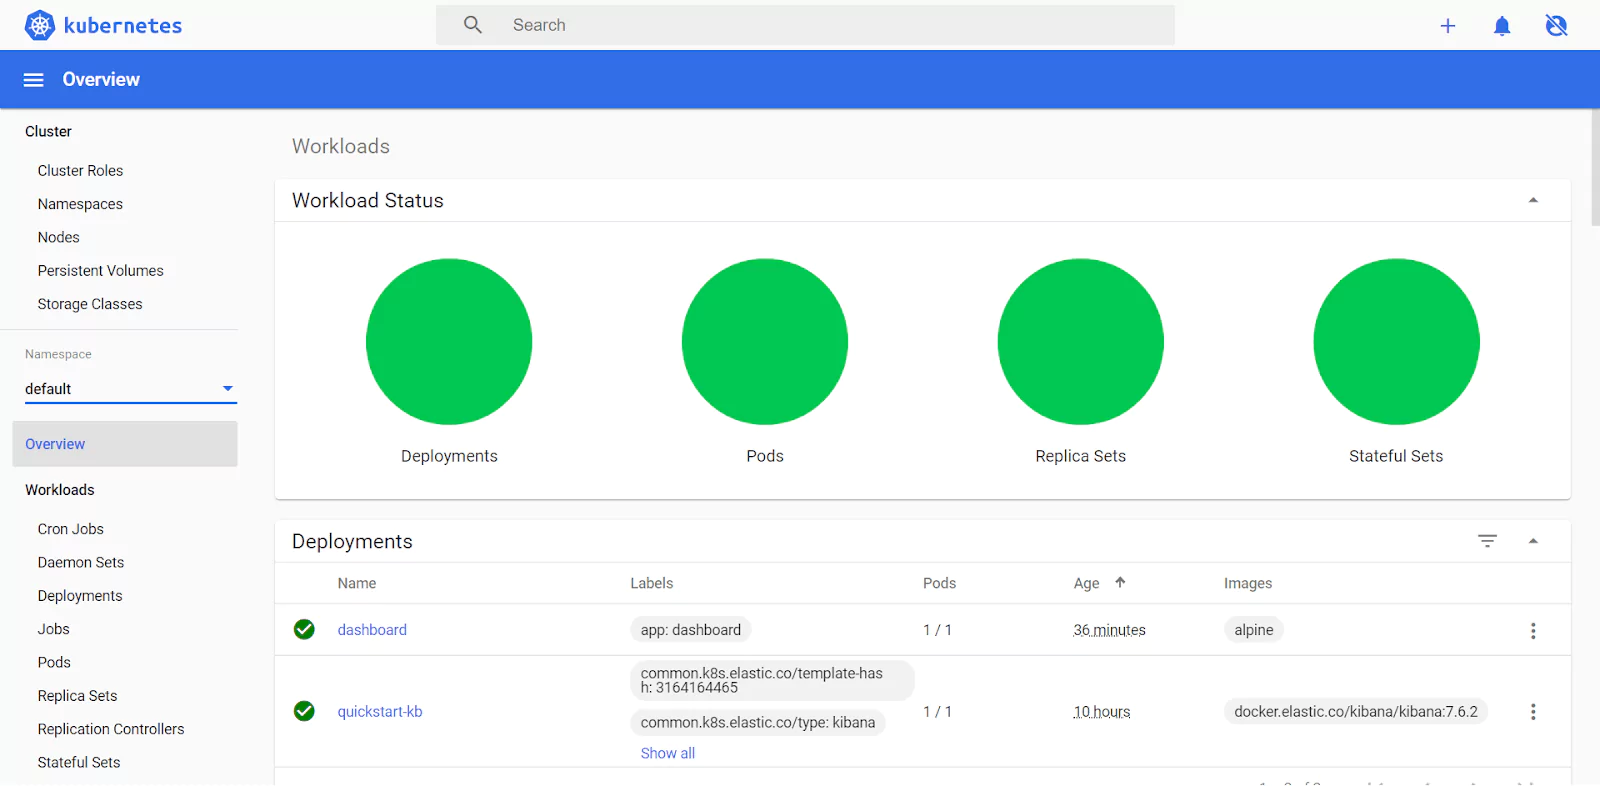
Since we’re just testing functionality here, we don’t need to configure anything and we can just click “Skip” and then we’ll be greeted with the Overview page in the Kubernetes Web UI.
Installing Plugins to an Elasticsearch Node Managed by Kubernetes
We might encounter a need for plugins to expand Elasticsearch’s basic functionality. Here, we will assume we need the S3 plugin to access Amazon’s object storage service.
The process we’ll go through looks like this:
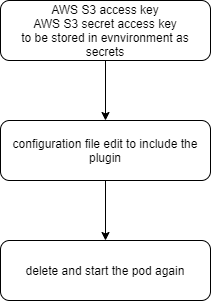
Storing S3 Authentication Keys as Kubernetes Secrets
We previously explored how to extract values from Kubernetes’ secure Secret vault. Now we’ll learn how to add sensitive data here.
To make sure that only authorized parties can access them, S3 buckets will ask for two keys. We will use the following fictional values.
AWS_ACCESS_KEY=123456
AWS_SECRET_ACCESS_KEY=123456789
If, in the future, you want to adapt this exercise for a real-world scenario, you would just copy the key values from your Amazon Dashboard and paste them in the next two commands.
To add these keys, with their associated values, to Kubernetes Secrets, we would enter the following commands:
kubectl create secret generic awsaccesskey --from-literal=AWS_ACCESS_KEY_ID=123456
and:
kubectl create secret generic awssecretkey --from-literal=AWS_SECRET_ACCESS_KEY=123456789
Each command will output a message, informing the user that the secret has been created.

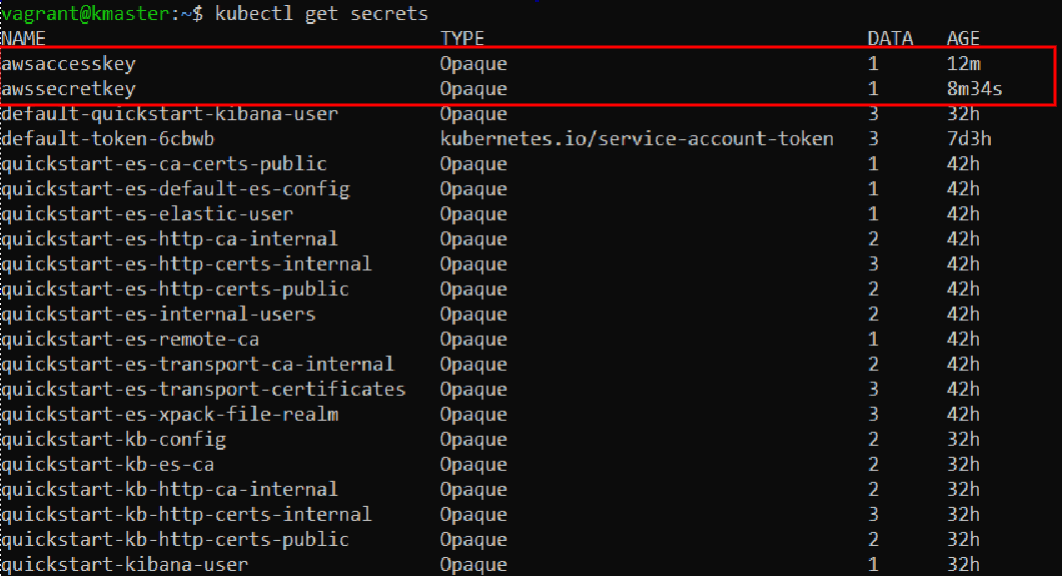
Let’s list the secrets we have available now:
kubectl get secrets
Notice our newly added entries:
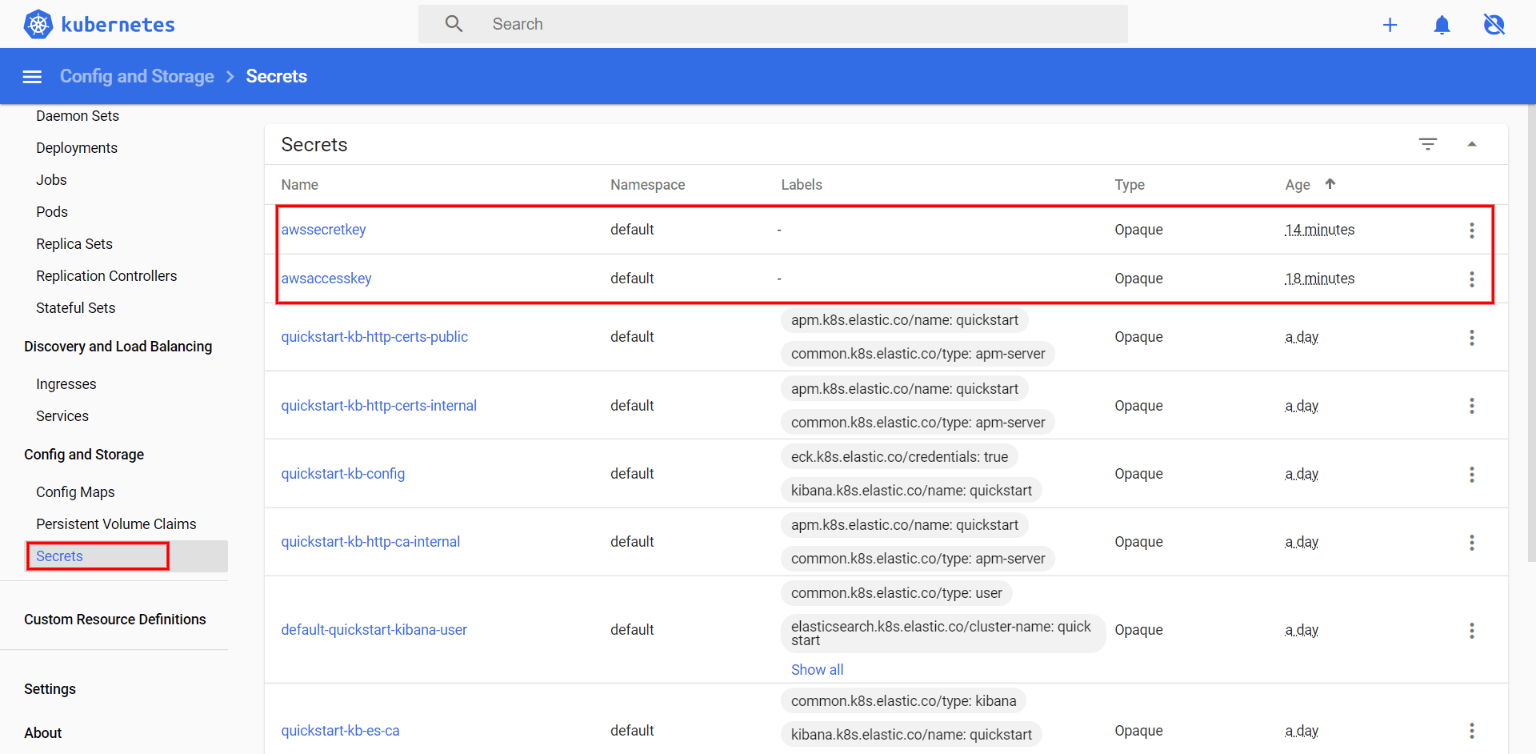
We can also visualize these in the Kubernetes Dashboard:
Installing the Elasticsearch S3 Plugin
When we created our Elasticsearch node, we described the desired state in a YAML file and passed it to Kubernetes through a kubectl command. To install the plugin, we simply describe a new, changed state, in another YAML file, and pass it once again to Kubernetes.
The modifications to our original YAML config are highlighted here:
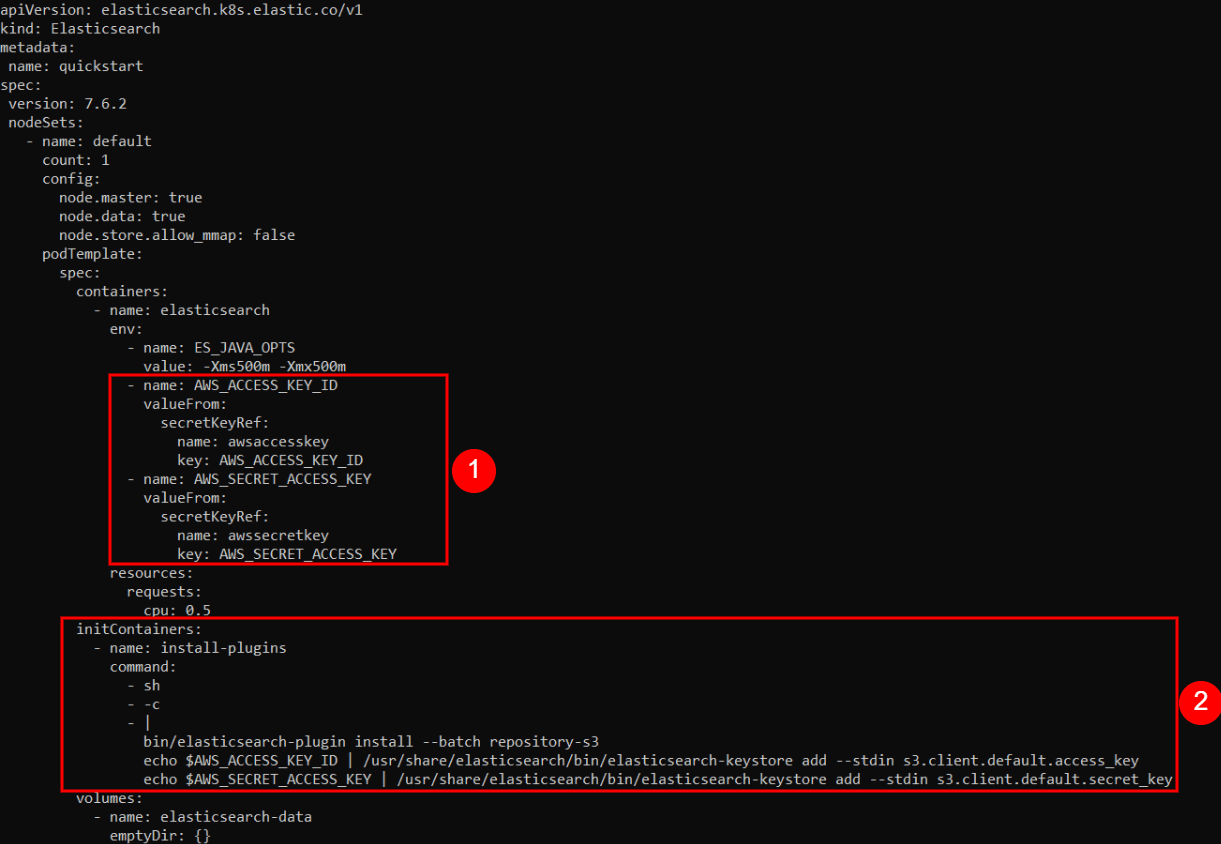
The first group of changes we added are as follows:
                - name: AWS_ACCESS_KEY_ID
                  valueFrom:
                    secretKeyRef:
                      name: awsaccesskey
                      key: AWS_ACCESS_KEY_ID
                - name: AWS_SECRET_ACCESS_KEY
                  valueFrom:
                    secretKeyRef:
                      name: awssecretkey
                      key: AWS_SECRET_ACCESS_KEY
Here, we create environment variables named AWS_ACCESS_KEY_ID and AWS_SECRET_ACCESS_KEY, inside the Container. We assign them the values of our secret keys, extracted from the Kubernetes Secrets vault.
In the second group of changes we added this:
          initContainers:
            - name: install-plugins
              command:
                - sh
                - -c
                - |
                  bin/elasticsearch-plugin install --batch repository-s3
                  echo $AWS_ACCESS_KEY_ID | /usr/share/elasticsearch/bin/elasticsearch-keystore add --stdin s3.client.default.access_key
                  echo $AWS_SECRET_ACCESS_KEY | /usr/share/elasticsearch/bin/elasticsearch-keystore add --stdin s3.client.default.secret_key
Here, we simply instruct Kubernetes to execute certain commands when it initializes the Containers. The commands will first install the S3 plugin and then configure it with the proper secret key values, passed along through the $AWS_ACCESS_KEY_ID and $AWS_SECRET_ACCESS_KEY environment variables.
To get started, let’s first delete the Elasticsearch node from our Kubernetes cluster, by removing its associated YAML specification:
kubectl delete -f https://raw.githubusercontent.com/coralogix-resources/elastic-cloud-on-kubernetes-webinar/master/01_single-node-elasticsearch.yaml
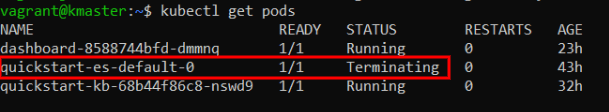
If we now check the status of the Pods, with:
kubectl get pods
We can see that the Elasticsearch Pod has a STATUS of “Terminating“.
Finally, let’s apply our latest desired state for our Elasticsearch Node, with the S3 plugin installed:
kubectl apply -f https://raw.githubusercontent.com/coralogix-resources/elastic-cloud-on-kubernetes-webinar/master/04_single_node_es_plugin_install.yaml
After a while, we can check the status of the Pods again to see if Kubernetes finished setting up the new configuration:
kubectl get pods
As usual, a STATUS of “Running” means the job is complete:
Verifying Plugin Installation
Since we’ve created a new Elasticsearch container, this will use a newly generated password to authenticate cURL requests. Let’s retrieve it, once again, and store it in the PASSWORD variable:
PASSWORD=$(kubectl get secret quickstart-es-elastic-user -o go-template='{{.data.elastic | base64decode}}')
It’s useful to list the Services again, to check which port we’ll need to use in order to send cURL requests to the Elasticsearch Node:
kubectl get svc
Take note of the port displayed for “quickstart-es-http” since we’ll use it in the next command:
Finally, we can send a cURL request to Elasticsearch to display the plugins it is using:
curl -XGET -u elastic:$PASSWORD -k https://localhost:31920/_cat/plugins
Now the output will show that the repository-s3 plugin is active.
In the third and final post of this series (coming next week), we’ll:
- Use persistent volumes for storage
- Setup a multi-node cluster deployment
- Setup a Hot-warm architecture
- Learn about upgrade management