Tutorial: Logstash Grok Patterns with Examples

Logstash can parse CSV and JSON files easily because data in those formats are perfectly organized and ready for Elasticsearch analysis. Sometimes, though, we need to work with unstructured data, like plain-text logs. In these cases, we’ll need to parse the data to turn it into structured data using Logstash Grok or another 3rd party service like Coralogix. This tutorial will help you use Elasticsearch’s analysis and querying capabilities by parsing with Logstash Grok.

So, let’s dive in and learn how to deal with unstructured data using the Logstash Grok filter.

Why Choose Grok?

Logstash Grok isn’t the only option available to parse unstructured logs. Plenty of other plugins, such as Dissect, third-party log management tools, or just plain RegEx, could do the trick. We can even build our own custom parsing logic if we have super-specific needs.

Grok is a popular choice for a multitude of reasons, starting with how easy it is to use. Grok patterns are relatively easy to understand, especially if we are already familiar with regular expressions, and come with a wide range of built-in patterns for common log formats such as timestamps, IP addresses, and URLs. We can also create custom patterns to cater to our exact requirements. 

While there are standalone Grok parser libraries available for various programming languages, Logstash Grok is specifically designed for Logtsash and the tight integration means we can easily incorporate Grok patterns into our Logstash configurations. On top of that, the plugin has been available for years and has a large community of users who share new patterns and best practices online.

Dissect Vs Grok

People often ask if they should use Grok or Dissect to parse their logs in Logstash.

While Grok uses regular expressions to match patterns within log lines, Dissect operates by splitting log lines into key-value pairs based on predefined delimiters such as spaces, commas, or other characters. Dissect is often faster and more efficient than Grok if our log formats have well-defined structures and consistent delimiters. It also means that Dissect configurations are simpler and more concise than Grok patterns, especially for straightforward log formats. However, it is worth noting that Dissect is less flexible than Grok when dealing with more complex unstructured log data. We can decide to use one or the other, or both for a hybrid use case when a section of the line is reliably repeated, but the entire line is not.

Now that we have learned more about Grok and the alternatives let’s dive into Logstash Grok filters.

Theory

In a CSV file, each record has an identical list of fields. The sequence of these fields repeats predictably for any program to read in a structured way. Naturally, this is an ideal situation for Elasticsearch.

In other cases, information cannot be organized in this ideal way. Consider a typical Linux system log.

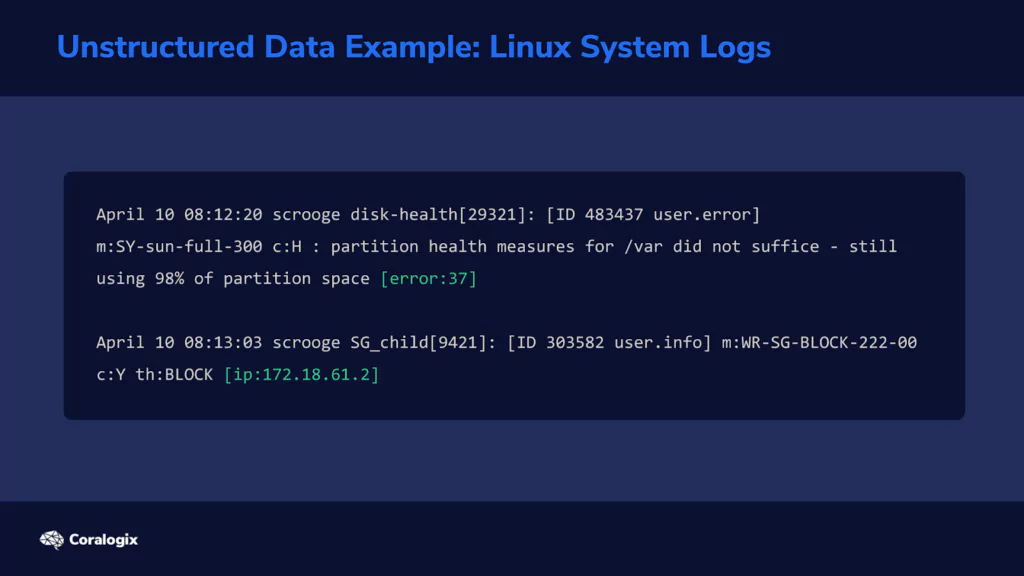
Multiple programs write their status or error messages to the same log file. On one line in the log, the last field might be an error code. But on the following line, the last field might be an IP address. This means that the parser now needs to have a way to “detect” what each field represents. Let’s look at how the Grok filter does this.

Understanding Grok Patterns and Syntax
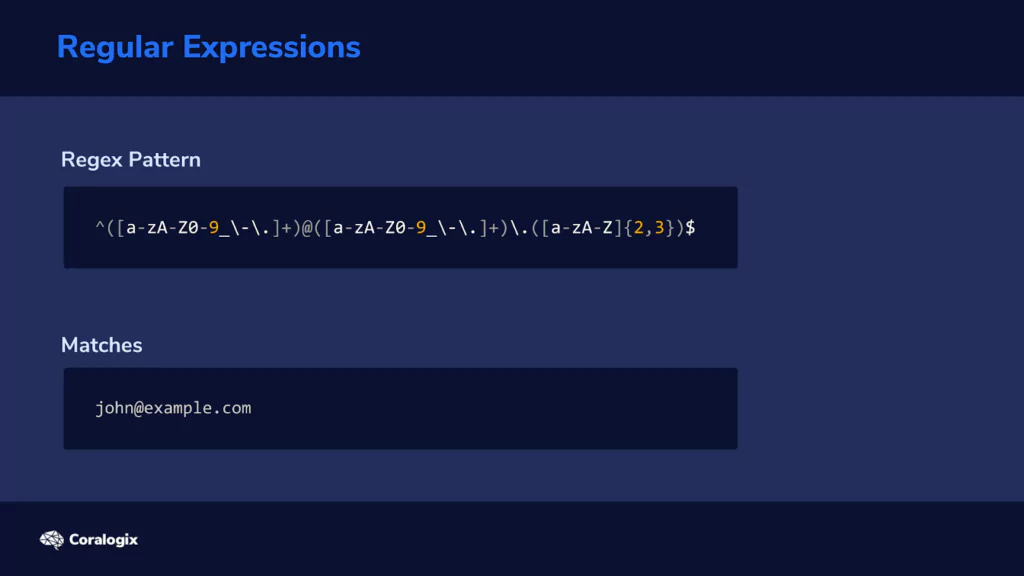
When we see something like “john@example.com,” we immediately think of “email address” because we have learned to recognize this pattern. Grok can do the same thing by analyzing each piece of text and checking if it matches the patterns you instruct it to look for.

Grok uses regular expressions, or RegEx for short, behind the scenes, which can look weird for someone unfamiliar. For example, here’s how a regular expression that matches an email looks like:

Fortunately, many common expressions are already predefined in Logstash’s Grok filter, and we can use their pattern names instead of writing those complicated strings of characters ourselves.

We can find a list of these predefined pattern names on the documentation page for the Grok filter plugin.

The generic Grok syntax looks like this:

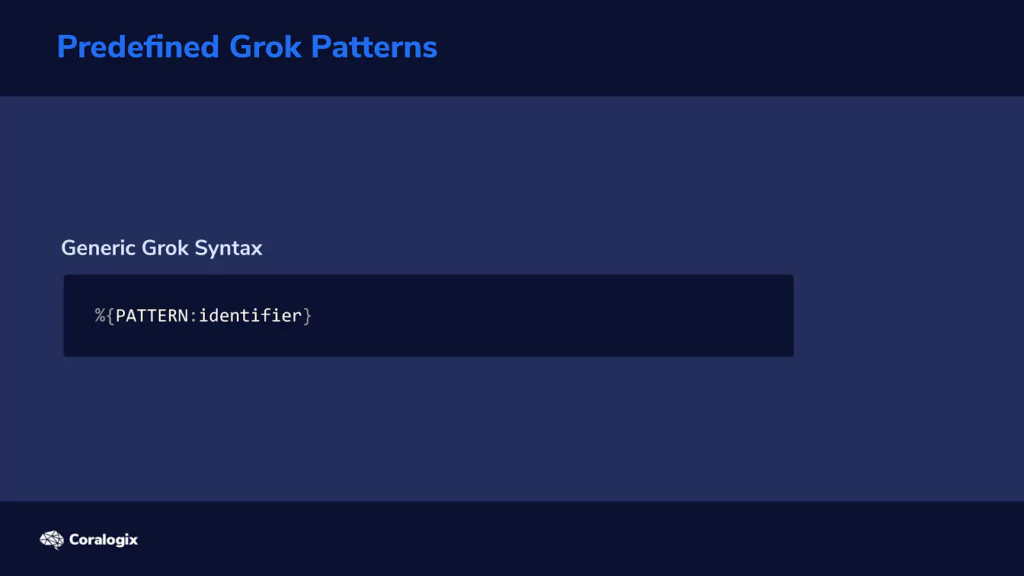
In a nutshell, we tell it what pattern to look for and how to label the strings that match those patterns.

Back to our earlier example, this is how to define and label email addresses:


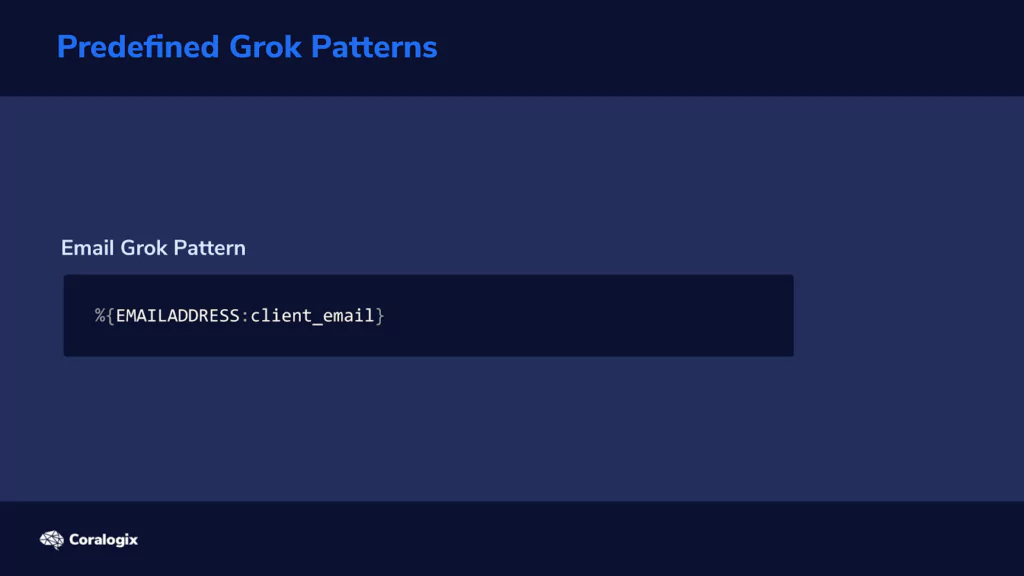
This Grok pattern will look for all email addresses and identify each as “client_email.” You’re free to choose whatever identifier name you want.

In our case, identifiers will be used as field names for matched values that will be imported to the index. We’ll see how this works in the hands-on exercises to follow.

Example Grok Filter

Let’s analyze how we would use Grok. Consider the following line in a log file:

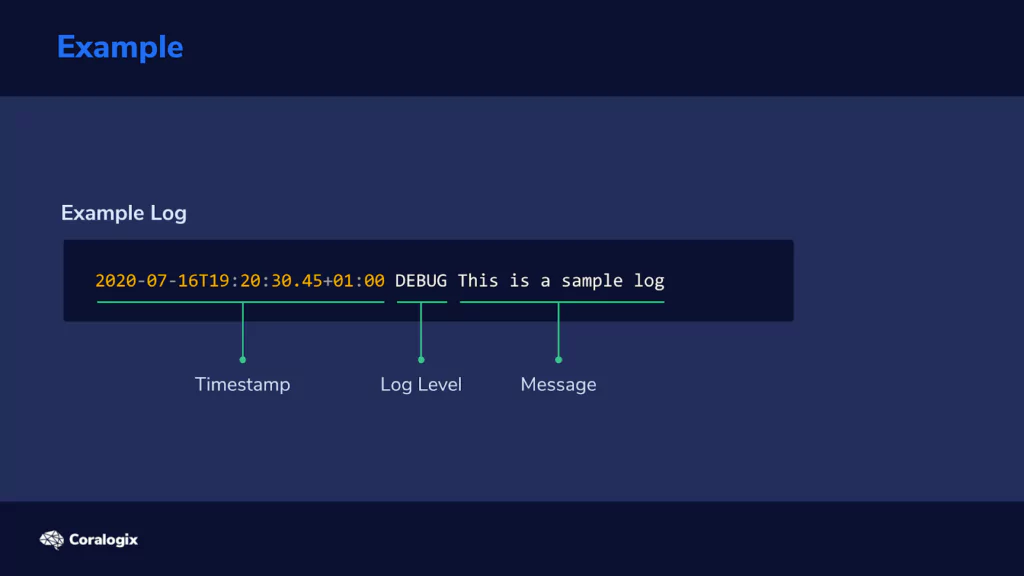
We can see three logical components here: a timestamp, the level of logging, and the error or status message.

The timestamp is in the so-called ISO format, which is useful since we have a Grok pattern that is already available.

How would we define a Grok filter that would extract the three components from this piece of log text? Well, here it is:

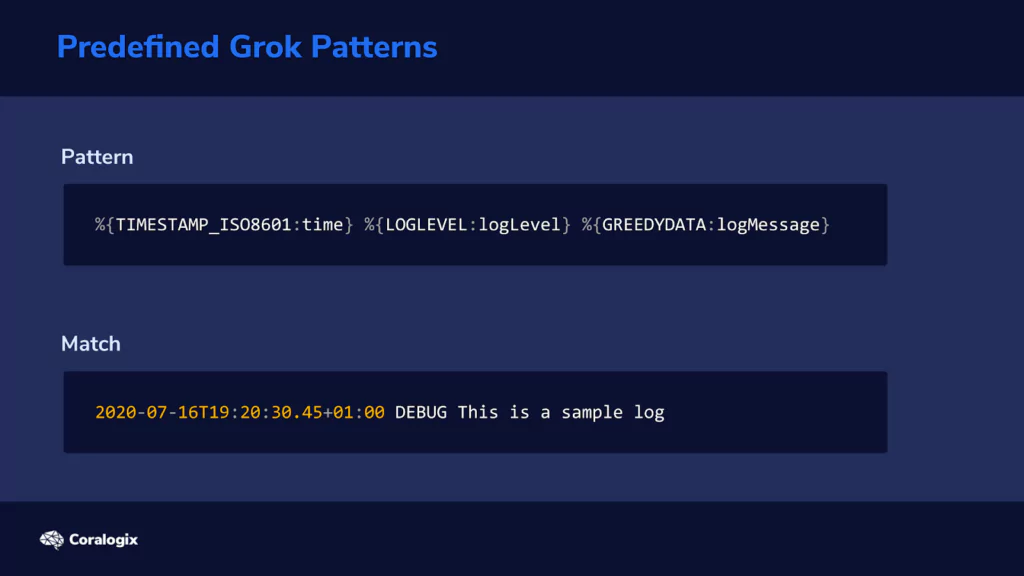
GREEDYDATA might sound mysterious, but all it does is match all other characters in the string analyzed, so it extracts the rest of the text.

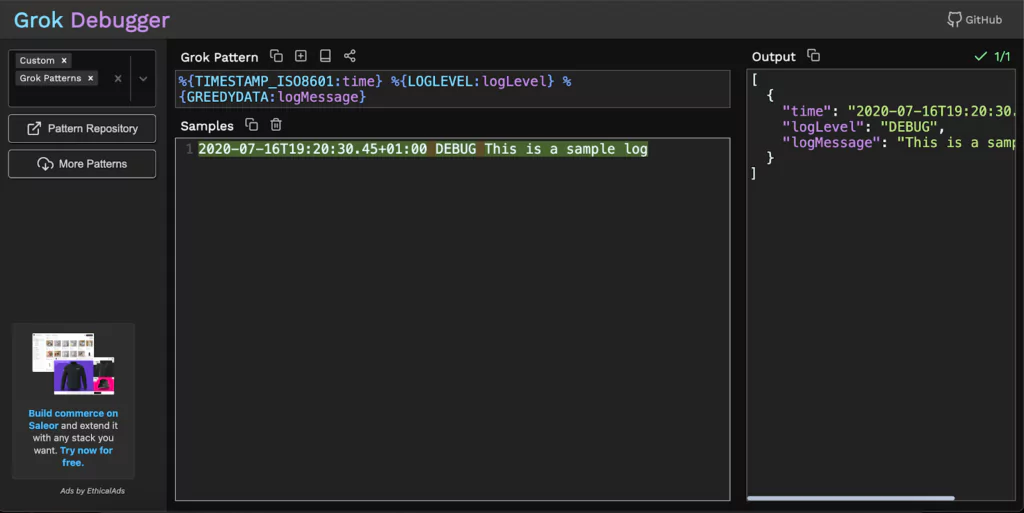
Naturally, we would also like to test these Grok filters and see if they work as intended, on our specific data. For this purpose, we can use the Grok Debugger tool.


With the Grok Debugger, we can copy and paste the Grok filter in the first “Grok Pattern” field and the example log line in the second “Samples” field. 

The output would look like this:

Now that we’ve established some Grok fundamentals, let’s explore the concepts using various examples.

Hands-On Exercises

Parsing a Log File with Grok

Let’s apply this newly acquired knowledge and see how to use the Logstash Grok filter plugin on a sample log file.

First, let’s create a directory where we will store our sample data:

$ mkdir -p /home/student/03-grok-examples

Next, let’s create the file we will parse:

$ nano /home/student/03-grok-examples/sample.log

Now let’s copy and paste the following text into the nano editor:

2020-10-11T09:49:35Z INFO variable server value is tomcat
2020-03-14T22:50:34Z ERROR cannot find the requested resource
2020-01-02T14:58:40Z INFO initializing the bootup
2020-06-04T06:56:04Z DEBUG initializing checksum
2020-05-07T03:07:11Z INFO variable server value is tomcat

Finally, let’s press CTRL+X, then type Y and then press ENTER to save the file.

We can now create the Logstash configuration file:

$ sudo nano /etc/logstash/conf.d/grok-example.conf

And enter the following content:

input {
  file {
   path => "/home/student/03-grok-examples/sample.log"
   start_position => "beginning"
   sincedb_path => "/dev/null"
  }
}
  filter {
   grok {
    match => { "message" => ['%{TIMESTAMP_ISO8601:time} %{LOGLEVEL:logLevel} %{GREEDYDATA:logMessage}'] }
  }
}
output {
  elasticsearch {
   hosts => "https://localhost:9200"
   index => "demo-grok"
}

stdout {}

}

Once again, we press CTRL+X, followed by Y and then ENTER to save the file.

We can see the configuration under the filter section is quite straightforward. We instruct Logstash to use the grok filter plugin and add match instructions where we used the same patterns and identifiers we explored earlier.

"message" => ['%{TIMESTAMP_ISO8601:time} %{LOGLEVEL:logLevel} %{GREEDYDATA:logMessage}']

Let’s run Logstash with our new configuration and see what happens.

$ sudo /usr/share/logstash/bin/logstash -f /etc/logstash/conf.d/grok-example.conf

After a few seconds, the output shows that the entries have been parsed and imported. At that point, we can press CTRL+C to exit from Logstash.

Let’s explore the contents added to the index:

$ curl -XGET "https://localhost:9200/demo-grok/_search?pretty=true" -H 'Content-Type: application/json' -d'{
  "_source": [
   "logLevel",
   "time",
   "logMessage"
  ]
}'

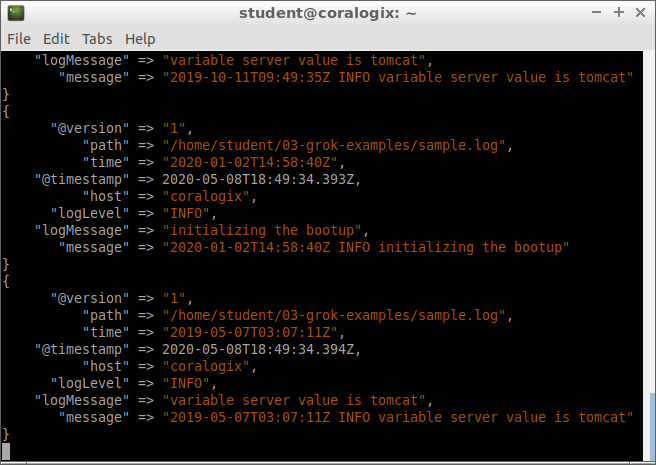
We’ll see our log entries neatly organized in the proper fields. Here’s an example of a document from the index:
 {
 "_index" : "demo-grok",
 "_type" : "_doc",
 "_id" : "FDyf9XEBIGK-cCtPEo5n",
 "_score" : 1.0,
 "_source" : {
 "logLevel" : "INFO",
 "logMessage" : "variable server value is tomcat",
 "time" : "2020-05-07T03:07:11Z"
 }
}

In our scenario, things are optimal since each log line has precisely three components, in the same order and each matches every Grok pattern. But what if some text didn’t match any pattern we defined?

How Grok Deals with Lines that Don’t Match Patterns

Let’s edit our sample log:

$ nano /home/student/03-grok-examples/sample.log

and add the following line at the end:

55.12.32.134 GET /user/id/properties


Our sample log should now have six lines and look like this:

2020-10-11T09:49:35Z INFO variable server value is tomcat
2020-03-14T22:50:34Z ERROR cannot found the requested resource
2020-01-02T14:58:40Z INFO initializing the bootup
2020-06-04T06:56:04Z DEBUG initializing checksum
2020-05-07T03:07:11Z INFO variable server value is tomcat
55.12.32.134 GET /user/id/properties

Once again, we press CTRL+X, then Y and ENTER to save the file.

We don’t want to write over previous data we imported into our index, so let’s delete that first:

$ curl -XDELETE "https://localhost:9200/demo-grok"

Now let’s rerun Logstash:

$ sudo /usr/share/logstash/bin/logstash -f /etc/logstash/conf.d/grok-example.conf

After the job is done, we press CTRL+C to exit. Let’s see what our index looks like this time:

$ curl -XGET "https://localhost:9200/demo-grok/_search?pretty=true" -H 'Content-Type: application/json' -d'{ }'

Besides the entries we saw the first time, we will now see a sixth entry that looks like this:

{
"_index" : "demo-grok",
"_type" : "_doc",
"_id" : "Gjyr9XEBIGK-cCtPRI4L",
"_score" : 1.0,
"_source" : {
"tags" : [
"_grokparsefailure"
],
"@timestamp" : "2020-05-08T19:02:53.768Z",
"path" : "/home/student/03-grok-examples/sample.log",
"message" : "55.12.32.134 GET /user/id/properties",
"@version" : "1",
"host" : "coralogix"
}

We can see that the document lacks the fields “time,” “logLevel,” and “logMessage.” The “message” field shows the line from our sample log that generated this document. We can see that this line doesn’t have any fields matching our Grok filter patterns. A tag called _grokparsefailure is added to signal that the parser had trouble with this line from the file.

We now saw what happens when Grok patterns can’t match anything on a line. Let’s explore the next scenario.

Multiple Grok Filters to Parse Complex Files

In our previous Logstash configuration, Grok tried to match our three patterns against each line in the sample log. But what if we want each line scanned for a second pair of patterns in case the first pair doesn’t match anything?

For example, in our case, if the line doesn’t have a timestamp, log level and log message, then Grok should try to search for another set of patterns. In this scenario, it will look for an IP address, an HTTP method and a URL.

Let’s create another configuration file for this:

$ sudo nano /etc/logstash/conf.d/grok-example-02.conf

In the nano editor, we copy and paste this content:

input {
  file {
   path => "/home/student/03-grok-examples/sample.log"
   start_position => "beginning"
   sincedb_path => "/dev/null"
  }
}
filter {
  grok {
   match => { "message" => [
   '%{TIMESTAMP_ISO8601:time} %{LOGLEVEL:logLevel} %{GREEDYDATA:logMessage}',
   '%{IP:clientIP} %{WORD:httpMethod} %{URIPATH:url}'
   ] }
 }
}
output {
  elasticsearch {
   hosts => "https://localhost:9200"
   index => "demo-grok-multiple"
 }

stdout {}

}

Once again, we press CTRL+X, followed by Y and then ENTER to save the file.

We notice the change in the config file is the new line added to the match option:

'%{IP:clientIP} %{WORD:httpMethod} %{URIPATH:url}'

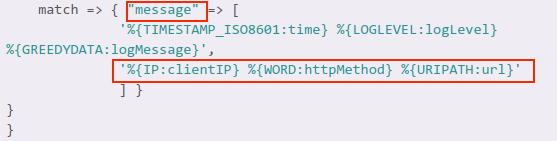
We also see that these two sets of patterns are separated by a comma. So it’s pretty straightforward to add multiple pairs of patterns to a Grok filter.

But why would we do this? Well, this way, we can process complex logs where multiple programs log to the same file, as one example. Say Nginx and MySQL logged to the same file. One set of patterns can deal with log lines generated by Nginx, the other set can deal with lines generated by MySQL.


Let’s run Logstash with these new options:

$ sudo /usr/share/logstash/bin/logstash -f /etc/logstash/conf.d/grok-example-02.conf

As usual, we wait for the program to finish and then press CTRL+C to exit.

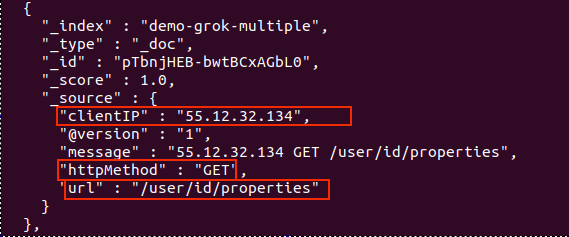
Let’s see what has been added to the index:

$ curl -XGET "https://localhost:9200/demo-grok-multiple/_search?pretty" -H 'Content-Type: application/json' -d'{
  "_source": {
   "excludes": [
    "@timestamp",
   "host",
  "path"
  ]
 }
}

No more _grokparsefailure tags. Also, a new document corresponds to the new line we added to our sample log:

Nice! We got our log data neatly organized in Elasticsearch! We now have the freedom to parse almost any kind of text file, even if its information doesn’t follow a fixed pattern.

Elasticsearch Update Index Settings

You’ve created the perfect design for your indices and they are happily churning along. However, in the future, you may need to reconsider your initial design and update the Elasticsearch index settings. This might be to improve performance, change sharding settings, adjust for growth and manage ELK costs. Whatever the reason, Elasticsearch is flexible and allows you to change index settings. Let’s learn how to do that!

During the lifecycle of an index, it will likely change to serve various data processing needs, like:

  • High ingest loads
  • Query volumes of varying intensity
  • Reporting and aggregation requirements
  • Changing data retention and data removal

Generally speaking, changes that can be performed on an index can be classified into these four types:

  • Index Settings
  • Sharding
  • Primary Data
  • Low-Level Changes to the index’s inner structure such as the number of segments, freezing, which we won’t cover for the purposes of this lesson. However, If you’d like to read more about advanced index design concepts, hop over to this blog post.

Index Settings

Elasticsearch index has various settings that are either explicitly or implicitly defined when creating an index.

There are two types of settings:

  • Dynamic Settings that can be changed after index creation
  • Static Settings that cannot be changed after index creation

Dynamic Settings can be changed after the index is created and are essentially configurations that don’t impact the internal index data directly. For example:

  • number_of_replicas: the number of copies the index has
  • refresh_interval when the ingested data is made available for queries
  • blocks disabling readability/writability of the index
  • _pipeline selecting a preprocessing pipeline applied to all documents

We can update dynamic settings with:

PUT requests to the /{index}/_settings endpoint.

Static Settings on the other hand, are settings that cannot be changed after index creation. These settings affect the actual structures that compose the index. For example:

  • number_of_shards the primary shards
  • codec defining the compression scheme of the data

Sharding

Shards are the basic building blocks of Elasticsearch’s distributed nature. It allows us to more easily scale up a cluster and achieve higher availability and resiliency of data.

High Availability
When we say that something has high availability, it means that we can expect the service to work, uninterrupted, for a very long time. By spreading services and data across multiple nodes, we make our infrastructure able to withstand occasional node failures, while still continuing to operate normally (service doesn’t go down, so it’s still “available”).

High Resiliency
Resiliency is achieved by means such as having enough copies of data around so that even if something fails, the healthy copies prevent data loss. Or, otherwise said, the infrastructure “resists” certain errors and can even recover from them.

How Sharding Works

Imagine having an index with multiple shards. Even if one of the shards should go down for some reason, the other shards can keep the index operating and also complete the requests of the lost shard. This is equivalent to high availability and resiliency.

Furthermore, if we need to achieve higher speeds, we can add more shards. By distributing the work to multiple shards, besides completing tasks faster, the shards also have less individual work to do, resulting in less pressure on each of them. This is equivalent to “scaling up,” work is done in parallel, faster, and there’s less pressure on each individual server.

Elasticsearch Cluster

Changing Number of Shards

As mentioned, the number of primary shards is a Static Setting and therefore cannot be changed on the fly, since it would impact the structure of the master data. However, in contrast to primary shards, the number of replica shards can be changed after the index is created since it doesn’t affect the master data.

If you want to change the number of primary shards you either need to manually create a new index and reindex all your data (along with using aliases and read-only indices) or you can use helper APIs to achieve this faster:

  1. POST /{source-index}/_shrink/{target-index-name} to lower the number
  2. POST /{source-index}/_split/{target-index-name} to multiply the number

Both actions require a new target index name as input.

Splitting Shards


If we need to increase the number of shards, for example, to spread the load across more nodes, we can use the  _split API. However, this shouldn’t be confused with simply adding more shards. Instead, we should look at it as multiplication.

The limitation to bear in mind is that we can only split the original primary shard into two or more primary shards, so you couldn’t just increase it by +1. Let’s go through a few examples to clarify:

  • If we start with 2, and multiple by a factor of 2, that would split the original 2 shards into 4
  • Alternatively, if we start with 2 shards and split them down to 6, that would be a factor of 3
  • On the other hand, if we started with one shard, we could multiply that by any number we wanted
  • We could not, however, split 2 shards into 3.

Shrinking Shards

The /_shrink API does the opposite of what the _split API does; it reduces the number of shards. While splitting shards works by multiplying the original shard, the  /_shrink API works by dividing the shard to reduce the number of shards. That means that you can’t just “subtract shards,” but rather, you have to divide them.

For example, an index with 8 primary shards can be shrunk to 4, 2 or 1. One with 15, can be brought down to 5, 3 or 1.

Primary Data

Primary Elasticsearch Index Data
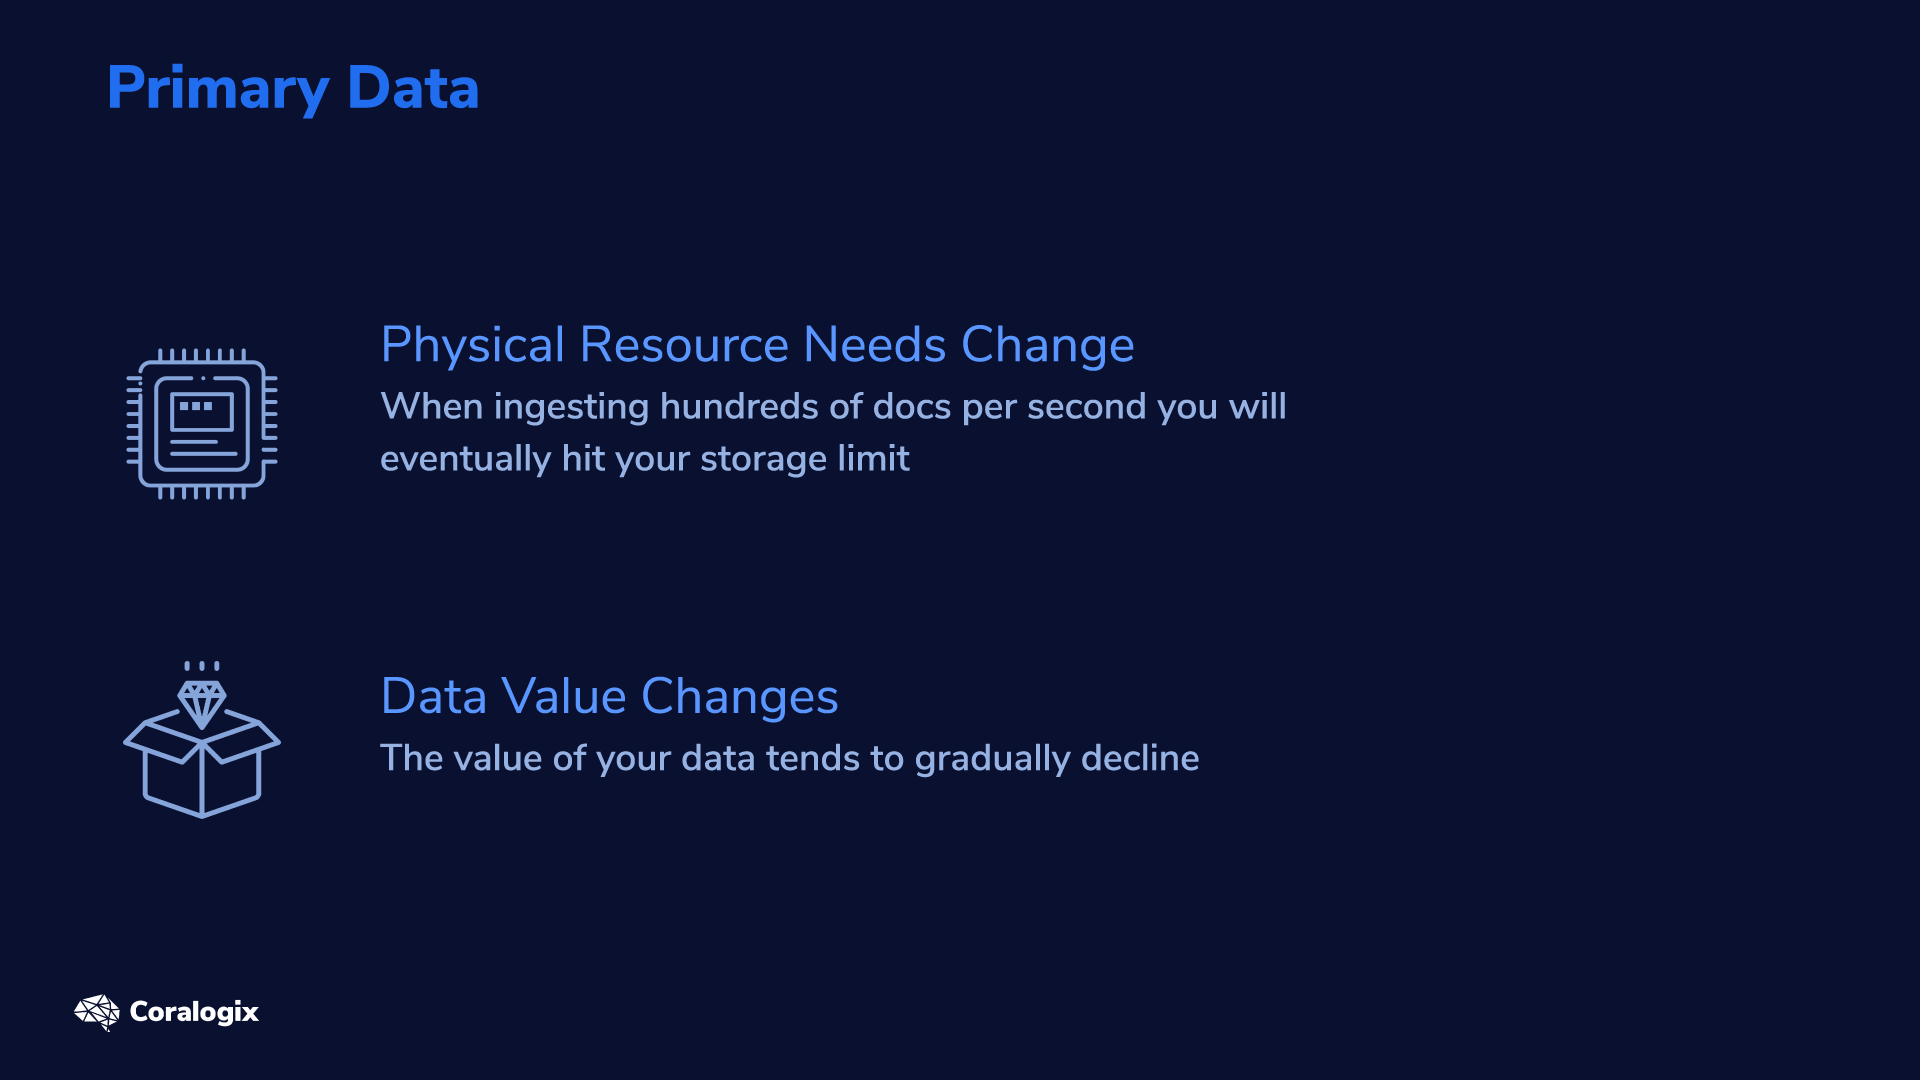
When you change your primary index data there aren’t many ways to reconstruct it. Now, you may be thinking, “why change the primary data at all?”

There are two potential causes for changing the primary data:

  • Physical resource needs change
  • The value of your data changes

Resource limitations are obvious; when ingesting hundreds of docs per second you will eventually hit your storage limit.

Summarize Historical Data with Rollups

Elasticsearch Index Rollup
Secondly, the value of your data tends to gradually decline (especially for logging and metrics use cases). Holding millisecond-level info doesn’t have the same value as when it was fresh and actionable, as opposed to being a year old. That’s why Elasticsearch allows you to rollup data to create aggregated views of the data and then store them in a different long-term index.

For the purposes of this lesson, we’ll focus the hands-exercises only on Dynamic Setting changes.

Hands-on Exercises

Before starting the hands-on exercises, we’ll need to download sample data to our index from this Coralogix Github repository.

Cluster Preparation

Before we can begin experimenting with shards we actually need more nodes to distribute them across. We’ll create 3 nodes for this purpose, but don’t worry, we’ll set it up to run on a single local host (our vm). This approach wouldn’t be appropriate for a production environment, but for our hands-on testing, it will serve us well.

Each node will require a different configuration, so we’ll copy our current configuration directory and create two new configuration directories for our second and third node.

sudo cp -rp /etc/elasticsearch/ /etc/elasticsearch-node-2
sudo cp -rp /etc/elasticsearch/ /etc/elasticsearch-node-3

Next, we need to edit the configurations. We will perform these changes under the Elasticsearch user to have sufficient permissions.

sudo -su elasticsearch

We need to make the following changes to the elasticsearch.yml configs file:

  • Pick a reasonable name for our cluster (eg. lecture-cluster)
  • Assign each node a unique name
  • Set the initial master nodes for the first cluster formation
  • Configure the max_local_storage_nodes setting (node.max_local_storage_nodes: 3)
    • This will allow us to share our data.path between all our nodes.

Perform these changes for our existing node using this command:

cat > /etc/elasticsearch/elasticsearch.yml <<- EOM
# ---------------------------------- Cluster -----------------------------------
cluster.name: lecture-cluster
# ------------------------------------ Node ------------------------------------
node.name: node-1
# ----------------------------------- Paths ------------------------------------
path.data: /var/lib/elasticsearch
path.logs: /var/log/elasticsearch
# ---------------------------------- Network -----------------------------------
network.host: 0
http.port: 9200
# --------------------------------- Discovery ----------------------------------
discovery.seed_hosts: ["127.0.0.1"]
cluster.initial_master_nodes: ["node-1", "node-2", "node-3"]
# ---------------------------------- Various -----------------------------------
node.max_local_storage_nodes: 3
EOM

Now we’ll do the same for the newly created configuration directories. Notice that we are incrementing the node name and node port:

for i in {2..3}
do
cat > /etc/elasticsearch-node-$i/elasticsearch.yml <<- EOM
# ---------------------------------- Cluster -----------------------------------
cluster.name: lecture-cluster
# ------------------------------------ Node ------------------------------------
node.name: node-${i}
# ----------------------------------- Paths ------------------------------------
path.data: /var/lib/elasticsearch
path.logs: /var/log/elasticsearch
# ---------------------------------- Network -----------------------------------
network.host: 0
http.port: 920${i}
# --------------------------------- Discovery ----------------------------------
discovery.seed_hosts: ["127.0.0.1"]
cluster.initial_master_nodes: ["node-1", "node-2", "node-3"]
# ---------------------------------- Various -----------------------------------
node.max_local_storage_nodes: 3
EOM
done

Next, we need to copy the systemd unit-file of Elasticsearch for our new nodes so that we will be able to run our nodes in separate processes.

cd /usr/lib/systemd/system
sudo cp elasticsearch.service elasticsearch-node-2.service
sudo cp elasticsearch.service elasticsearch-node-3.service

In the unit file, we need to change only a single line and that is providing the link to the node’s specific configuration directory.

sudo nano elasticsearch-node-2.service
# change following line
Environment=ES_PATH_CONF=/etc/elasticsearch-node-2
 
sudo nano elasticsearch-node-3.service
# change following line
Environment=ES_PATH_CONF=/etc/elasticsearch-node-3

Finally, we can reload the changes in the unit files.

sudo systemctl daemon-reload

To save us from potential trouble, make sure that in /etc/default/elasticsearch the following line is commented out. Otherwise, this default (ES_PATH_CONF) would override our new paths to the configuration directories when starting our service.

sudo nano /etc/default/elasticsearch
# Elasticsearch configuration directory
#ES_PATH_CONF=/etc/elasticsearch

Perfect! Now you can sequentially start all of our nodes.

sudo systemctl start elasticsearch
sudo systemctl start elasticsearch-node-2
sudo systemctl start elasticsearch-node-3

After they are started you can check the status of the cluster and that all nodes have joined in.

curl localhost:9200/_cluster/health?pretty

pasted image 0 32

Setup

For the following exercises we’ll use a data set provided on the Coralogix github (more info in this article). It consists of wikipedia pages data and is used also in other lectures. For this specific topic though, the actual data contents are not the most important aspect so feel free to play with any other data relevant for you, just keep the same index settings.

As we will be digging into sharding we will also touch on the aspect of clustering so make sure to prepare three valid nodes before continuing. But don’t worry you can still run on a single host.

Now, let’s download and index the data set with these commands:

mkdir index_design && cd "$_"
for i in {1..10}
do
  wget "https://raw.githubusercontent.com/coralogix-resources/wikipedia_api_json_data/master/data/wiki_$i.bulk"
done
 
curl --request PUT 'https://localhost:9200/example-index' 
--header 'Content-Type: application/json' 
-d '{"settings": { "number_of_shards": 1, "number_of_replicas": 0 }}'
 
for bulk in *.bulk
do
  curl --silent --output /dev/null --request POST "https://localhost:9200/example-index/_doc/_bulk?refresh=true" --header 'Content-Type: application/x-ndjson' --data-binary "@$bulk"
  echo "Bulk item: $bulk INDEXED!"
done

Dynamic Settings

Now let’s make put all the theoretical concepts we learned to action with a few practical exercises.

We’ll start with Dynamic Settings.

Let’s play with the number_of_replicas parameter. You can review all your current index settings with the following GET request:

vagrant@ubuntu-xenial:~$ curl --location --request GET 'https://localhost:9200/example-index/_settings?include_defaults=true&flat_settings=true&human&pretty'
>>>
{
 "example-index" : {
   "settings" : {
     "index.creation_date" : "1585482088406",
     "index.number_of_replicas" : "0",
     "index.number_of_shards" : "1",
...
   },
   "defaults" : {
     "index.refresh_interval" : "1s",     
     "index.blocks.metadata" : "false",
     "index.blocks.read" : "false",
     "index.blocks.read_only" : "false",
     "index.blocks.read_only_allow_delete" : "false",
     "index.blocks.write" : "false",
     "index.default_pipeline" : "_none",
...
   }
 }
}

As shown in the output, we see that we currently have only one primary shard in example-index and no replica shards. So, if our data node goes down for any reason, the entire index will be completely disabled and the data potentially lost.

To prevent this scenario, let’s add a replica with the next command.

vagrant@ubuntu-xenial:~$ curl --location --request PUT 'https://localhost:9200/example-index/_settings' 
--header 'Content-Type: application/json' 
--data-raw '{
   "index.number_of_replicas" : 1
}'
>>>
{"acknowledged":true}

At this point, it’s a good idea to check if all shards, both primary and replicas, are successfully initialized, assigned and started. A message stating UNASSIGNED could indicate that the cluster is missing a node on which it can put the shard.

By default, it would refuse to allocate the replica on the same primary node, which makes sense; it’s like putting all eggs in the same basket — if we lose the basket, we lose all the eggs.

You can consult the following endpoint to be sure that all your shards (both primary and replica ones) are successfully initialized, assigned and started.

vagrant@ubuntu-xenial:~$ curl --location --request GET 'https://localhost:9200/_cat/shards?v'
index         shard prirep state    docs   store ip        node
example-index 0     p      STARTED 38629 113.4mb 10.0.2.15 node-2
example-index 0     r      STARTED 38629 113.4mb 10.0.2.15 node-1

With this easy step, we’ve improved the resiliency of our data. If one node fails, the other can take its place. The cluster will continue to function and the replica will still have a good copy of the (potentially) lost data from the failed node.

Splitting Shards

We now have a setup of one primary shard on a node, and a replica shard on the second node, but our third node remains unused. To change that, we’ll scale and redistribute our primary shards with the _split API.

However, before we can start splitting, there are two things we need to do first:

  • The index must be read-only
  • The cluster health status must be green

Let’s take care of these splitting requirements!

To make the index read-only, we change the blocks dynamic setting:

curl --location --request PUT 'https://localhost:9200/example-index/_settings' 
--header 'Content-Type: application/json' 
--data-raw '{
   "index.blocks.write": true
}'
>>>
{"acknowledged":true}

Now let’s check the cluster health status to verify that’s in “green”:

curl --location --request GET 'https://localhost:9200/_cluster/health?pretty' | grep status
>>>
 "status" : "green",

The status shows as “green” so we can now move on to splitting with the following API call:

We’ll split it by a factor of 3, so 1 shard will become 3. All other defined index settings will remain the same, even for the new index, named example-index-sharded:

curl --location --request POST 'https://localhost:9200/example-index/_split/example-index-sharded' 
--header 'Content-Type: application/json' 
--data-raw '{
       "settings": {
               "index.number_of_shards": 3
       }
}'
>>>
{"acknowledged":true,"shards_acknowledged":true,"index":"example-index-sharded"}

We should note here that, when required, the  _split API allows us to pass standard parameters, like we do when creating an index. We can, thus, specify different desired settings or aliases for the target index.

If we now call the _cat API, we will notice that the new index more than tripled the size of its stored data, because of how the split operation works behind the scenes.

vagrant@ubuntu-xenial:~$ curl --location --request GET 'https://localhost:9200/_cat/shards?v'
index                 shard prirep state    docs   store ip        node
example-index-sharded 2     p      STARTED 12814  38.9mb 10.0.2.15 node-2
example-index-sharded 2     r      STARTED 12814 113.4mb 10.0.2.15 node-3
example-index-sharded 1     p      STARTED 12968 113.4mb 10.0.2.15 node-1
example-index-sharded 1     r      STARTED 12968 113.4mb 10.0.2.15 node-3
example-index-sharded 0     p      STARTED 12847  38.9mb 10.0.2.15 node-2
example-index-sharded 0     r      STARTED 12847 113.4mb 10.0.2.15 node-1
example-index         0     p      STARTED 38629 113.4mb 10.0.2.15 node-2
example-index         0     r      STARTED 38629 113.4mb 10.0.2.15 node-1

A merge operation will reduce the size of this data, eventually, when it will run automatically. If we don’t want to wait, we also have the option to force a merge, immediately, with the /_forcemerge API.

vagrant@ubuntu-xenial:~$ curl --location --request POST 'https://localhost:9200/example-index-sharded/_forcemerge'

However, we should be careful when using the /_forcemerge API on production systems. Some parameters can have unexpected consequences. Make sure to read the /_forcemerge API documentation thoroughly, especially the warning, to avoid side effects that may come as a result of using improper parameters.

how to get some insights on this – you can further inspect index /_stats API that goes into lot’s of details on you index’s internals. Hint: inspect it before you forcemerge and after and you may find some similar answers.

We can get insights on how our indices are performing with their new configuration. We do this by calling the /_stats API, which displays plenty of useful details. Here’s an example of how the size was reduced after splitting (on the left) and after merging (on the right).

pasted image 0 31

pasted image 0 33

Shrinking Shards

We tried splitting shards, now let’s try the opposite by reducing our number of shards the /_shrink API which works by dividing shards.

Note: While we’re just experimenting here, in real-world production scenarios, we would want to avoid shrinking the same shards that we previously split, or vice versa.

Before shrinking, we’ll need to:

  1. Make Index read-only
  2. Ensure a copy of every shard in the index is available on the same node
  3. Verify that the Cluster health status is green

We can force the allocation of each shard to one node with the index.routing.allocation.require._name setting. We’ll also activate read-only mode.

vagrant@ubuntu-xenial:~$ curl --location --request PUT 'https://localhost:9200/example-index-sharded/_settings' 
--header 'Content-Type: application/json' 
--data-raw '{
 "settings": {
   "index.routing.allocation.require._name": "node-1",
   "index.blocks.write": true
 }
}'

With prerequisites met, we can now shrink this to a new index with one shard and also reset the previously defined settings. Assigning “null” values brings the settings back to their default values:

vagrant@ubuntu-xenial:~$ curl --location --request POST 'https://localhost:9200/example-index-sharded/_shrink/example-index-shrunk' 
--header 'Content-Type: application/json' 
--data-raw '{
 "settings": {
   "index.routing.allocation.require._name": null,
   "index.blocks.write": null,
   "index.number_of_shards": 1
 }
}'

Learn More