The new standard of observability is here. Discover Olly, the industry’s first
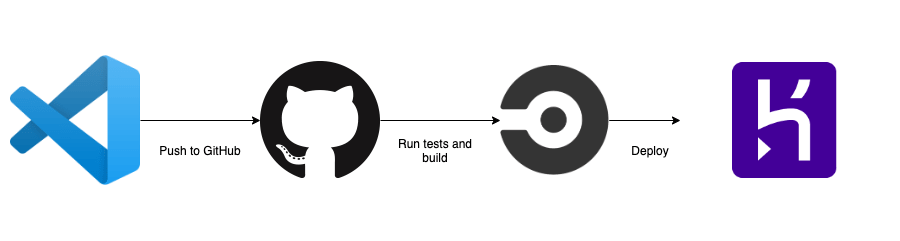
![Heroku Continuous Integration & Deployment with Docker [Hands-On Tutorial]](https://coralogix.com/wp-content/uploads/2020/05/2-9.png)
In this tutorial, we will be using Heroku to deploy our Node.js application through CircleCI using Docker. We will set up Heroku Continuous Integration and Deployment (CI/CD) solution pipelines using Git as a single source of truth.
Containerization allows developers to create and deploy applications faster with a wide range of other benefits like increased security, efficiency, agility to integrate with DevOps pipelines, portability, and scalability. Hence, companies and organizations are largely adopting this technology and it’s resulting in benefits for developers and removing overhead for the operations team in the software development lifecycle.
Benefits of having an Heroku CI/CD pipeline:
- Improved code quality and testability
- Faster development and code review
- Risk mitigation
- Deploy more often
Requirements
To complete this tutorial you will need the following:
- Git and GitHub
- Heroku free tier account
- CircleCI
- Node.js development environment
- Docker and Docker Compose
- Redis
Overview
The application architecture is always fundamental and important so we can properly align our various components in a systematic way to make it work. Let’s define the architecture of our example application so that we can have a proper vision before writing our code and integrating CI/CD pipelines.
We’ll be using Docker to deploy our Node.js application. Docker provides the flexibility to ship the application easily to cloud platforms. We will be using CircleCI as going to be our Heroku Continuous Integration and Deployment tool where we will run our unit and integrations tests. If tests are passed successfully, we are good to deploy our application on Heroku using Container Runtime.
Setup Application
Let’s start working on this by creating a small Node.js project. I’ve already created a small Node.js application that uses Redis to store key/value pairs. You can find the application on GitHub repo under the nodejs-project branch.
You can fork and clone the repo and setup Node.js application locally by running the following–
git clone -b nodejs-project https://github.com/ankitjain28may/heroku-dockerize.git
cd heroku-dockerize
Our application uses Redis for storing key/values pairs so if you have Redis locally installed and running, we can test this application once locally before dockerizing it by running the following command:
npm start
# Output
> [email protected] start /heroku-dockerize
> node server.js

Example app listening at https://localhost:3000
Redis client connected
Let’s browse our application by opening the URL https://localhost:3000/ping in the browser. If we don’t have Redis configured locally, no problem, we have your back. We will be running this application using Docker Compose locally before pushing it to Git.
Dockerize Application
This is our own Node.js application and there is no Docker image available right now so let’s write our own by creating a file named `Dockerfile`.
FROM node:14-alpine

RUN apk add --no-cache --update curl bash
WORKDIR /app

ARG NODE_ENV=development
ARG PORT=3000
ENV PORT=$PORT

COPY package* ./
# Install the npm packages
RUN npm install && npm update

COPY . .

# Run the image as a non-root user
RUN adduser -D myuser
USER myuser

EXPOSE $PORT

CMD ["npm", "run", "start"]
We will be using an official node:14-alpine image from Dockerhub as our base image. We have preferred the alpine image because it’s minimal and lightweight as it doesn’t have additional system packages/libraries which we can always install on top of it using the package manager.
We have defined `NODE_ENV, PORT` as build arguments. We can install only the application dependencies by setting `NODE_ENV=production` while building an image for the production environment. This will install only the application dependencies leaving all the devDependencies.
Note: I am also running `npm update` along with `npm install`, it’s not generally a best practice to run `npm update` as it’s possible that it might break our application due to some updated dependencies while running in production which can result in downtime.
Also, we will be setting up our Heroku Continuous Integration pipeline where we will be running our integration tests and code linting where such issues can be caught before deploying our application.
Awesome! Let’s build our image using the following command:
docker build -t heroku-dockerize:local --build-arg PORT=3000 .
Let’s check our image by running `docker images` command–
docker images
The output will be something similar as shown in the image below:

We can now run our application container using the image created above by running the following command:
docker run --rm --name heroku-dockerize -p 3000:3000 heroku-dockerize:local
We can see the output as shown in the image below–
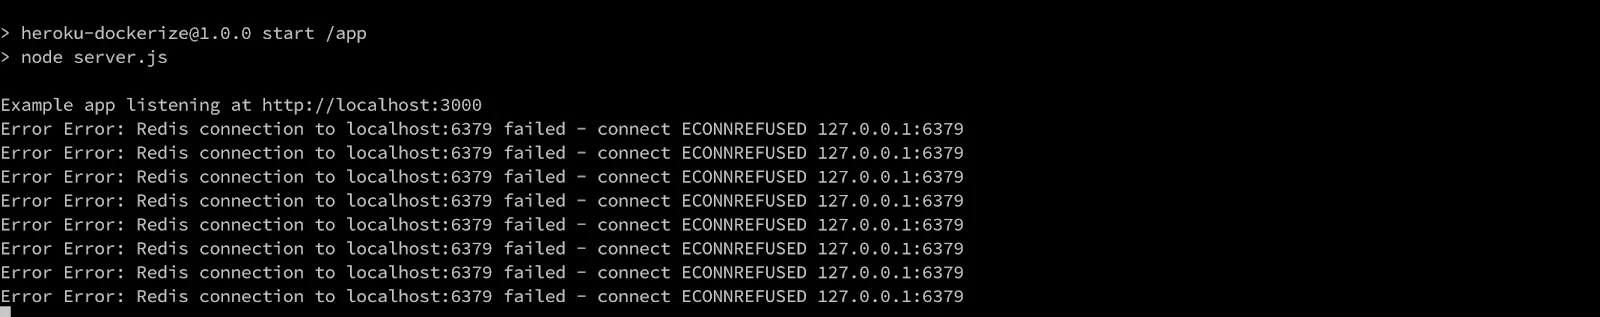
Oops!!! We’ve dockerized our Node.js application but we haven’t configured Redis yet. We need to create another Docker container using the Redis official docker image and create a network between our application container and the Redis container.
Too many things to take care of, so here comes Docker Compose to help. Compose is a tool for defining and running multi-container applications with ease; removing the manual overhead of creating networks, attaching containers to the network, etc.
Let’s set up Docker Compose by creating a file named `docker-compose.yaml`
version: "3.4"

networks:
  internal:

services:
  web:
    build:
      context: .
      args:
        - NODE_ENV=production
    container_name: heroku-dockerize-web

    networks:
      - internal
    ports:
      - "3000:${PORT}"
    env_file:
      - .env
    depends_on:
      - db
    restart: always
    healthcheck:
      test: ["CMD", "curl", "-f", "https://localhost:${PORT}/ping"]
      interval: 10s
      timeout: 10s
      retries: 3
      start_period: 10s
  db:
    image: redis:latest
    container_name: heroku-dockerize-redis
    networks:
      - internal
    restart: always
    healthcheck:
      test: ["CMD", "redis-cli", "ping"]
      interval: 1s
      timeout: 3s
      retries: 3
      start_period: 1s
We have defined our two services named `web` for our Node.js application and `db` for our redis.
Add the following variables to the .env file
PORT=3000
REDIS_URL=redis://db:6379
It is always recommended to store the sensitive values or credentials in `.env` file and add this file in `.gitignore` and `.dockerignore` so we can restrict its circulation.
Let’s create a `.gitignore` and `.dockerignore` file and add the following–
node_modules
.env
.git
coverage
Awesome, Let’s spin our containers using docker-compose–
docker-compose up -d
We can check whether both services are up and running by running the following command —
docker-compose ps

Let’s browse our application and make some dummy request to save data to our redis service.
curl -X POST
      https://localhost:3000/dummy/1
      --header 'Content-Type: application/json'
      --data '{"ID":"1","message":"Testing Redis"}'
# Output
Successful
We have successfully saved our data in our redis, Let’s make a get request to `/dummy/1` to check our data–
curl -X GET https://localhost:3000/dummy/1
#Output
{"ID":"1","message":"Testing Redis"}
Note: We can use Postman to make an API request.
Before moving forward, let’s discuss the pros and cons of Heroku Container Runtime
Heroku Container Runtime
Heroku traditionally uses the Slug Compiler which compresses our code, creates a “slug” and distributes it to the dyno manager for execution. This is a very common understanding of what Slug Compiler does. With the increase in the adoption of Containerization and the benefits of it, Heroku has also announced Heroku Container Runtime which allows us to deploy our Docker images.
With Heroku Container Runtime, we can have all the benefits of Docker like the isolation of our application from the underlying OS, increased security, flexibility to create our custom stack. With Docker, we have an assurity that the application running inside the container on our local machines will surely run on the cloud/other machines, as the only difference between them is of the environment i.e config files or environment variables.
“With great powers come great responsibility”
Similar to this popular quotes, We have more responsibility to maintain and upgrade our Docker image, fixing any security vulnerability, unlike the traditional slug compiler. Other than that, Heroku Container Runtime is not yet mature as it doesn’t support most of the cool features of Docker. These are some of the major missing features that we use with Docker —
- Volume Mounts is not supported and the filesystem is ephemeral.
- Networking linking across dynos is not supported.
- Only the web process (web dyno) is exposed to traffic and PORT is dynamically set by Heroku during runtime as an environment variable so an application must listen to that port, else it will fail to run.
- It doesn’t respect the EXPOSE command in Dockerfile.
We will be using Heroku Container Runtime for deploying our application along with Heroku Manifest. With Heroku manifest, we can define our Heroku app and set up addons, config variables, and structure our images to be built and released.
Let’s define our Heroku Manifest `heroku.yml` file.
setup:
  addons:
    - plan: heroku-redis
      as: REDIS
  config:
    APP_NAME: heroku-dockerize
build:
  docker:
    web: Dockerfile
  config:
    NODE_ENV: production
run:
  web: npm start
As we are using Redis to store key/value pairs, we can define the Heroku Redis add-ons. Under the `setup` field, we can create global configurations and add-ons. Under the `build` field, we have defined our process name and the Dockerfile used to build our Docker image. We can also pass build arguments to our Dockerfile under the `config` field. We haven’t used the `release` field as we are not running any migrations or pre-release tasks. Finally, we have defined our dyno and command to be executed in the `run` field.
Note: If we don’t define the `run` field, the CMD command provided in Dockerfile is used.
Let’s create our app on Heroku. Hope you have installed the Heroku CLI and installed the `@heroku-cli/plugin-manifest` plugin. If not, please refer to this doc.
Run the following command to create our app from Heroku manifest file with all the add-ons and config variables–
# Login to heroku using heroku CLI
$ heroku login

# Create our heroku app via manifest
$ heroku create heroku-dockerize --manifest

# Output
Reading heroku.yml manifest... done
Creating ⬢ heroku-dockerize... done, stack is container
Adding heroku-redis... done
Setting config vars... done
https://heroku-dockerize.herokuapp.com/ | https://git.heroku.com/heroku-dockerize.git
Awesome, we have created our app on Heroku, it has also set our stack to a container. Let’s move to the next section and create our CI/CD pipeline to deploy our Node.js Application.
Heroku Continuous Integration
Continuous Integration (CI) is the process of automating the build and running all our test suites including unit tests, integration tests and also performs code validations and linting to maintain the code quality. If our code successfully passes all the checks and tests, it is good to be deployed to production.
We will be using CircleCi for creating our Heroku CI/CD pipelines. CircleCi is the cloud-based tool to automate the integration and deployment process. Heroku also offers CI/CD pipeline but as we discussed above, Heroku Container Runtime is not very mature and still under development and hence, it is not possible to test container builds via Heroku CI. We can use other third-party CI/CD tools like Travis, GitHub Actions etc.
CircleCI is triggered whenever we make a push event to the GitHub repo via webhooks. We can control the configure the webhooks to be triggered on different events like push, pull requests etc. CircleCI looks for the `.circleci/config.yml` file which contains the instructions/commands to be processed. Let’s create a `.circleci/config.yml` file–
version: 2.1
orbs:
  node: circleci/[email protected]
jobs:
  build-and-test:
    executor: node/default
    steps:
      - checkout
      - node/install-packages
      - run:
          name: Running npm test
          command: |
            npm run test
      - run:
          name: Codecov coverage
          command: |
            npm run coverage
      - setup_remote_docker:
          version: 18.06.0-ce
      - run:
          name: Build Docker image
          command: |
            docker build -t heroku-dockerize:circleci .
            docker images
workflows:
  build-test-deploy:
    jobs:
      - build-and-test
CircleCI has recently introduced reusable packages written in YAML called “Orbs” to help developers with setting up their CI/CD pipeline easily and efficiently. It also allows us to integrate third-party tools effectively in our pipelines. In the above CircleCI config, we have used one such orb called `circleci/node` to easily install Node.js and its package manager.
We have set up the CI pipeline to build and test our application, it will first install the application dependencies and then run all our integration tests. We have also added the step to create the Docker image so we can check for our Docker image.
Let’s push this CircleCI config to our GitHub repo by running the following command–
git add .circleci/config.yml
git commit -m”Integrating CI pipeline”
git push origin master
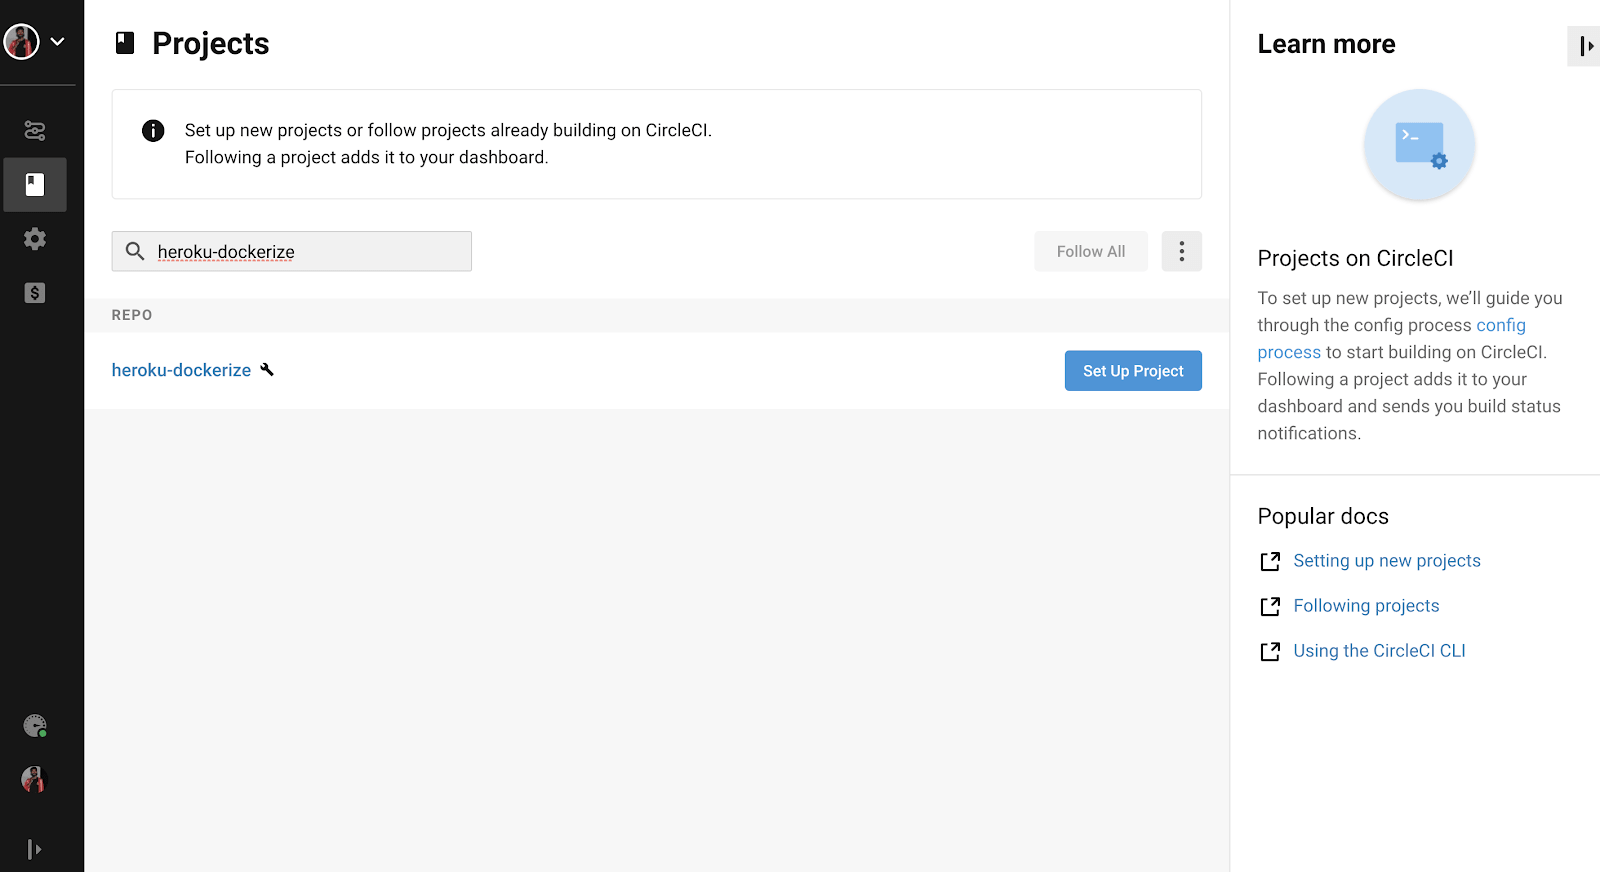
We will now enable this repo from our CircleCI dashboard simply by clicking “Set Up Project” button as shown in the image below–
Once we click on this button, it will ask us to add a config file as shown in the image below:
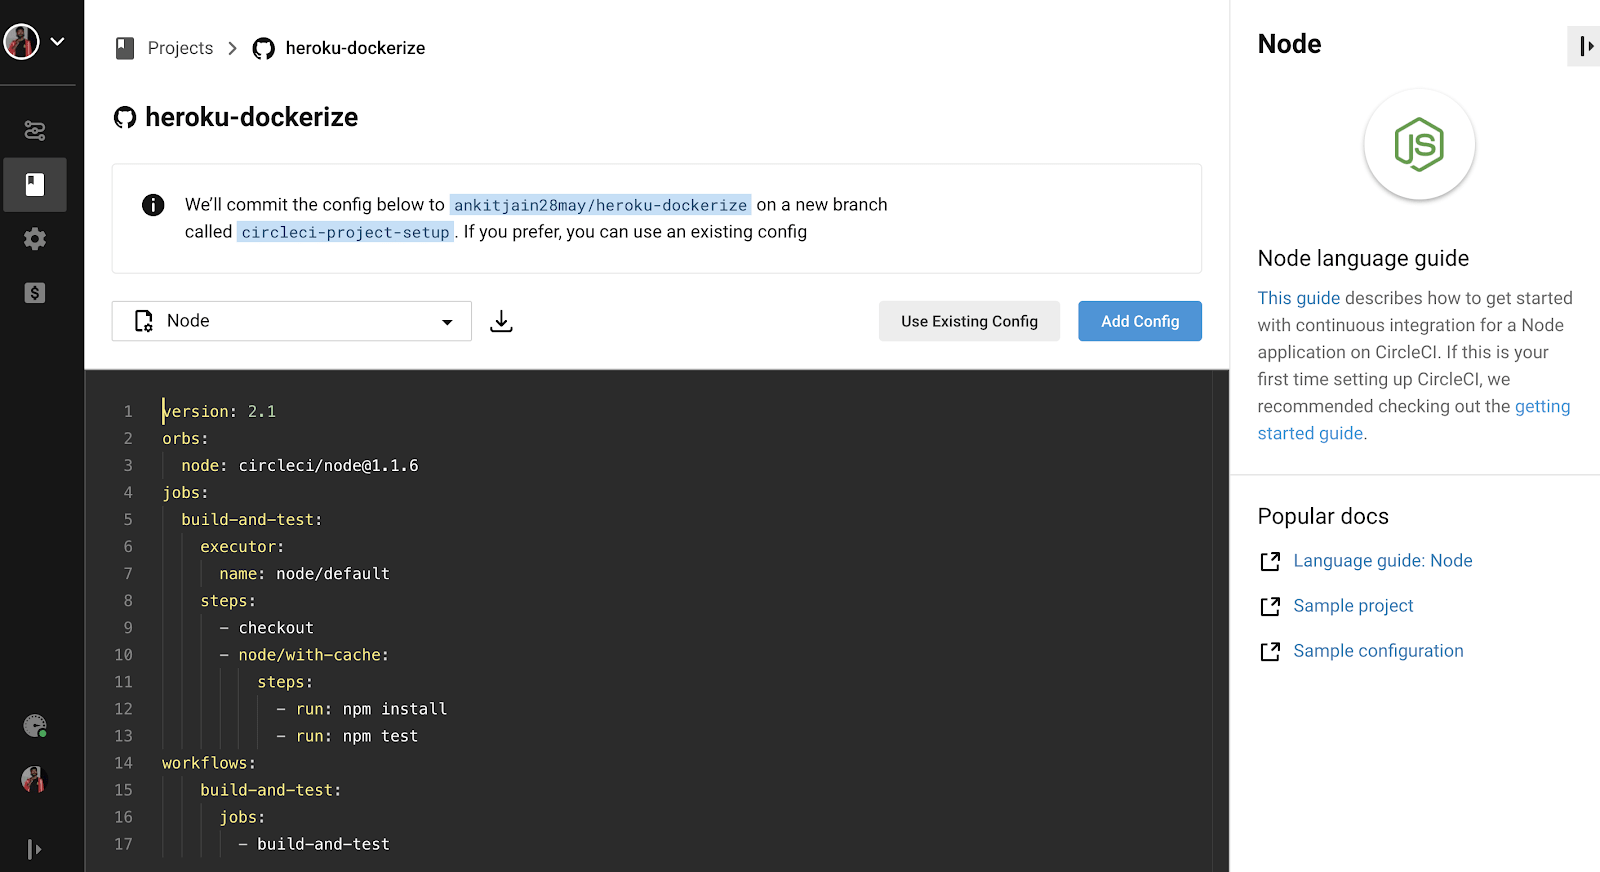
Click on the “Use Existing Config” button as we have already added the CircleCI config and click on “Start Building”. It will start the build for your Node.js application. We can also run pre-tests scripts or post-tests script simply by adding another pre/post-run field.
Awesome, all tests were passed; we are good to deploy this application to our Heroku. Let’s move to our next step of integrating the CD pipeline to deploy this project to our Heroku application.
Integrating The CD Pipeline
In the previous step, we have configured our CI pipeline to make the builds and run all the tests so it can be deployable to the production environment. CI pipelines help the reviewers to review the code easily as all the tests are passed. It also allows the developers to have better visibility in the application code if something breaks without being blocked at the other developers to review.
Let’s deploy our application to Heroku by running the following command–
# deploy on Heroku
$ git push heroku master

# Open the website
$ heroku open

# Check the logs
$ heroku logs -a heroku-dockerize
Heroku has this great feature of deploying applications directly using Git. As we can see this is being done manually by us and it’s never good to deploy our application to production environments without running proper tests and reviews. Let’s add our CD pipeline.
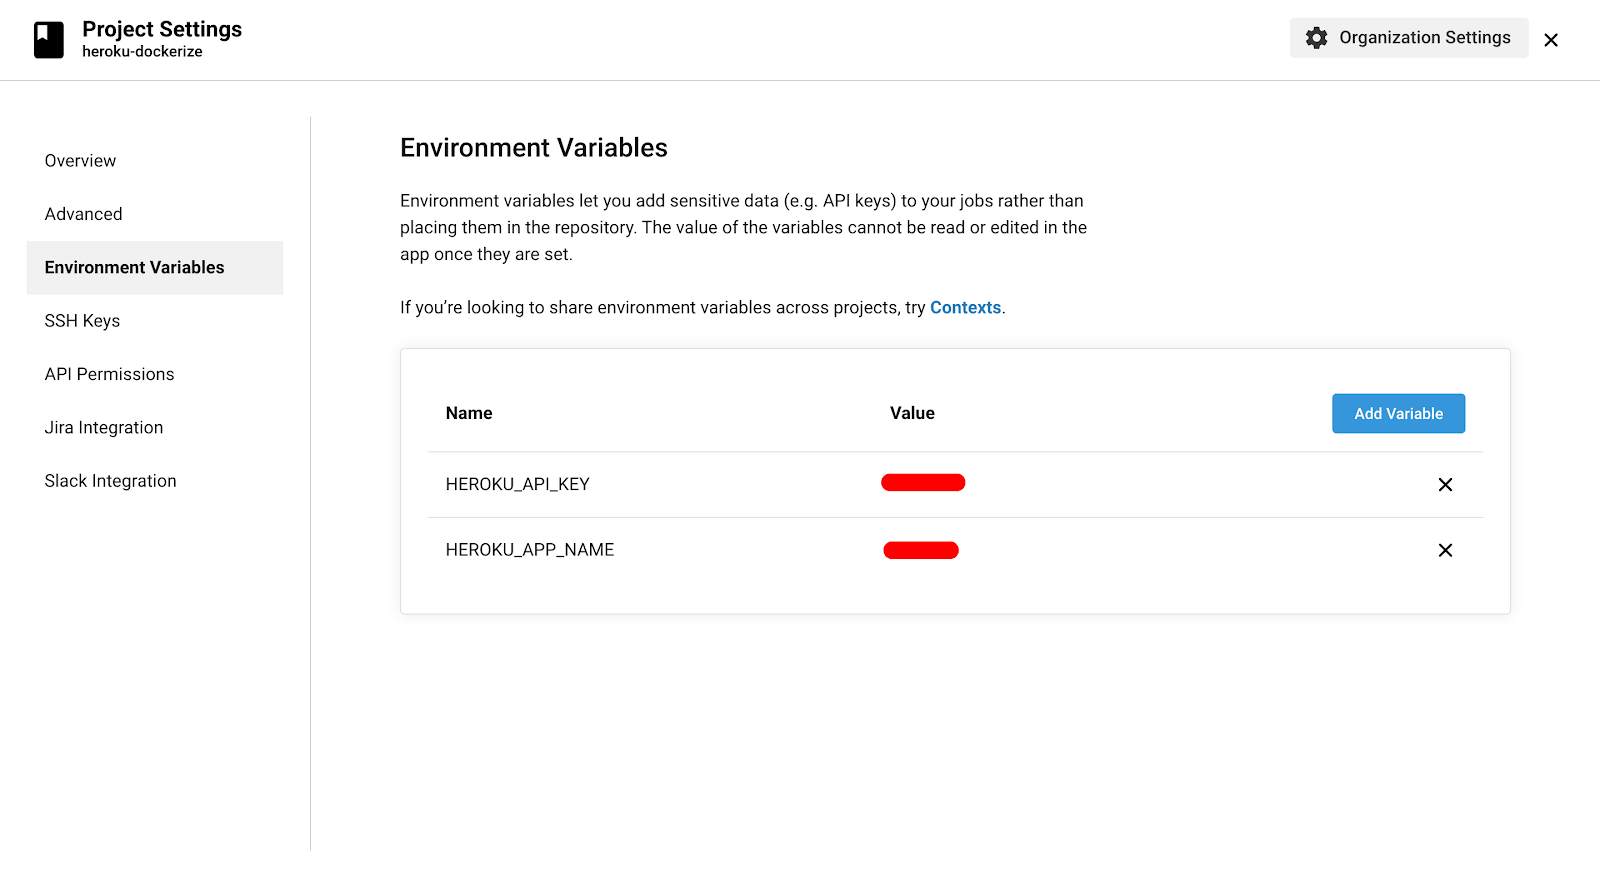
Before adding the pipeline, we need to authenticate the request which CircleCI makes to deploy our application on Heroku. This can be done by setting these two environment variables–
- HEROKU_APP_NAME: Name of our Heroku app.
- HEROKU_API_KEY: This is our Heroku API key which will serve as the token for authentication and verifies our request.
We can find the API Key under the Heroku Account Settings.

Let’s add them as Environment Variables in our CircleCI Project Settings Page as shown in the image below.
Open the `.circleci/config.yml` file and setup the deploy pipeline —
version: 2.1
orbs:
  heroku: circleci/[email protected]
jobs:
  deploy:
    executor: heroku/default
    steps:
      - checkout
      - run:
          name: Storing previous commit
          command: |
            git rev-parse HEAD > ./commit.txt
      - heroku/install
      - setup_remote_docker:
          version: 18.06.0-ce
      - run:
          name: Pushing to heroku registry
          command: |
            heroku container:login
            heroku container:push web --arg NODE_ENV=production -a $HEROKU_APP_NAME
            heroku container:release web -a $HEROKU_APP_NAME
workflows:
  build-test-deploy:
    jobs:
      - deploy:
          requires:
            - build-and-test
          filters:
            branches:
              only:
                - master
We are now using circleci/heroku orb to install Heroku CLI and deploy the application. We can also see that this orb supports the deploy-via-git command to deploy our application as we did above manually, but still, we are login to Heroku container registry and deploying our images. This is because we have run a pre-script to create a `/commit` endpoint which shows the deployed commit by rendering the data from `commit.txt` file.
Under workflows, we have made sure that our code is only deployed for the `master` branch and provided that `build-and-test` pipeline i.e our CI pipeline should be run successfully.
Awesome, Our final `.circleci/config.yml` file–
version: 2.1
orbs:
  node: circleci/[email protected]
  heroku: circleci/[email protected]
jobs:
  build-and-test:
    executor: node/default
    steps:
      - checkout
      - node/install-packages
      - run:
          name: Running npm test
          command: |
            npm run test
      - run:
          name: Codecov coverage
          command: |
            npm run coverage
      - setup_remote_docker:
          version: 18.06.0-ce
      - run:
          name: Build Docker image
          command: |
            docker build -t heroku-dockerize:circleci .
            docker images
  deploy:
    executor: heroku/default
    steps:
      - checkout
      - run:
          name: Storing previous commit
          command: |
            git rev-parse HEAD > ./commit.txt
      - heroku/install
      - setup_remote_docker:
          version: 18.06.0-ce
      - run:
          name: Pushing to heroku registry
          command: |
            heroku container:login
            heroku container:push web --arg NODE_ENV=production -a $HEROKU_APP_NAME
            heroku container:release web -a $HEROKU_APP_NAME
workflows:
  build-test-deploy:
    jobs:
      - build-and-test
      - deploy:
          requires:
            - build-and-test
          filters:
            branches:
              only:
                - master
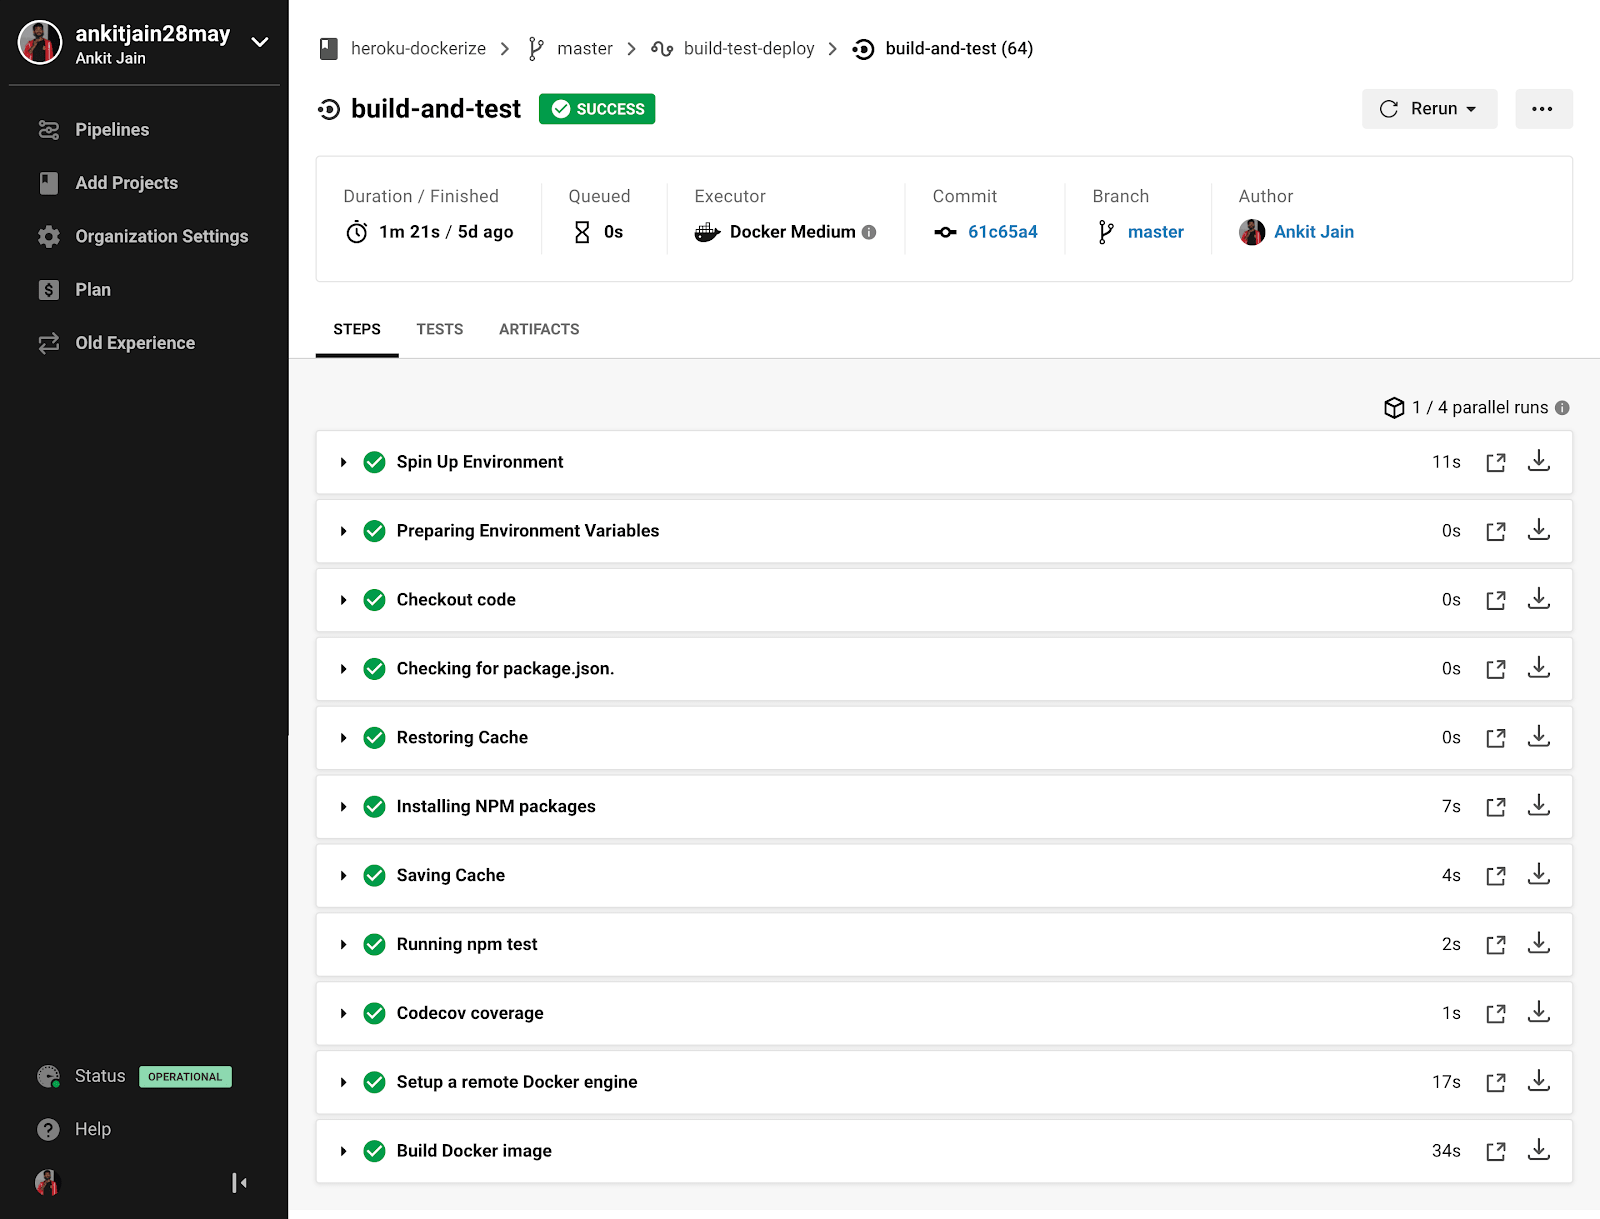
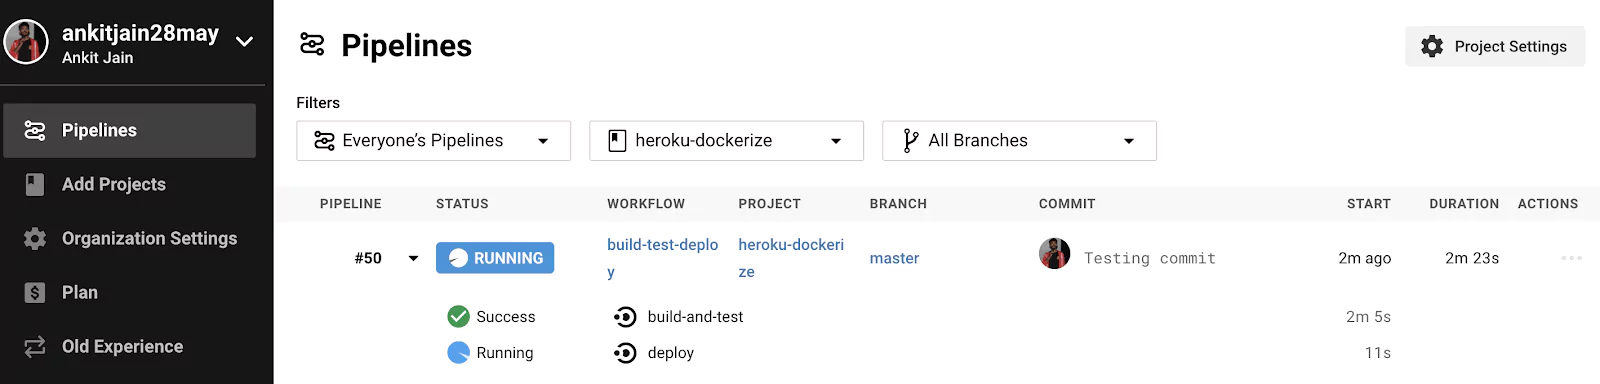
Let’s push our code with the Continuous Deployment configuration added to our CircleCI configuration. Our build will start to run as soon as we push. Let’s check the build–
Our pipeline is running and waiting for the CI pipeline (build-and-test) to be run successfully. Once CI pipeline is finished with success, Our CD pipeline (deploy) will run and deploy our application on Heroku.
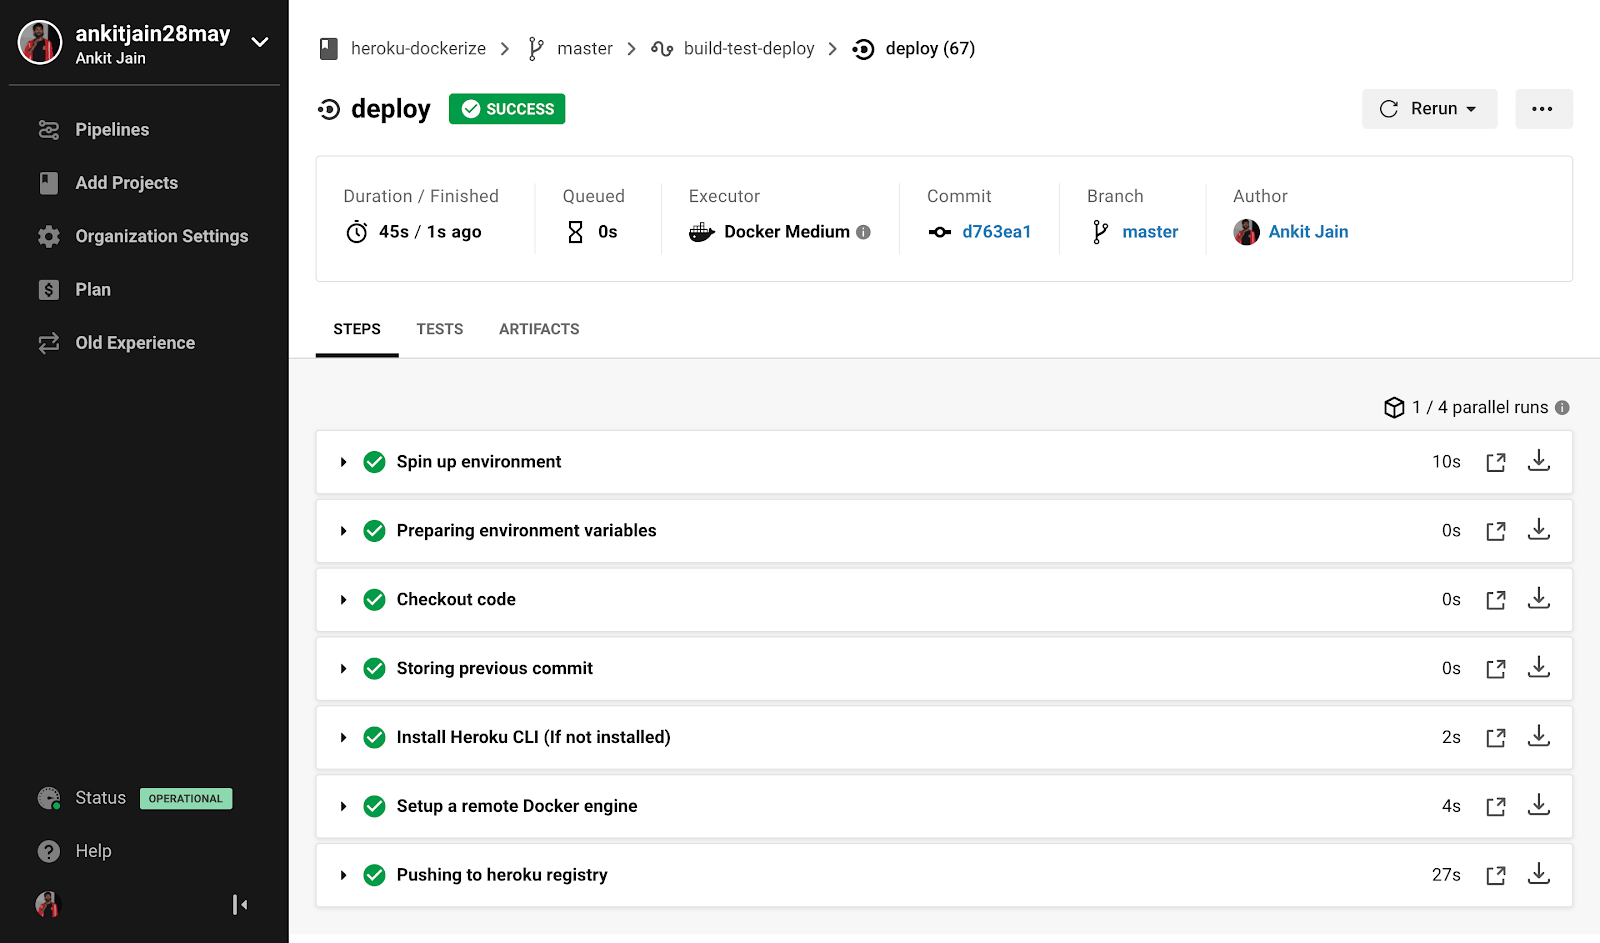
Great, Our CD pipeline is working perfectly. Let’s open our application and check for the `/commit` endpoint as well as we can also verify our application’s other endpoint like saving data to Redis as a key/value pair. Browse the application at https://heroku-dockerize.herokuapp.com
We have added the coverage and some extra tests under the `tests` branch which is merged to master now.
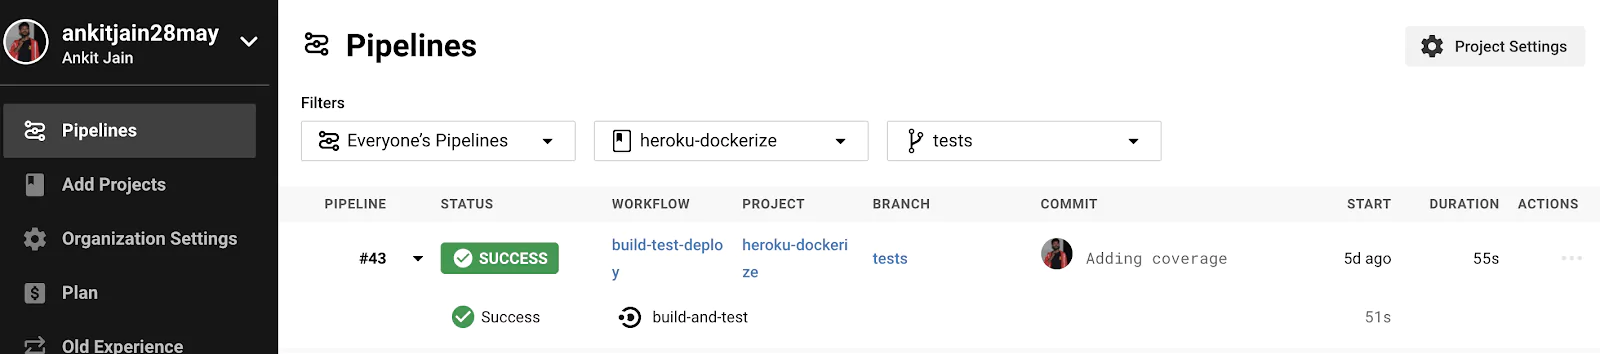
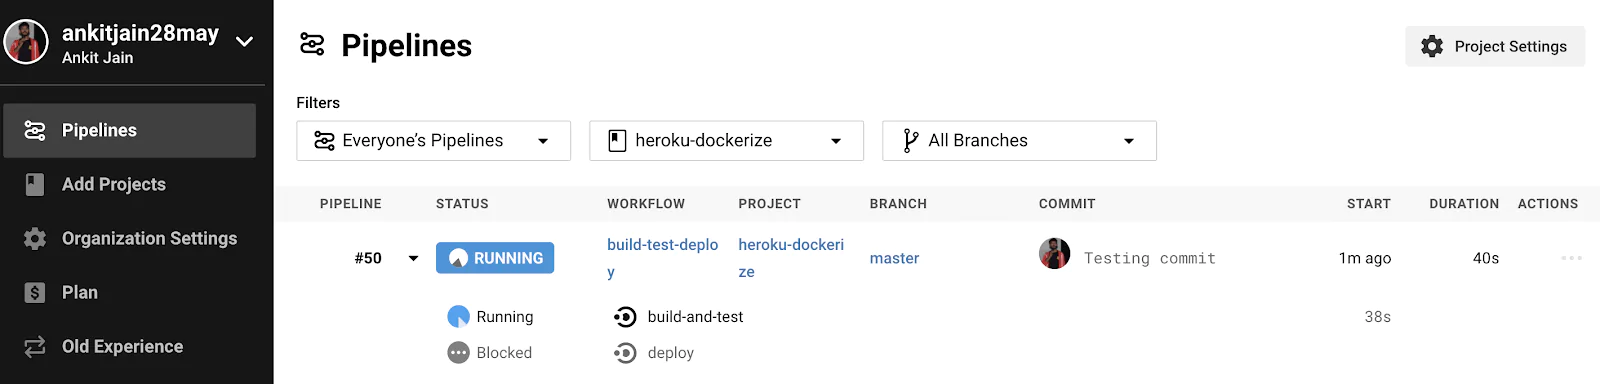
As we can see that it has skipped the CD pipeline (deploy) and only ran the CI pipeline (build-and-test). This is because we have defined that CD will run only for the master branch once the CI pipeline runs successfully. You can check the PR here #3
Conclusion
In this post, we first understand how we can dockerize our application and set up our local development environment using docker-compose. Further, we learned about the Heroku Container Runtime and how we can use it to automate the process of deploying our containerized applications to Heroku by using the Continuous Integration & Deployment pipeline. It will eventually increase the productivity of developers and help the teams to deploy their projects easily.
The code is available in this Github repo. The repo also contains the integration with Travis CI under `.travis.yml` file if anyone is willing to integrate it with Travis.