The new standard of observability is here. Discover Olly, the industry’s first
In this guide, we’ll cover how you can use Morgan npm to log requests and other aspects of your web application built on Express (or any of the similarly architected frameworks around).
So what can Morgan do for you?
- It provides flexibility in defining the format of log messages
- It allows you to overwrite the output destination for your logs
And when would you need it? As you’ll see in a second if you’re working with Express or a similar framework (such as restify) you’ll have the need to log incoming information about the requests, this framework was designed specifically for that, just keep reading.
Given the way Morgan npm works, which I’ll be covering in a second, it’s important to understand how the middleware pattern is used in Express.
Essentially the middleware pattern can be thought of as a list of handler functions, each calling the next one in line once they’ve completed their task. Express uses this list to pre-process the requests received with whatever logic you want to add to your application. Examples include authentication validations, request structure validation (e.g. does the request have all the required parameters?), adding extra attributes, and many more.
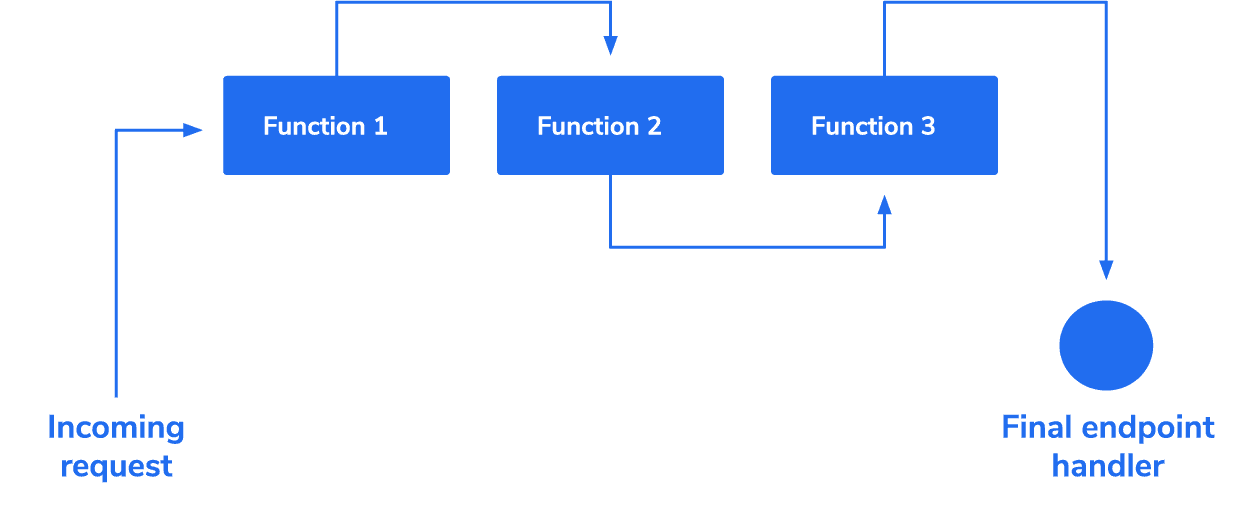
In essence, every function you add to the list will be called with the request object, the response object in case that function needs to stop the regular flow and a callback function to ensure the next function in line gets called. As you’re about to see, Morgan npm provides exactly this; a middleware function that will pick up the request object and log whatever you need, like information such as the method used, the origin IP, the requested URL, etc.
Getting Started with Morgan npm
This is not a hard module to use, it doesn’t provide that many features nor configuration options, however, it does one thing and does it very well. It provides you with a middleware function for any framework (Express or otherwise) that supports that pattern.
In order to install Morgan, just type in your terminal window:
$ npm install morgan --save
And here’s how to add it to your project:
const express = require('express')
const morgan = require('morgan')

const app = express()
const port = 8080

app.use(morgan('combined'))

app.get('/', function (req, res) {
  res.send('hello, world!')
})

app.listen(port, () => console.log(`Example app listening at https://localhost:${port}`))
The above code shows you how easy it is to use Morgan, just require it and add it as a middleware with the use method.
That is all you need to get you logging, in fact, the above code outputs the following line on every request:
::1 - - [26/Apr/2020:16:58:09 +0000] "GET / HTTP/1.1" 200 13 "-" "Mozilla/5.0 (Macintosh; Intel Mac OS X 10_14_6) AppleWebKit/537.36 (KHTML, like Gecko) Chrome/81.0.4044.122 Safari/537.36"
Notice how there is barely any configuration given to Morgan, it was designed to have some very useful defaults. The fact is, this module will not let you do very much other than customize its output and the target destination for the logs (in a similar fashion to how Winston would let you do it).
Formatting Log Output with Morgan npm
One of the most versatile features of Morgan is that you can customize the logs to include exactly the information you need. There are two ways for you to format your logs:
- Pre-defined formats: In other words, the module already provides you with a simple pre-configured set of items to log, you just need to pick the combination that suits your needs.
- Manually by using tokens: And if the pre-defined ones aren’t enough, you can easily create new ones.
Predefined log formats
Like in the example above, you have five predefined formats that you can use in order to easily get the info you need. They are:
- “combined”: which gives you the Apache standard combined format for your logs.
- “common”: referencing the Apache standard common format.
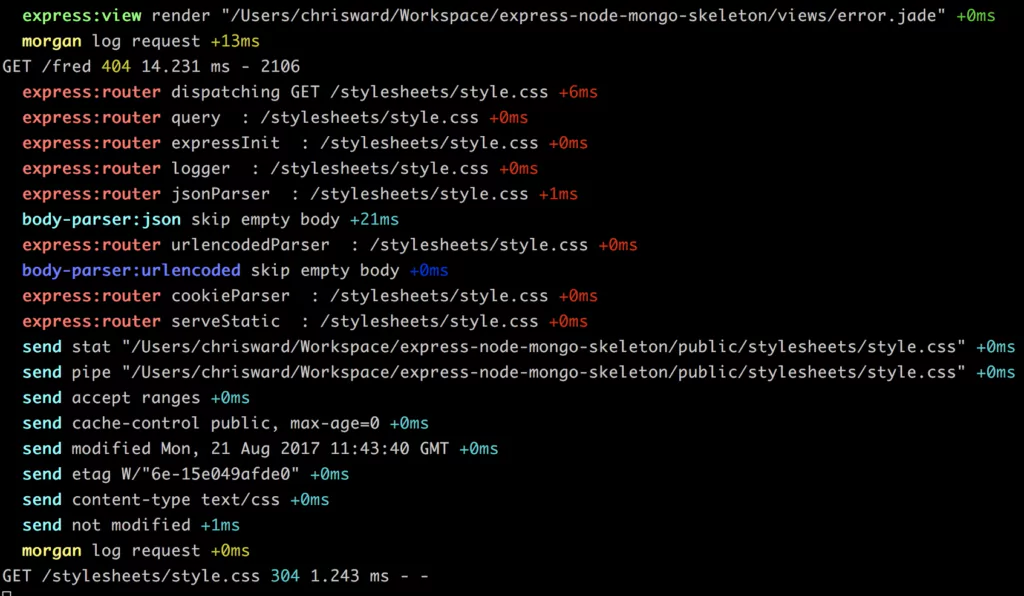
- “dev”: A color-coded (by request status) log format.
- “short”: Shorter than the default format, including just the few items you’d expect a request logline would have.
- “tiny”: Even shorter, just the response time and a few extra items.
Getting back to the example above, here is how the module logs the same request using different formats:
Output of ‘Combined’ format:
::1 - - [26/Apr/2020:16:58:09 +0000] "GET / HTTP/1.1" 200 13 "-" "Mozilla/5.0 (Macintosh; Intel Mac OS X 10_14_6) AppleWebKit/537.36 (KHTML, like Gecko) Chrome/81.0.4044.122 Safari/537.36"
Output of ‘Dev’ format:
::1 - GET / HTTP/1.1 304 - - 5.679 ms
Output of ‘Tiny’ format:
GET / 304 - - 3.356 ms
These are very well formatted and if you don’t really have any special restrictions then they’ll be more than enough. But if you require more granular control over the format of your loglines (i.e by adding extra information not easily available, or even formatting them in a more human-readable format), you can add the information you need by using tokens.
Log Tokens
The tokens are simple placeholders you can add to a format string for the middleware. This is basically, what the predefined formats are doing, but you can mix and match over 13 different tokens and get the exact log line you need.
Morgan npm provides you with tokens such as the user agent of the client, the requested url, the response time and more. Check the full documentation to get the complete list of tokens.
Once you’ve decided, you can simply do the following to create your custom format:
//Create a new named format
morgan.token("custom", ":http-version (:method) :url => :status")
//use the new format by name
app.use(morgan(‘custom’))
Using this code in the original example, we would expect to get the HTTP Version, the HTTP method used, the URL requested, and finally, the status returned by the server. Here is what this looks like:
1.1 (GET) / => 304
Some tokens, like :total-time, accept arguments as a normal function would. These arguments can be used to either modify its default behavior or to specify exactly what type of information we need.
Here is how you can create a custom log format, using parameters for one of the tokens:
morgan.token("timed", "A new :method request for :url was received. " +"It took :total-time[2] milliseconds to be resolved")
And the output from that format:
A new GET request for /api/books/5524 was received. It took 5.47 milliseconds to be resolved
Now, what if these predefined tokens aren’t enough? For example, what if you need to add a particular custom header or a piece of information that you’d query from the database? Well, you can use the same method, but instead of passing a string, you can provide a function and add as much logic into it as you need.
For example, directly adding a token for a particular header would look like this:
morgan.token("host", function(req, res) {
    return req.headers['host']
})
And what if you wanted to return it in JSON format?
morgan.token("json", function(req, res) {
    return JSON.stringify({
   	 url: req.url,
   	 method: req.method,
   	 httpVersion: req.httpVersion
    })
})
Remember to call the stringify method, since the token needs to be a string. The output of a token like this looks like:
{"url":"/","method":"GET","httpVersion":"1.1"}
Redirecting the Log Output
So far, we haven’t mentioned anything about the output location for the logs, but by default, the standard output (normally your terminal window) is where the logs are written. Given that distributed architectures are pretty much the norm right now, logging into the standard output is not that beneficial. In fact, that pretty much compares to using console.log instead of Morgan. So what’s the deal?
Fortunately, Morgan npm allows you to overwrite the output destination for your logs, by overwriting the stream used to write them. This, however, will require you to understand at least the basics of how Streams in Node.js work, after all, this is not just about specifying a destination path, but rather, writing the whole output routine.
In order to do that, the middleware function returned by the module accepts an optional, second parameter, where you can specify the stream to use.
The following is an example of how you can redirect the logger’s output to a single file by creating a new Stream object and passing it to the middleware:
/*
* We first need to create a write stream, in append mode, so we don’t overwrite the old logs everytime we write  a new one.
*/
let logStream = fs.createWriteStream(path.join(_dirname, ‘file.log’), {flags: ‘a’})
// setup the logger
app.use(morgan(‘update’, { stream: logStream }))
Although a bit low-level, the approach of giving you direct access to the output stream gives developers a great amount of flexibility. You may or may not be familiar with the Stream object in Node.js, but it’s a standard interface that any module out there using it will have to implement, in other words, everyone uses streams in the same way, so you can be assured, it’ll work for your needs.
And to prove that point, the following example shows you how to use a stream-compatible module and use it with the logger:
const express = require('express')
const morgan = require('morgan')
const rt = require("file-stream-rotator")

const app = express()
const port = 8080

//Create a new named format
morgan.token("timed", "A new :method request for :url was received. " +
   				   "It took :total-time[2] milliseconds to be resolved")

let writer = rt.getStream({filename:"test.log", frequency:"daily", verbose: true});


//use the new format by name
app.use(morgan('timed', { stream: writer }))

app.get('/', function (req, res) {
  res.send('hello, world!')
})

app.listen(port, () => console.log(`Example app listening at https://localhost:${port}`))
As you can see, the example above uses one of the predefined tokens that we used earlier, but now, instead of logging into the terminal window, we’re using the file-stream-rotator module, which takes care of writing into a single file and rotating it once a particular condition is met. In our example, the log files will be rotated on a daily basis.
There are modules already out there that provide stream-compatible interfaces to known storages, such as Mongoose-Morgan which allows you to stream your Mongoose logs directly into MongoDB. However, if you can’t find a morgan-compatible module, you can simply write a function that returns a writable stream and sends the information where you need it.
The following example shows you how easy it is to create a writable stream that can work with Morgan:
const express = require('express')
const morgan = require('morgan')
const Writable = require("stream").Writable

const app = express()
const port = 8080

class MyStream extends Writable {
    write(line) {
   	 //here you send the log line to wherever you need
   	 console.log("Logger:: ", line)
    }
}

//Create a new named format
morgan.token("timed", "A new :method request for :url was received. " +
   				   "It took :total-time[2] milliseconds to be resolved")

let writer = new MyStream()

//use the new format by name
app.use(morgan('timed', { stream: writer }))

app.get('/', function (req, res) {
  res.send('hello, world!')
})

app.listen(port, () => console.log(`Example app listening at https://localhost:${port}`))
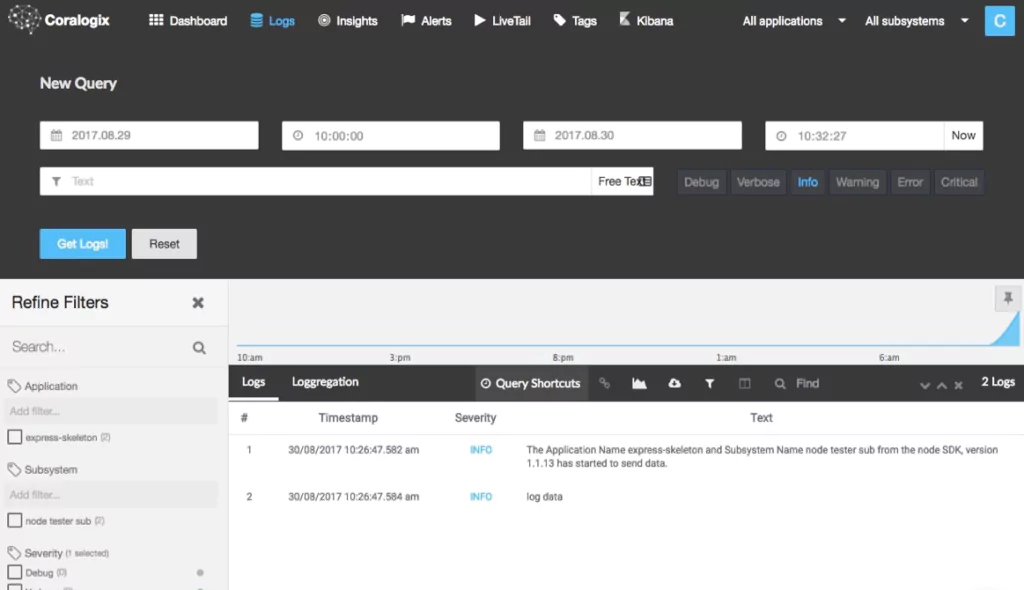
Granted, the above code only sends the data into the terminal window, which is what Morgan npm does by default, but you get the point. Instead of that console.log you can write your S3 compatible code, or your HTTP request to send the log to a fully managed ELK instance. These are all valid and viable options thanks to the access the module provides you to the stream.
Logging into multiple destinations with skip
Finally, a nice little trick is the skip option – another property of the optional second argument. With it, you can define a function to tell the logger which events to ignore and which ones to actually log. Although the following example focuses on one use case, another example would be having a higher level of verbosity on development environments versus only logging truly critical information on production environments.
The following code sample shows how to use the skip property:
const express = require('express')
const morgan = require('morgan')

const app = express()
const port = 8080


// Skip requests that aren't for the homepage
function onlyHomeRequests(req, res) {
    return req.url != "/"
}

app.use(morgan('combined', {
    skip: onlyHomeRequests
}))

app.get('/', function (req, res) {
  res.send('homepage!')
})

app.get('/hello', function (req, res) {
  res.send('hello, world!')
})

app.listen(port, () => console.log(`Example app listening at https://localhost:${port}`))
It’s pretty straightforward, the function receives both the request and the response objects for you to use that information to decide whether or not to skip the request and not log it. If the function returns TRUE, then the event will be skipped, otherwise, the logger will take care of it.
By itself, it doesn’t really provide that much help, however, if you start adding several loggers and different skipping rules, then you can manage to write logic that sends log lines to different places based on your needs.
The following code shows you how to use pretty much everything we’ve covered so far to create a logging logic using Morgan that will save information about failed requests into a file, while, at the same time, writing information about the successful ones to the terminal window.
const express = require('express')
const morgan = require('morgan')

const rt = require("file-stream-rotator")
const Writable = require("stream").Writable

const app = express()
const port = 8080

class TerminalStream extends Writable {
    write(line) {
   	 //here you send the log line to wherever you need
   	 console.log("Logger:: ", line)
    }
}

let fileWriter = rt.getStream({filename:"errors.log", frequency:"daily", verbose: true});
let terminalWriter = new TerminalStream()

// Skip requests that aren't for the homepage
const skipSuccess = (req, res)  => res.statusCode < 400; const skipError = (req, res) => res.statusCode >= 400;

//error logging
app.use(morgan('combined', {
    skip: skipSuccess,
    stream: fileWriter
}))

//success logging
app.use(morgan('combined', {
    skip: skipError,
    stream: terminalWriter
}))

app.get('/', function (req, res) {
  res.send('homepage!')
})

app.get('/hello', function (req, res) {
  res.send('hello, world!')
})

app.listen(port, () => console.log(`Example app listening at https://localhost:${port}`))
The key here is the skip logic, which allows us to split the data flow into two different middleware loggers, based (in this case) on the status code returned. In the next part of the code, the two streams specify where to save the output of each logger and the format. In this example, it’s the same for both scenarios, but you could use custom formats for each case easily
How does it fit in with other loggers?
While there are many loggers available for Node.js developers, such as Winston and Log4JS, most of them are generic solutions, meant to be used from anywhere in your code. And that is great, don’t get me wrong, they provide a great level of configuration and customization. You can also use them to create your own Express-compatible middlewares and use them to your HTTP requests.
The way Morgan npm is unique here is that it’s one of the few (if not the only module) to only focus on middleware-compatible architectures to simplify the task of logging incoming requests. And it does so very well if I say so myself. Just with a few lines of code, you’re able to get it working and provide useful information. And if you want to customize it, only a few more lines are enough.
Usually, you’d pick one logger module and go with it for your entire application, but because of the unique use case that Morgan tackles, it’s not a crazy idea to mix things up and have another logger in your toolbox.
Conclusion
Morgan is a very simple logger since it doesn’t really provide that many options or features, but that is exactly why it’s so flexible. Because of the way it was designed, it gives you the basic building blocks to create your own logger (or loggers) to suit your middleware requirements.
The only restriction you need to consider when choosing Morgan npm is that you’ll only be using it for request logging on your Express middleware flow as opposed to other, more generic loggers like Winston, which can be used anywhere in your code and your logic. Mind you, adding logging logic to it is necessary if you want to understand what happens to your application and what kind of requests you’re getting, so don’t underestimate this module.