More Changes Mean More Challenges for Troubleshooting

The widespread adoption of Agile methodologies in recent years has allowed organizations to significantly increase their ability to push out more high quality software. The new fast-paced CI/CD solutions pipeline and lightweight microservices architecture enable us to introduce new updates at a rate and scale that would have seemed unimaginable just a few years ago.

Previous development practices revolved heavily around centralized applications and infrequent updates that were shipped maybe once a quarter or even once a year. 

But with the benefits of new technologies comes a new set of challenges that need to be addressed as well. 

While the tools for creating and deploying software have improved significantly, we are still in the process of establishing a more efficient approach to troubleshooting. 

This post takes a look at the tools that are currently available for helping teams keep their software functioning as intended, the challenges that they face with advances in the field, and a new way forward that will speed up the troubleshooting process for everyone involved.

Challenges Facing Troubleshooters 

On the face of it, the ability to make more software is a positive mark in the ledger. But with new abilities come new issues to solve. 

Let’s take a look at three of the most common challenges facing organizations right now.

The Move from the Monolith to Microservices 

Our first challenge is that there are now more moving parts where issues may arise that can complicate efforts to fix them quickly and efficiently. 

Since making the move to microservices and Kubernetes, we are now dealing with a much more distributed set of environments. We have replaced the “monolith” of the single core app with many smaller, more agile but dispersed apps. 

Their high level of distribution makes it more difficult to quickly track down where a change occurred and understand what’s impacting what. As the elements of our apps become more siloed, we lose overall visibility over the system structure.

Teams are Becoming More Siloed

The next challenge is that with more widely distributed teams taking part in the software development process, there are much fewer people who are significantly familiar with the environment when it comes to addressing problems impacting the products. 

Each team is proficient in their own domain and segment of the product, but are essentially siloed off from the other groups. This leads to a lack of knowledge sharing across teams that can be highly detrimental when it comes time for someone to get called in to fix an issue stemming from another team’s part of the product. 

More Changes, More Often

Then finally for our current review, is the fact that changes are happening far more often than before. 

Patches no longer have to wait until it’s Tuesday to come out. New features on the app or adjustments to infrastructure like load balancing can impact the product and require a fix. With all this going on, it is easy for others to not be aware of these changes.

The lack of communication caused by siloes combined with the increase in the number of changes can create confusion when issues arise. Sort of like finding a specific needle in a pile of needles. It’s enough to make you miss the haystack metaphor. 

In Search of Context

In examining these challenges, we can quickly understand that they all center around the reality that those tasked with troubleshooting issues lack the needed context for fixing them. 

Developers, who are increasingly being called upon to troubleshoot, lack the knowledge of what has changed, by who, what it impacts, or even where to start looking in a potentially unfamiliar environment.

Having made the move to the cloud, developers have at their disposal a wide range of monitoring and observability tools covering needs related to tracing, logs, databases, alerting, security, and topology, providing them with greater visibility into their software throughout the Software Development Lifecycle.

When they get the call that something needs their attention, they often have to begin investigating essentially from scratch. This means jumping into their many tools and dashboards, pouring over logs to try and figure out the source of the problem. While these monitoring and observability tools can provide valuable insights, it can still be difficult to identify which changes impacted which other components.

Some organizations attempt to use communication tools like Slack to track changes. While we love the scroll as much as anyone else, it is far from a comprehensive solution and still lacks the connection between source and impact. Chances are that they will need to call in for additional help in tracking down the root of the problem from someone else on their team or a different team altogether.

In both cases, the person on-call still needs to spend significant and valuable time on connecting the dots between changes and issues. Time that might be better spent on actually fixing the problem and getting the product back online.  

Filling in the Missing Part of the DevOps Toolchain

The tooling available to help identify issues are getting much better at providing visibility, including to provide on-call responders with the context that will help them get to the source of the problem faster. 

Moving forward, we want to see developers gain a better, holistic understanding of their Kubernetes environments. So even if their microservices are highly distributed, their visibility over them should be more unified. 

Fixing problems faster means getting the relevant information into the hands of whoever is called up to address the issue. It should not matter if the incident is in a product that they themselves built or if they are opening it up for the first time. 

Reducing the MTTR relies on providing them with the necessary context from the tools that they are already using to monitor their environment. Hopefully by better utilizing our existing resources, we can cut down on the time and number of people required to fix issues when they pop up — allowing us to get back to actually building better products.

Key Differences Between Observability and Monitoring – And Why You Need Both

Monitoring is asking your system questions about its current state. Usually these are performance related, and there are many open source enterprise monitoring tools available. Many of those available are also specialized. There are tools specifically catering to application monitoring, cloud monitoring, container monitoring, network infrastructure… the list is endless, regardless of the languages and tools in your stack.

Observability is taking the data from your monitoring stack and using it to ask new questions of your system. Examples include finding and highlighting key problem areas or identifying parts of your system that can be optimized. A system performance management stack built with observability as a focus enables you to then apply the answers to those questions in the form of a refined monitoring stack.

Observability and Monitoring are viewed by many as interchangeable terms. This is not the case. While they are interlinked, they are not interchangeable. There are actually very clear and defined differences between them.

Why You Need Both Observability and Monitoring

You can see why Observability and Monitoring are so often grouped together. When done properly, your Observability and Monitoring stacks will operate in a fluid cycle. Your Monitoring stack provides you with detailed system data, your Observability stack turns these analytics into insights, those insights are in turn applied to your Monitoring stack to enable it to produce better data.

What you gain from this process is straightforward – visibility.

System visibility in any kind of modern software development is absolutely vital. With development life-cycles becoming evermore defined by CI/CD, containerization, and complex architectures like microservices, contemporary engineers are tasked with keeping watch over an unprecedented amount of sources for potential error.

The best Observability tools in the world can provide little to no useful analysis if they’re not being fed by data from a solid Monitoring stack. Conversely, a Monitoring stack does little but clog up your data storage with endless streams of metrics if there’s no Observability tooling present to collect and refine the data.

It is only by combining the two that system visibility reaches a level which can provide a quick picture of where your system is and where it could be. You need this dual perspective, too, as in today’s forever advancing technical landscape no system is the same for long.

More Progress, More Problems

Without strong Observability and Monitoring, you could be only 1-2 configurations or updates away from a system-wide outage. This only becomes more true as your system expands and new processes are implemented. Growth brings progress, and in turn, progress brings further growth.

From a business perspective this is what you want. If your task is to keep the tech your business relies on running smoothly, however, growth and progress mean more systems and services to oversee. They also mean change. Not only will there be more to observe and monitor, but it will be continually different. The stack your enterprise relies on in the beginning will be radically different five years into operation.

Understanding where monitoring and observability differ is essential if you don’t want exponential growth and change to cause huge problems in the future of your development life-cycle or BAU operations.

Only through an established and healthy monitoring practice can your observability tools provide the insights needed to preempt how impending changes and implementations will affect the overall system. Conversely, only with solid observability tooling can you ensure the metrics you’re tracking are relevant to the current state of the system infrastructure.

A Lesson From History

Consider the advent of commercially available cloud computing and virtual networks. Moving over to Azure or AWS brought many obvious benefits. However, for some, it also brought a lot of hurdles and headaches.

Why?

Their Observability and Monitoring stacks were flawed. Some weren’t monitoring those parts of their system which would be put under strain from the sudden spike in internet usage, or were still relying on Monitoring stacks built at a time when most activity happened on external servers. Others refashioned their monitoring stacks accordingly but, due to lack of Observability tools, had little-to-no visibility over parts of their system that extended into the cloud.

Continuous Monitoring/Continuous Observability

DevOps methodology has spread rapidly over the last decade. As such, the implementation of CI/CD pipelines has become synonymous with growth and scaling. There are many advantages of Continuous Implementation/Continuous Development, but at their core, CI/CD pipelines are favored because they enable a rapid release approach to development.

Rapid release is great from a business perspective. It allows the creation of more products, faster, which can be updated and re-released with little-to-no disruption to performance. On the technical side, this means constant changes. If a CI/CD pipeline process isn’t correctly monitored and observed then it can’t be controlled. All of these changes need to be tracked, and their implications on the wider system need to be fully understood.

Rapid Release – Don’t Run With Your Eyes Shut

There are plenty of continuous monitoring/observability solutions on the market. Investing in specific tooling for this purpose in a CI/CD environment is highly recommended. In complex modern development, Observability and Monitoring mean more than simply tracking APM metrics.

Metrics such as how many builds are run, and how frequently, must be tracked. Vulnerability becomes a higher priority as more components equal more weak points. The pace at which vulnerability-creating faults are detected must keep up with the rapid deployment of new components and code. Preemptive alerting and real-time traceability become essential, as your development life-cycle inevitably becomes tied to the health of your CI/CD pipeline.

These are just a few examples of Observability and Monitoring challenges that a high-frequency CI/CD environment can create. The ones which are relevant to you will entirely depend on your specific project. These can only be revealed if both your Observability and Monitoring stacks are strong. Only then will you have the visibility to freely interrogate your system at a speed that keeps up with quick-fire changes that rapid-release models like CI/CD bring.

Back to Basics

Complex system architectures like cloud-based microservices are now common practice, and rapid release automated CI/CD pipelines are near industry standards. With that, it’s easy to overcomplicate your life cycle. Your Observability and Monitoring stack should be the foundation of simplicity that ensures this complexity doesn’t plunge your system into chaos.

As much as there is much to consider, it doesn’t have to be complicated. Stick to the fundamental principles. Whatever shape your infrastructure takes, as long as you are able to maintain visibility and interrogate your system at any stage in development or operation you’ll be able to reduce outages and predict the challenges any changes bring.

The specifics of how this is implemented may be complex. The goal, the reason you’re implementing them, is not. You’re ensuring you don’t fall behind change and complexity by creating means to take a step back and gain perspective.

Observability and Monitoring – Which Do You Need To Work On?

As you can see, Observability and Monitoring both need to be considered individually. While they work in tandem, each has a specific function. If the function of one is substandard, the other will suffer.

To summarize, monitoring is the process of harvesting quantitative data from your system. This data will take the form of many different metrics (query, error, processing, events, traces etc). Monitoring is asking questions of your system. If you know what it is you want to know, but your data isn’t providing the answer from your system, your Monitoring stack that needs work.

Observability is the process of transforming collected data into analysis and insight. It is the process of using existing data to discover and inform what changes may be needed and which metrics should be tracked in the future. If you are unsure what it is you should be asking when interrogating your system, Observability should be your focus.

Remember, as with all technology, there is never a ‘job done’ moment when it comes to Observability and Monitoring. It is a continuous process, and your stacks, tools, platforms, and systems relating to both should be constantly evolving and changing. This piece lists but a few of the factors software companies of all sizes should be considering during the development life-cycle.

Force Multiply Your Observability Stack with a Platform Thinking Strategy

Platform thinking is a term that has spread throughout the business and technology ecosystem. But what is platform thinking, and how can a platform strategy force multiply the observability capabilities of your team?

Platform thinking is an evolution from the traditional pipeline model. In this model, we have the provider/producer at one end and the consumer at the other, with value traveling in one direction. Platform thinking turns this on its head, allowing groups to derive value from each other regardless of whether they are the users or creators of the product.

In this article, we will unpack what platform thinking is, how it fits into the world of software engineering, and the ways in which using platform thinking can revolutionize the value of any observability stack.

Platform Thinking – A Simple Explanation

Traditionally, value is sent from the producer to the consumer and takes the form of the utility or benefit gained upon engagement with whatever the product/service happens to be in each case. Financial value obviously then travels back up the pipeline to the owner of said product/service, but this isn’t the kind of value we’re concerned with here.

It should go without saying that any successful change to a business model (be it technological or organizational) should lead to an increase in financial value. Otherwise, what would be the point in implementing it?

Platform thinking is certainly no exception to the end goal being profit, but the value we’re discussing here is a little more intangible. When we say ‘value’ we are referring to the means by which financial ends are achieved, rather than the ends themselves.

So How Does Platform Thinking Apply to Engineering?

The above explanation obviously makes a lot of sense if your curiosity about platform thinking stems from financial or business concerns. However, that’s probably not why you’re reading this. You want to know how platform thinking can be applied to your technical operations. 

It’s great that platform thinking could generate more revenue for your company or employer, but in your mind this is more of a convenient by-product of your main aim. You’ll be pleased to hear that the benefits of implementing a platform thinking approach to your operational processes will be felt by your engineers and analysts before they’re noticed by the company accountant. 

As we covered in the previous section, the value added by platform thinking comes in the enabling of collaboration and free movement of value between groups on the platform. Financial value then comes from the inevitable increase in productivity and quality of delivery that results.

Platform Thinking in a Technical Context

A technical ecosystem founded on platform thinking principles means that everybody involved, be they an individual engineer or an entire development team, has access to a shared stack that has been built upon by everybody else. 

Engineers work and build on a foundation of shared tooling which is continuously being honed and refined by their peers and colleagues. Anybody joining enters with access to a pre-built toolbox containing tools already tailored to suit the unique needs of the project. 

The productivity implications of this should go without saying, but they’re astronomical. Any engineer will be able to tell you that they spend a disproportionately large amount of their time on configuring and implementing tooling. Platform thinking can significantly reduce, or even remove entirely, the time spent on these activities.  

Observability- Why It’s Useful

Observability and monitoring are essential components of any technical ecosystem. Be it project-based development or BAU operations and system administration, a healthy observability stack is often the only thing between successful delivery and system wide outage. 

A well-executed observability solution prevents bottlenecks, preempts errors and bugs, and provides you with the visibility needed to ensure everything works as it should. Without observability being a high priority, troubleshooting and endless investigations of the logs to find the origin of errors will define your development lifecycle.

In our highly competitive technology market, the speed and efficiency observability enables can often be the difference between success and failure. Understandably your observability stack is something you’ll want to get right.

Freeing Yourself From Unicorns 

Here’s the thing – not everybody is an observability mastermind. The front-end JavaScript developer you hired to work on the UI of your app isn’t going to have the same level of observability knowledge as your back-end engineers or systems architects. It’s going to take them longer to implement observability tooling, as it’s not their natural forte. 

Rather than attempting to replace your front-end UI dev with a unicorn who understands both aesthetic design and systems functionality, you could instead implement a platform thinking strategy for your observability stack. 

Shared Strength & Relieved Pressure

In any project or team, the most skilled or experienced members often struggle to avoid becoming the primary resource upon which success rests. Engineers enjoy a challenge, and it’s not uncommon to find that the ambitious ones take more and more under their belt if it means a chance to get some more time with a new tool, language, or system.

This is a great quality, and one that should be applauded. However, it also means that when your superstar engineer is out for vacation or leaves for new horizons, the hole they leave behind can be catastrophic. This is especially true when the skills and knowledge they take with them are intrinsically linked to the functionality of your systems and processes.

By implementing a platform thinking approach your investment in your observability stack transforms it into a platform of functionality and centralized knowledge which all engineers involved can tap into. Not only does this reduce pressure on your strongest team members, it also means if they leave you don’t have to find a fabled unicorn to replace them.

A Platform Observability Approach

A platform thinking approach to the observability of your ecosystem enables every developer, engineer, analyst, and architect to contribute to and benefit from your observability stack.

Every participant will have access to pre-implemented tooling which is ready to integrate with their contributions. What’s more, when new technology is introduced, their deployment and configurations will be accessible so that others can implement the same without a substantial time investment.

This in turn significantly increases the productivity of everyone in your ecosystem. The front-end UI developers will be free to focus on front-end UI development. Your systems engineers and analysts can focus on new and creative ways to optimize instead of fixing errors caused by ineffective tracing or logging.

In short, a collectively owned observability platform enables everyone to focus on what they’re best at.

Force Multiplied Observability

The aggregate time saved and pooling of both resources and expertise will have benefits felt by everyone involved. From a system-wide perspective, it will also close up those blind spots caused by poor or inconsistent implementation of observability tools and solutions.  

You can loosely measure the efficacy of your observability stack by how often outages, bottlenecks, or major errors occur. If your observability stack is producing the intended results, then these will be few and far between. 

With a platform thinking strategy the efficacy of your observability stack is multiplied as many times as there are active participants. Every single contributor is also a beneficiary, and each one increases the range and strength of your stack’s system-wide visibility and effectiveness. Each new participant brings new improvements.

By creating your observability process with a platform thinking led approach you’ll find yourself in possession of a highly efficacious observability stack. Everybody in your ecosystem will benefit from access to the tools it contains, and productivity of your technical teams will leap to levels it has never seen before. 

Scale Your Prometheus Metrics Indefinitely with Thanos

Prometheus metrics are an essential part of your observability stack. Observability comes hand in hand with monitoring, and is covered extensively here in this Essential Observability Techniques article. A well-monitored application with flexible logging frameworks can pay enormous dividends over a long period of sustained growth, but Prometheus has a problem when it comes to scale.

Prometheus Metrics at Scale

Prometheus is an extremely popular choice for collecting and querying real-time metrics primarily due to its simplicity, ease of integration, and powerful visualizations. It’s perfect for small and medium-sized applications, but what about when it comes to scaling? 

Unfortunately, a traditional Prometheus & Kubernetes combo can struggle at scale given its heavy reliance on writing memory to disk. Without specialized knowledge in the matter, configurations for high performance at scale is extremely tough. For example, querying through petabytes of historical data with any degree of speed will prove to be extremely challenging with a traditional Prometheus setup as it relies heavily on read/write disk operations.

So how do you scale your Prometheus Metrics?

This is where Thanos comes to the rescue. In this article, we will be expanding upon what Thanos is, and how it can give us a helping hand and allow us to scale using Prometheus without the memory headache. Lastly, we will be running through a few great usages of Thanos and how effective it is using real world examples as references.

Thanos

Thanos, simply put, is a “highly available Prometheus setup with long-term storage capabilities”. The word “Thanos” comes from the Greek “Athanasios”, meaning immortal in English. True to its name, Thanos features object storage for an unlimited time and is heavily compatible with Prometheus and other tools that support it such as grafana.

Thanos allows you to aggregate data from multiple Prometheus instances and query them, all from a single endpoint. Thanos also automatically deals with duplicate metrics that may arise from multiple Prometheus instances.

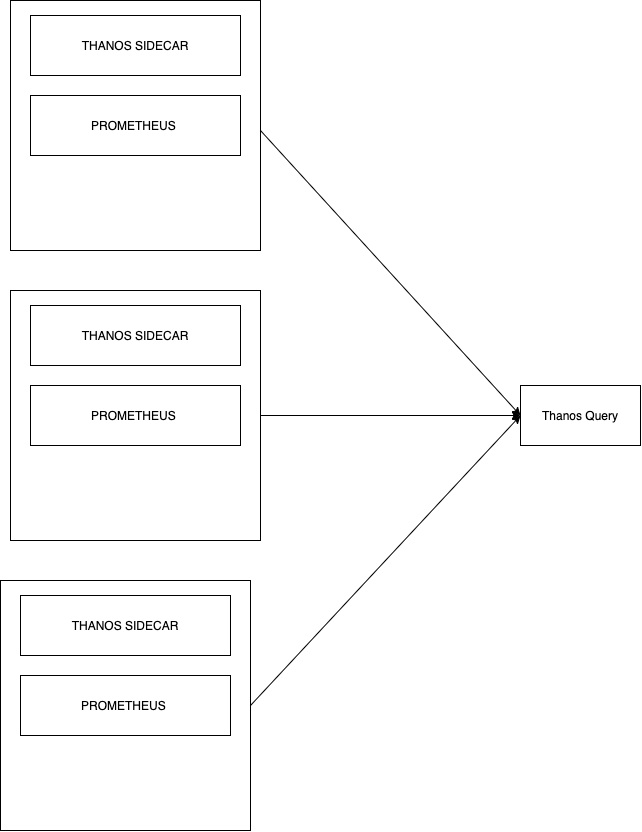
Let’s say we were running multiple prometheus instances, and wanted to use Thanos to our advantage. We will take a look at the relationship between these two components and then delve into more technical details.

how prometheus metrics are queried across multiple prometheus instances using thanos

Storage

The first step to solving memory woes using Thanos is its Sidecar component, as it allows seamless uploading of metrics as object storage on your typical providers (S3, Swift, Azure etc). It employs the use of the StoreAPI as an API gateway, and only uses a small amount of disk space to keep track of remote blocks and keep them in sync. The StoreAPI is a gRPC that uses SSL/TLS authentication, and therefore standard HTTP operations are converted into gRPC format. Information on this can be found here.

Thanos also features Time Based Partitioning which allows you to set flags that query metrics from certain timeframes within the Store Gateway. For example: --min-time=-6w would be used as a flag to filter data older than 6 weeks.

Additionally, Thanos has an Index Cache and implements the use of a Caching Bucket – certainly powerful features that allow you to safely transition from a read/write dependency to seamless cloud storage. These latency performance boosters are essential when scaling – every ms counts.

The use of the Sidecar is also invaluable in case of an outage. It is key to be able to refer to historical data through the use of backups on the cloud. Using a typical Prometheus setup, you could very well lose important data in case of an outage.

Basic Thanos Query

The basic Thanos setup seen above in the diagram also contains the Thanos Query component, which is responsible for aggregating and deduplicating metrics like briefly mentioned earlier. Similar to storage, Thanos Query also employs the use of an API – namely the Prometheus HTTP API. This allows querying data within a Thanos cluster via PromQL. It intertwines with the previously mentioned StoreAPI by querying underlying objects and returning the result. The Thanos querier is “fully stateless and horizontally scalable”, per its developers.

Scaling Thanos Query

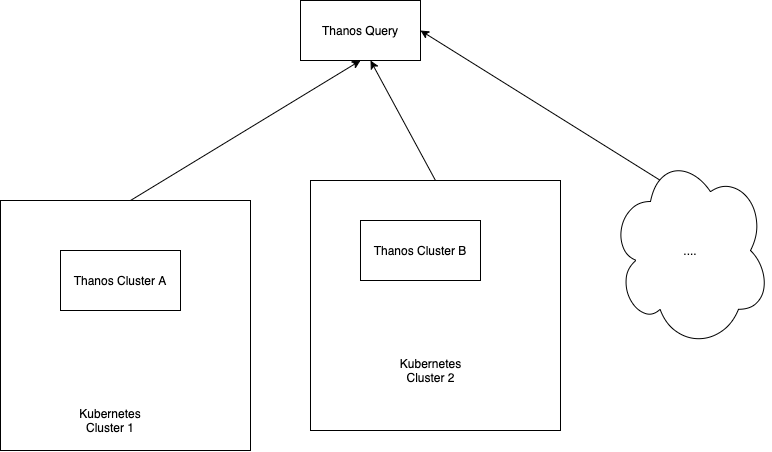
Thanos Query works as an aggregator for multiple sidecar instances, but we could easily find ourselves using multiple Kubernetes clusters, with multiple Prometheus instances. This would mean we would have multiple Thanos Query nodes leading subsets of Sidecar & Prometheus instances. Intuitively, this is a difficult problem to solve. 

The good news is that a Thanos Query node aggregates multiple instances of Thanos Query nodes also! Sounds confusing? It’s actually very simple:

Querying prometheus metrics across clusters using Thanos

It doesn’t matter if your project spans over multiple Kubernetes clusters. Thanos deduplicates metrics automatically. The “head” Thanos Query node takes care of this for us by running high performance deduplication algorithms.

The clear advantage to this type of setup is that we end up with a single node where we can query all of our metrics. But this also has a clear disadvantage – What if our head Thanos Query node goes down? Bye bye metrics?

Luckily there are options to truly nail the Thanos setup over multiple Kubernetes clusters. This fantastic article runs through “Yggdrasil”, an AWS multi-cluster load-balancing tool. It allows you to perform queries against any of your clusters and still access all of your metrics. This is especially important in case of any downtime or service failures. With careful planning, you can cut down data loss to pretty much near 0%.

Availability

It should be clear by now that the sum of all these parts is a Prometheus setup with high availability of data. The use of Thanos Query and Thanos Sidecar significantly facilitate the availability of objects and metrics. Given the convenience of a single metric collection point, alongside unlimited retention of object storage, it’s easy to see why the first four words on the Thanos website are “Highly available Prometheus setup”.

Uses of Thanos for Prometheus Metrics

Nubank

Many large companies are using Thanos to their advantage. Nubank, a Brazilian fintech company that toppled a $10B valuation last year, has seen massive increases to operational efficiency after fitting Thanos, within other tools into their tech stack.

A case study on the company revealed that the Nubank cloud native platform “includes Prometheus, Thanos and Grafana for monitoring”. Although its ultimately impossible to attribute this solely to Thanos, the case study explains how Nubank now deploys “700 times a week” and has “gained about a 30% cost efficiency”. It seems even a very large-scale application can deeply benefit from a hybrid Prometheus+Thanos setup.

GiffGaff

Popular UK mobile network provider GiffGaff also boasts the use of Thanos. In fact, they have been fairly public as to how Thanos fits into their stack and what sort of advantages it has given them.

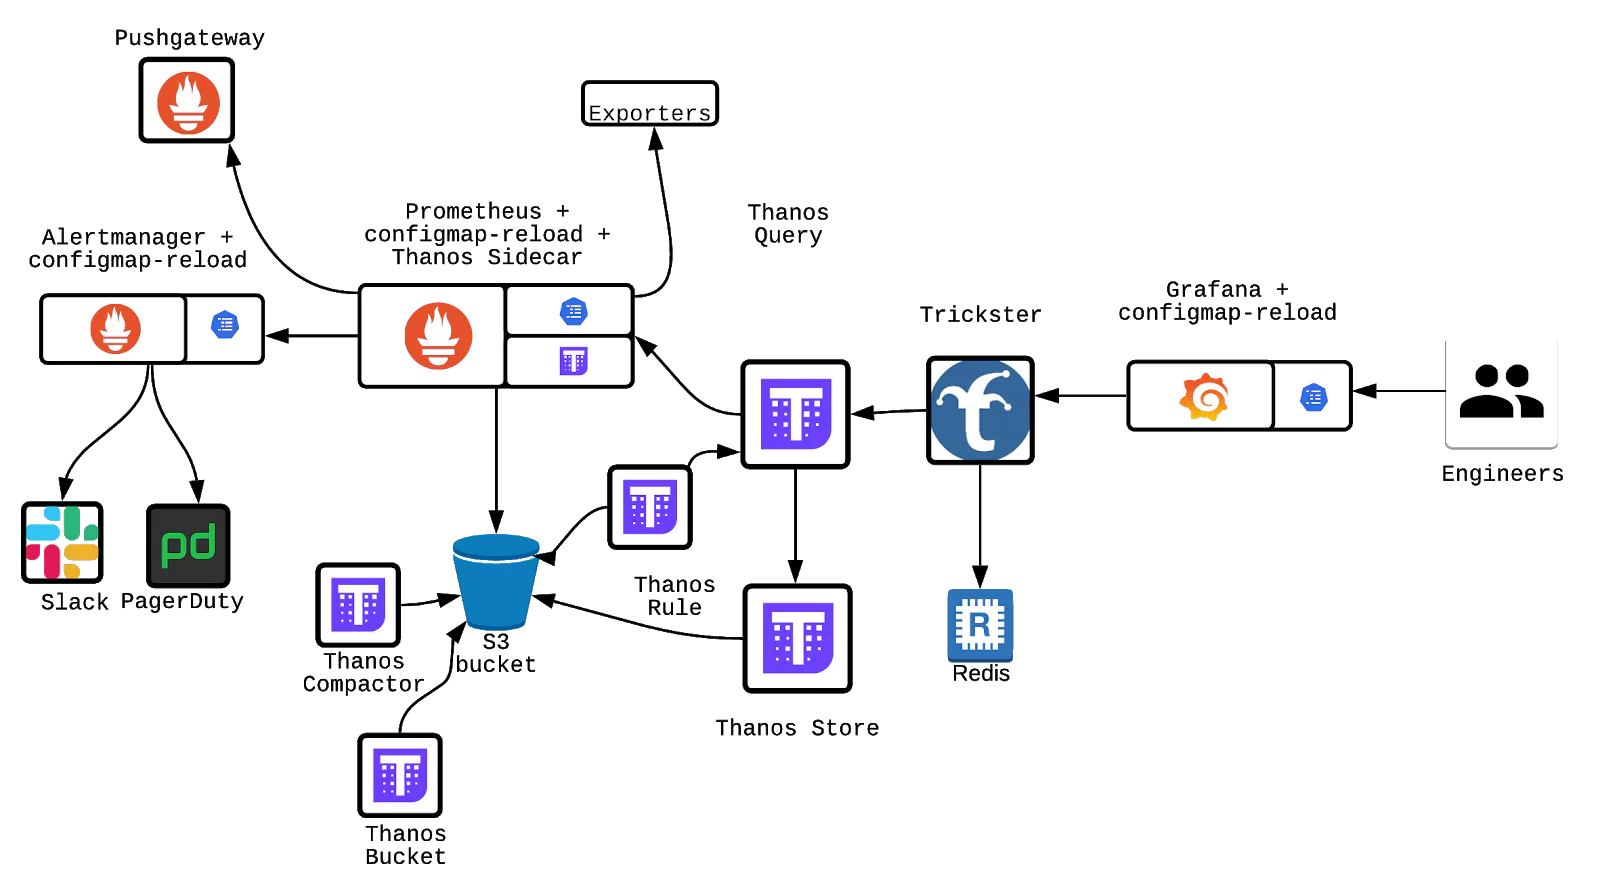
prometheus metrics are Giff Gaff and how they used Thanos to scale

The diagram above shows that the Thanos Store, Thanos Query and Thanos Bucket. They are critical parts of the monitoring data flow. Objects are constantly being synced and uploaded onto an S3 bucket. In comparison to disk operations seen in a normal Prometheus setup, this scales far more and benefits from the reliability of S3. 

Within their post under the “Thanos” section, GiffGaff claims “As long as at least one server is running at a given time, there shouldn’t be data loss.”  This hints at some form of multi-cluster load balancing at the very least.

“… [Thanos] allowed us [GiffGaff] to retain data for very long periods in a cost-efficient way” 

Interestingly, GiffGaff employs the use of the sidecar to upload objects every 2 hours – hedging against any potential prometheus downtime.

GiffGaff uses Thanos Store and allocates time periods for each Thanos Store cluster for storage. This effectively rotates the cluster use, keeping availability and reliability very high. The example given, by GiffGaff themselves is: 

  • now – 2h: Thanos Sidecars
  • 2h – 1 month: Thanos Store 1
  • 1 month – 2 months: Thanos Store 2
  • 2 months – 3 months: Thanos Store 3

We had previously touched upon Thanos downsampling and how it could save you time when querying historical data. In order to implement this, GiffGaff used the Thanos Compactor, “performing 5m downsampling after 40 hours and 1h downsampling after 10 days.” Impressive to say the least.

Conclusion

Now you know what Thanos is, how it interacts with Prometheus and the type of advantages it can give us. In this post, we also ran through some real life examples which should give some insight into how Thanos is used. It should also be clear how the use of Thanos Sidecar and Storage are inherently advantageous when it comes to scaling, in relation to a typical Prometheus setup. 

Apart from storage capabilities, the effectiveness of Thanos Query should also be direct – and how a single metric collection point is a massive blessing but comes with its own responsibilities should you need to balance the load on multiple clusters. 

Lastly, downsampling through the use of the Thanos Compactor seems like a performance no brainer. Large datasets can be easily handled using the downsampling method.

Hopefully you understand Thanos and what it has to offer to make your life easier. If that sounds like a lot of work, Coralogix offers a powerful suite of monitoring tools. 

How to Address the Most Common Microservice Observability Issues

Breaking down larger, monolithic software, services, and applications into microservices have become a standard practice for developers. While this solves many issues, it also creates new ones. Architectures composed of microservices create their own unique challenges. 

In this article, we are going to break down some of the most common. More specifically, we are going to assess how observability-based solutions can overcome many of these obstacles.

Observability vs Monitoring

We don’t need to tell you that monitoring when working with microservices is crucial. This is obvious. Monitoring in any area of IT is the cornerstone of maintaining a healthy, usable system, software, or service.

A common misconception is that observability and monitoring are interchangeable terms. The difference is that while monitoring gives you a great picture of the health of your system, observability takes these findings and provides data with practical applications.

Observability is where monitoring inevitably leads. A good monitoring practice will provide answers to your questions. Observability enables you to know what to ask next.

No App Is An Island

In a microservices architecture, developers can tweak and tinker with individual apps without worrying about this leading to the need for a full redeploy. However, the larger the microservice architecture gets the more issues this creates. When you have dozens of apps, worked on by as many developers, you end up running a service that relies on a multitude of different tools and coding languages.

A microservice architecture cannot function if the individual apps lack the ability to communicate effectively. For an app in the architecture to do its job, it will need to request data from other apps. It relies on smooth service-to-service interaction. This interaction can become a real hurdle when each app in the architecture was built with differing tools and code.

In a microservice-based architecture you can have thousands of components communicating with each-other. Observability tools give developers, engineers, and architects, the power to observe the way these services interact. This can be during specific phases of development or usage, or across the whole project lifecycle.

Of course, it is entirely possible to program communication logic into each app individually. With large architectures though this can be a nightmare. It is when microservice architectures reach significant size and complexity that our first observability solution comes into play- a service mesh.

Service Mesh

A service mesh works inter-service communication into the infrastructure of your microservice architecture. It does this using a concept familiar to anybody with knowledge of networks- proxies.

What does a service mesh look like in your cluster?

Your service mesh takes form as an array of proxies within the architecture, commonly referred to as sidecars. Why? Because they run alongside each service instead of within them. Simple!

Rather than communicate directly, apps in your architecture relay information and data to their sidecar. The sidecar will then pass this to other sidecars, communicating using a common logic embedded into the architecture’s infrastructure.

What does it do for you?

Without a service mesh, every app in your architecture needs to have communication logic coded in manually. Service meshes remove (or at least severely diminish) the need for this. Also, a service mesh makes it a lot easier to diagnose communication errors. Instead of scouring through every service in your architecture to find which app contains the failed communication logic, you instead only have to find the weak point in your proxy mesh network.

A single thing to configure

Implementing new policies is also simplified. Once out there in the mesh, new policies can be applied throughout the architecture. This goes a long way to safeguarding yourself from scattergun changes to your apps throwing the wider system into disarray.

Commonly used service meshes include Istio, Linkerd, and Consul. Using any of these will minimize downtime (by diverting requests away from failed services), provide useful performance metrics for optimizing communication, and allow developers to keep their eye on adding value without getting bogged down in connecting services.

The Three Pillars Of Observability

It is generally accepted that there are three important pillars needed in any decent observability solution. These are metrics, logging, and traceability. 

By adhering to these pillars, observability solutions can give you a clear picture of an individual app in an architecture or the infrastructure of the architecture itself.

An important note is that this generates a lot of data. Harvesting and administrating this data is time-consuming if done manually. If this process isn’t automated it can become a bottleneck in the development or project lifecycle. The last thing anybody wants is a solution that creates more problems than it solves.

Fortunately, automation and Artificial Intelligence are saving thousands of man hours every day for developers, engineers, and anybody working in or with IT. Microservices are no exception to this revolution, so there are of course plenty of tools available to ensure tedious data wrangling doesn’t become part of your day-to-day life.

Software Intelligence Platforms

Having a single agent provide a real-time topology of your microservice architecture has no end of benefits. Using a host of built-in tools, a Software Intelligence Platform can easily become the foundation of the smooth delivery of any project utilizing a large/complex microservice architecture. These platforms are designed to automate as much of the observation and analysis process as possible, making everything from initial development to scaling much less stressful.

A great software intelligence platform can:

  • Automatically detect components and dependencies.
  • Understand which component behaviors are intended and which aren’t wanted.
  • Identify failures and their root cause.

Tracking Requests In Complex Environments

Since the first days of software engineering and development, traceability of data has been vital. 

Even in monolith architectures keeping track of the origin points of data, documentation, or code can be a nightmare. In a complex microservice environment composed of potentially hundreds of apps it can feel impossible.

This is one of the few areas in which a monolith has an operational advantage. When literally every bundle of code is compiled in a single artifact, troubleshooting or request tracking through the lifecycle is more straightforward. Everything is in the same place.

In an environment as complex and multidimensional as a microservices architecture, documentation and code bounces from container to container. Requests travel through a labyrinth of apps. Keeping tabs on all this migration is vital if you don’t want debugging and troubleshooting to be the bulk of your workload.

Thankfully, there are plenty of tools available (many of which are open source) to ensure tracking requests through the entire life-cycle is a breeze.

Jaeger and Zipkin- Traceability For Microservices

When developing microservices it’s likely you’ll be using a stack containing some DevOps tooling. By 2020 it is safe to assume that most projects will at least be utilizing containerization of some description. 

Containers and microservices are often spoken of in the same context. There is a good reason for this. Many of the open source traceability tools developed for one also had the other very much in mind. The question of which best suits your needs largely depends on your containerization stack. 

If you are leaning into Kubernetes, then Jaeger will be the most functionally compatible. In terms of what it does, Jaeger has features like distributed transaction monitoring and root cause analysis that can be deployed across your entire system. It can scale with your environment and avoids single points of failure by way of supporting a wide variety of storage back ends.

If you’re more Docker-centric, then Zipkin is going to be much easier to deploy. This ease of use is aided by the fact that Zipkin runs as a single process. There are several other differences, but functionally Zipkin fills a similar need to Jaeger. They both allow you to track requests, data, and documentation across an entire life-cycle in a containerized, microservices architecture.

Logging Frameworks

The importance of logging cannot be overstated. If you don’t have effective systems for logging errors, changes, and requests, you are asking for nothing short of chaos and anarchy. As you can imagine, in a microservices architecture potentially containing hundreds of apps from which bugs and crashes can originate a decent logging solution is a high priority.

To have effective logging observability within a microservices architecture requires a standardized, system-wide approach to logging. Logging frameworks are a great way to do this. Logging is so fundamental that some of the earliest open source tools available were logging frameworks. There’s plenty to choose from, and they all have long histories and solid communities for support and updates by this point.

The tool you need really boils down to your individual requirements and the language/framework you’re developing in. If you’re logging in .Net then something like Nlog, log4net, or Serilog will suit. For Java your choice may be between log4j or logback. There are logging frameworks targeting most programming languages. Regardless of your stack, there’ll be something available. 

Centralizing Log Storage

Now that your apps have a framework in place to log deployments, requests, and everything else, you need somewhere to keep them until you need them. Usually, this is when something has gone wrong. The last thing you want to be doing on the more stressful days is wading through a few dozen apps-worth of log data.

Like almost every problem on this list, the reason observability is necessary for your logging process is due to the complexity of microservices. In a monolith architecture, logs will be pushed from a few sources at most. In a microservice architecture, potentially hundreds of individual apps are generating log data every second. You need to know not just what’s happened, but where it happened amongst the maze of inter-service noise.

Rather than go through the incredibly time-consuming task of building a stack to monitor all of this, my recommendation is to deploy a log management and analysis tool like Coralogix to provide a centralized location to monitor and analyze relevant log data from across the entirety of your architecture.

When errors arise or services fail, any of the dozens of options available will quickly inform you both the nature of the problem and the source. Log management tools hold your data in a single location. No more will you have to travel app to app searching for the minor syntax error which brought down your entire system.

In Short

There are limitless possibilities available for implementing a decent observability strategy when you’re working with microservices. We haven’t even touched upon many cloud-focused solutions, for example, or delved into the realms of web or mobile app-specific tools.

If you’re looking for the short answer of how to go about overcoming microservices issues caused by poor observability, it’s this: find a solution that allows you to track relevant metrics in organized logs so everything is easily traceable.

Of course, this is highly oversimplified, but if you’re looking purely for a nudge in the right direction the above won’t steer you wrong. With so many considerations and solutions available, it can feel overwhelming when weighing up your options. As long as you remember what you set out to do, the journey from requirement to deployment doesn’t have to be an arduous one.

Microservices architectures are highly complex at a topological level. Always keep that in mind when considering your observability solutions. The goal is to enable a valuable analysis of your data by overcoming this innate complexity of microservices. That is what good observability practice brings to the table.

The Secret Ingredient That Converts Metrics Into Insights

Metrics and Insight have been the obsession of every sector for decades now. Using data to drive growth has been a staple of boardroom meetings the world over. The promise of a data-driven approach has captured our imaginations.

What’s also a subject of these meetings, however, is why investment in data analysis hasn’t yielded results. Directors give the go ahead to sink thousands of dollars into observability and analytics solutions, with no returns. Yet all they see on the news and their LinkedIn feeds is competitors making millions, maybe even billions, by placing Analytics and Insight at the top of their agenda.

These directors and business leaders are confused. They have teams of data scientists and business analysts working with the most cutting edge tools on the market. Have those end of year figures moved though? Has performance improved more than a hard fought one, maybe two percent?

All metrics, no insights

The problem lies in those two words- Metrics and Insight.

More specifically, the problem is that most businesses love to dive into the metrics part. What they don’t realize is that without the ‘Insight’ half of the equation, all data analysis provides is endless logs of numbers and graphs. In a word, noise.

Sound familiar? Pumping your time, energy, and finance into the metrics part of your process will yield diminishing returns very quickly if that’s all you’re doing. If you want to dig yourself out of the ‘we just need more data’ trap, maybe you should switch your focus to the insights?

Data alone won’t solve this problem. To gain insight, what you need is something new. Context.

Why you NEED context

Metrics and Insight is business slang for keeping an extra close eye on things. Whether you’re using that log stack for financial data or monitoring a system or network, the fundamentals are the same. The How can be incredibly complex, but the What is straight forward. You’re using tech as a microscope for a hyper-focused view.

Without proper context it is impossible to gain any insight. Be it a warning about continued RAM spikes from your system monitoring log, or your e-commerce dashboard flagging a drop in sales of your flagship product, nothing actionable can be salvaged from the data alone.

If your metrics tell you that your CPU is spiking, you remain entirely unaware of why this is happening or what is going on. When you combine that spike in CPU with application logs indicating thread locking due to database timeouts, you suddenly have context. CPU spikes are good for getting you out of bed, but your logs are where you will find why you’re out of bed.

But how do you get context?

Context – Creating insight from metrics

With platforms like Coralogix, the endless sea of data noise can be condensed and transformed into understandable results, recommendations, and solutions. With a single platform, the results of your Analysis & Insight investments can yield nothing but actionable observations. Through collecting logs based on predetermined criteria, and delivering messages and alerts for the changes that impact your goals, Coralogix makes every minute you spend with your data cost effective. The platform provides context.

Platforms like Coralogix create context from the noise, filtering out what’s relevant to provide you with a clear picture of your data landscape. From context comes clarity, and from clarity comes insight, strategy, and growth.

Essential Observability Techniques for Continuous Delivery

Observability is an indispensable concept in continuous delivery, but it can be a little bewildering. Luckily for us, there are a number of tools and techniques such as CI/CD metrics that make our job easier!

Metric Monitoring

One way to aid in improving observability in a continuous delivery environment is by monitoring and analyzing key metrics from builds and deploys. With tools such as Prometheus and their integrations into CI/CD pipelines, gathering and analysis of metrics is simple. Tracking these things early on is essential. They will enable you to debug an issue or to optimize your stack.

Important metrics include:

  • Bug rates
  • The time taken to resolve a broken build
  • Deployment-caused production downtime
  • A build’s duration in comparison to past builds

Build and deployment metrics are vital to understanding what is going wrong in your development or deployment processes.

Staging Environments

One of the most powerful tricks up a developer’s sleeve is a staging environment. Testing in stage means you can be confident that your code has had a proper run-through.

However, the biggest issue brought in by running a staging environment is the effort it can take to ensure that the environment is constantly matching production. The most common method to mitigate this is to use “Infrastructure as Code”. This allows you to declare your cloud resources using code. When you need a new environment, you can run this same code. This ensures consistency between environments.

Centralized Logging

As we move into a world of containerized applications, our software components are becoming increasingly separated. This can lead to difficulty in debugging an issue. We need to put some thought into aggregating application logs from each of our services into one central location. Coralogix offers a managed ELK stack, supported by machine learning and integrations with major delivery pipelines like Jenkins.

Continuous Delivery Deployment Patterns

We can also follow patterns such as Blue/Green deployments, where we will always run 2 twinned “production” instances or instance groups, which are effectively swapped between which is production and which is staging, allowing us to be confident that both environments are always reliably configured and match each other. It’s important to ensure only environment-specific infrastructure is switched when a deployment is done, however, as you don’t want to accidentally switch to your staging database in your production environment. Patterns such as these are often easy to implement whatever your chosen provider might be, for example within AWS a Blue/Green deployment could simply the change of a Route53 record for your domain at “app.example.com” to point from one instance, load balancer, Lambda, etc., to another!

Machine Learning & Continuous Delivery

If you’re worried about all the possible issues that could crop up in your CI/CD processes, maybe you wish there was someone or something to manage it for you – and this is where machine learning can come in very handy. As a lot of issues in CI/CD follow somewhat regular patterns, ML tools such as Coralogix’s anomaly detection tools can save you time by learning your system log sequences, and using these to instantly detect any issues without requiring any human monitoring or intervention past the setup phase!

All in all

In such a fast-moving era of technology with increasing levels of abstraction and separation between application and infrastructure, it’s important for us to be able to understand exactly what our CI/CD metrics processes are doing. We need to be able to quickly monitor deployment health just as we would application health. Observability is a crucial capability for any organization, looking to move into continuous delivery.