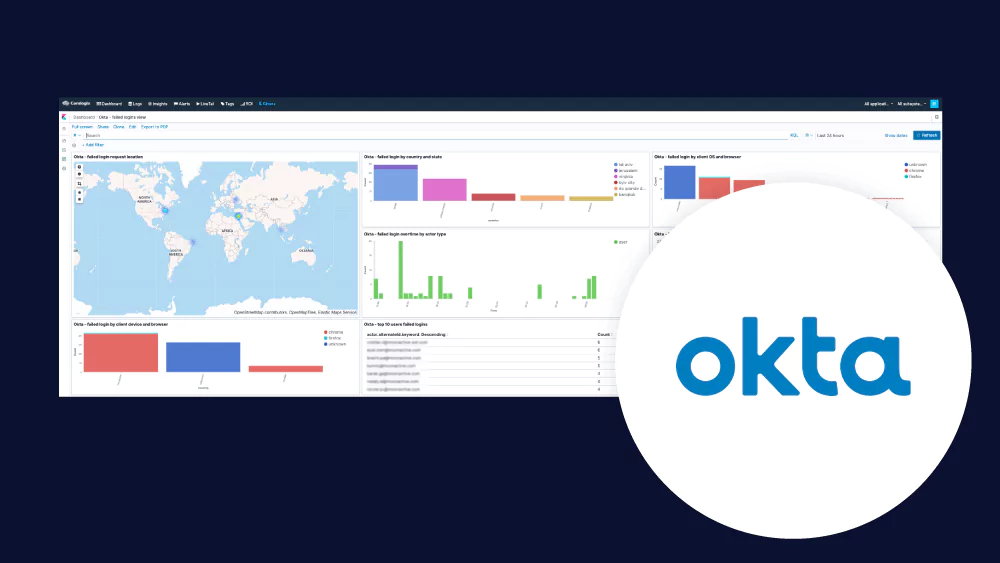
Today, Okta, a leading enterprise identity and access management firm, reported that it had launched an inquiry after the LAPSUS$ hacking group posted screenshots on Telegram. The hackers claimed the pictures were taken after obtaining access to “Okta.com Superuser/Admin and various other systems.”
If your organization uses Okta as its SSO, and you are currently forwarding Okta audit logs to your Coralogix account it is likely that your logs already contain information that can help you investigate if you were attacked. This article will describe the steps you need to create alerts that will notify you if such an event happens.

Get the logs to flow
If you haven’t yet, the first thing you need to do is get the Okta audit logs shipped to Coralogix. The steps are detailed here: Okta Audit Logs.
Deploy Okta Audit extension pack
Now that the data is coming in, you can enable the Okta audit extension pack by following these steps:
- Login to your Coralogix account
- From the “Data Flow” menu, choose the “Extensions” option
- Look for “OKTA Audit” and click the “Deploy” button. Select the application and subsystem names assigned to Okta audit logs
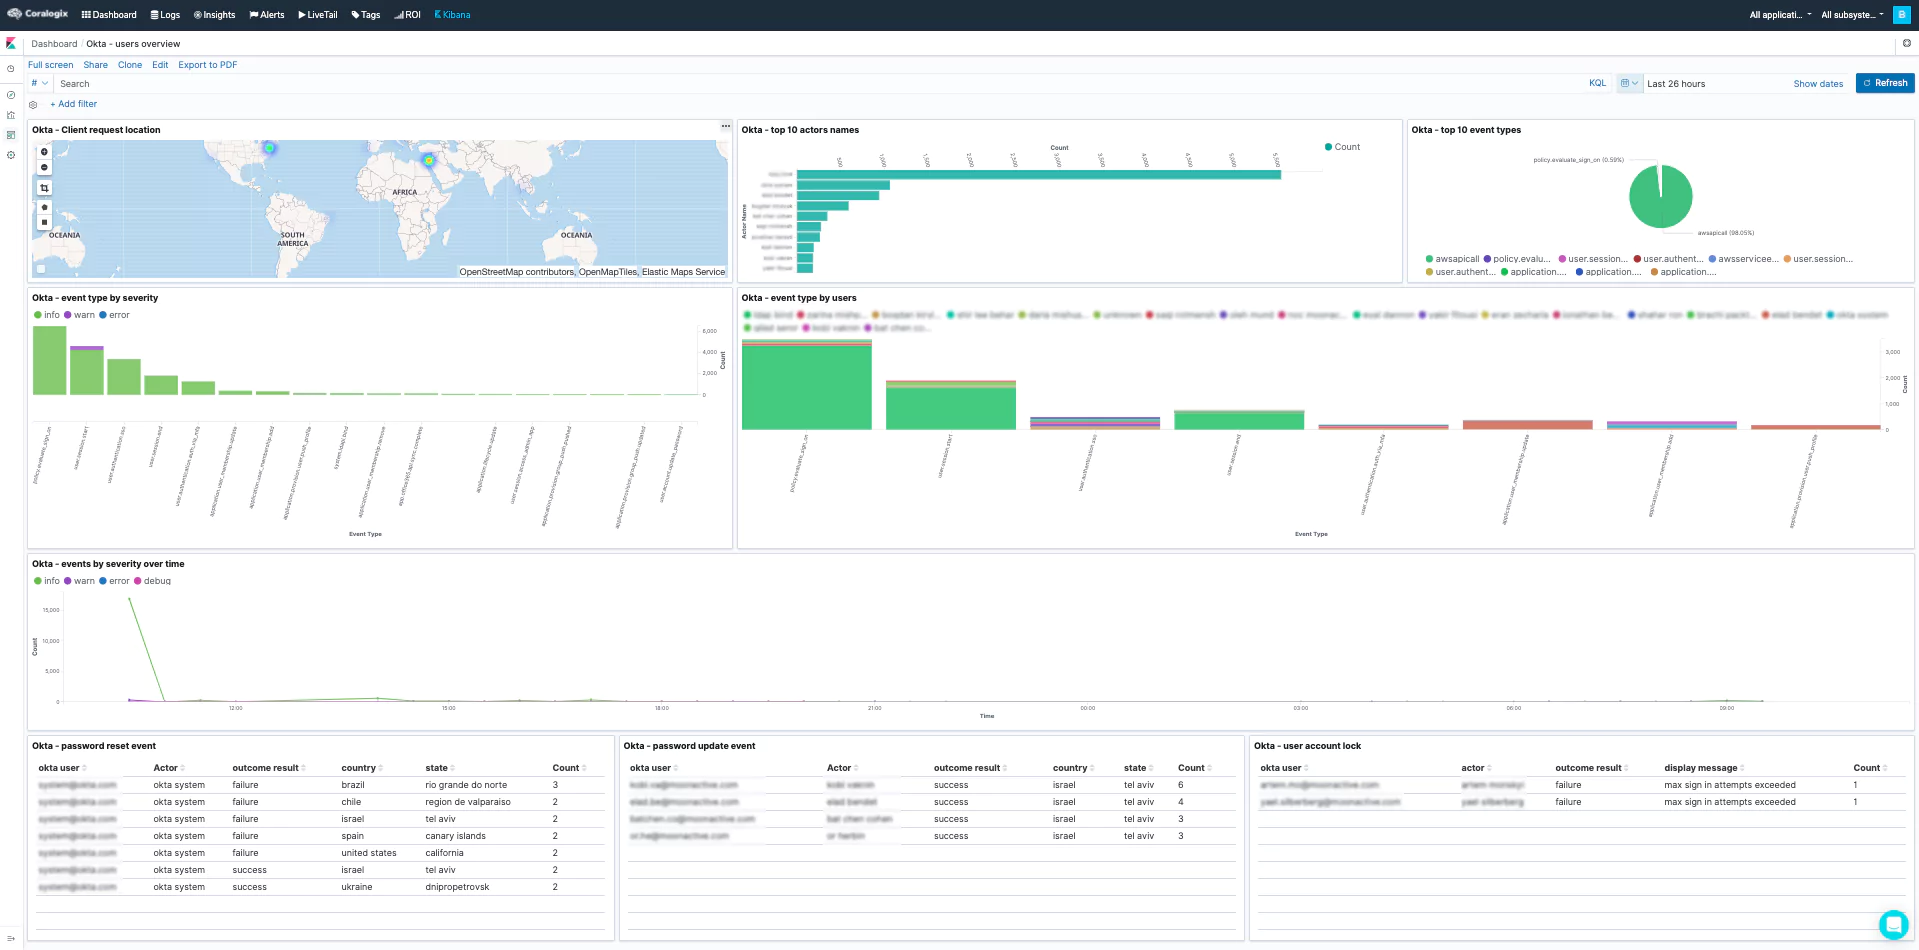
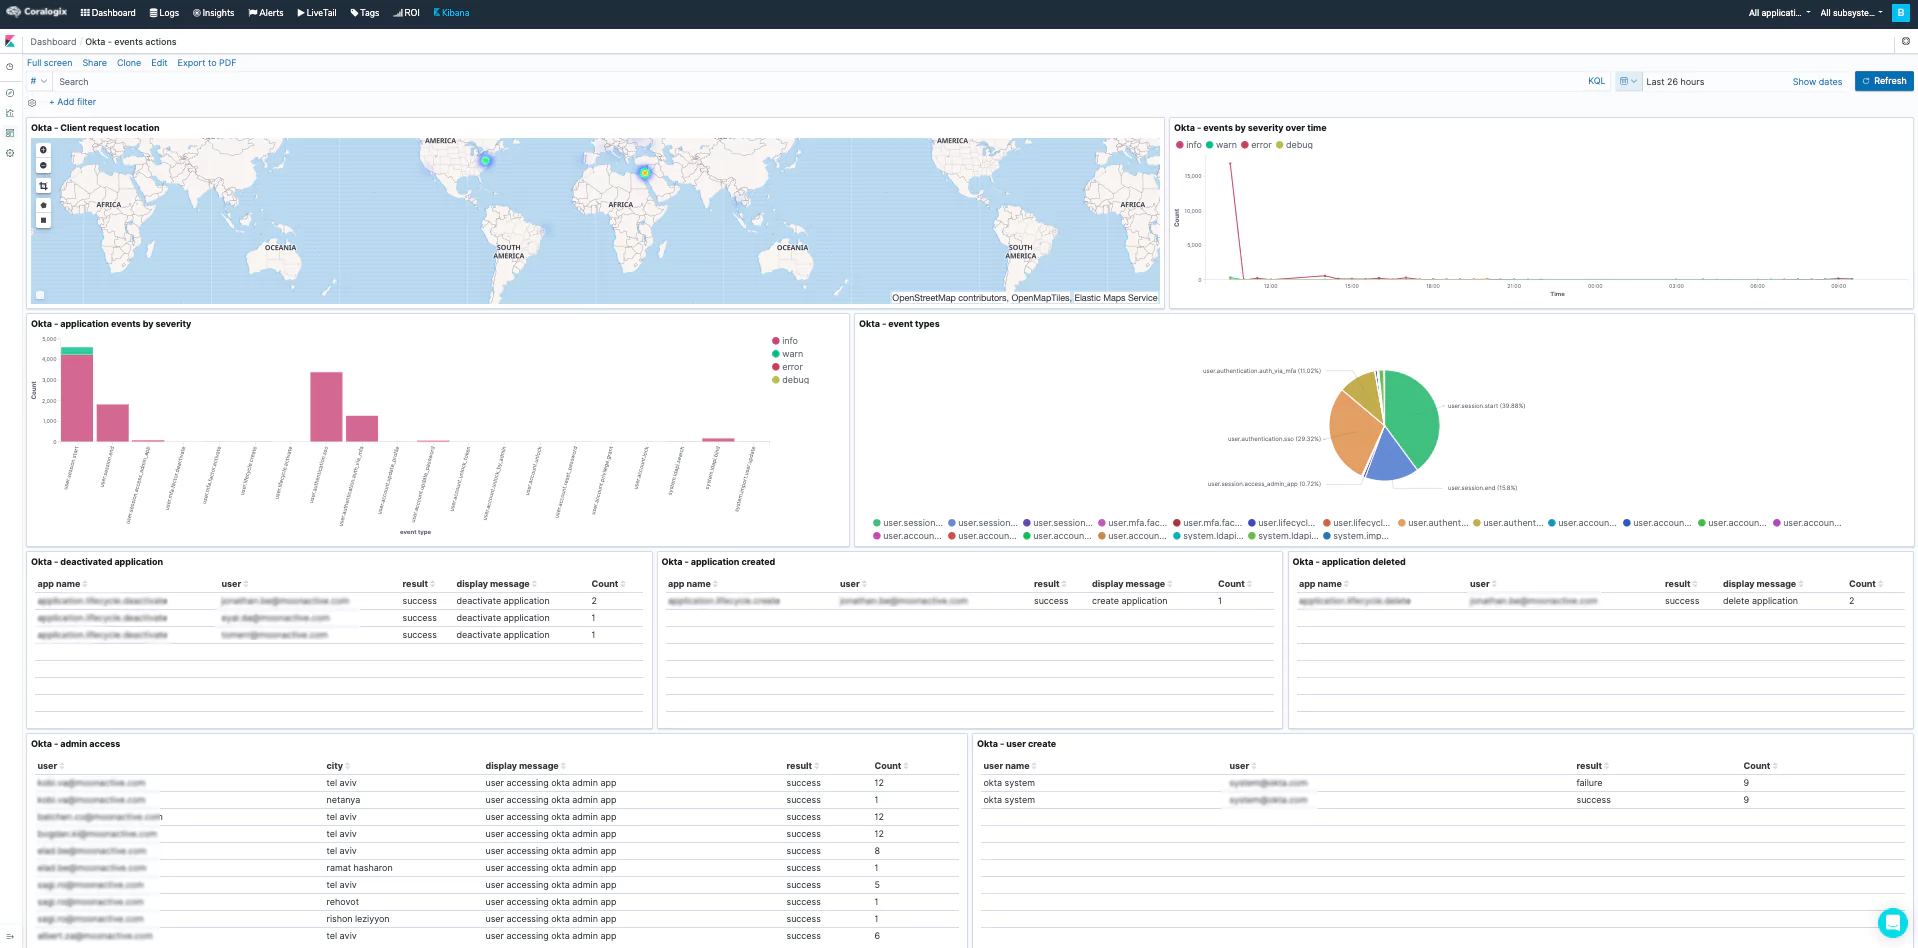
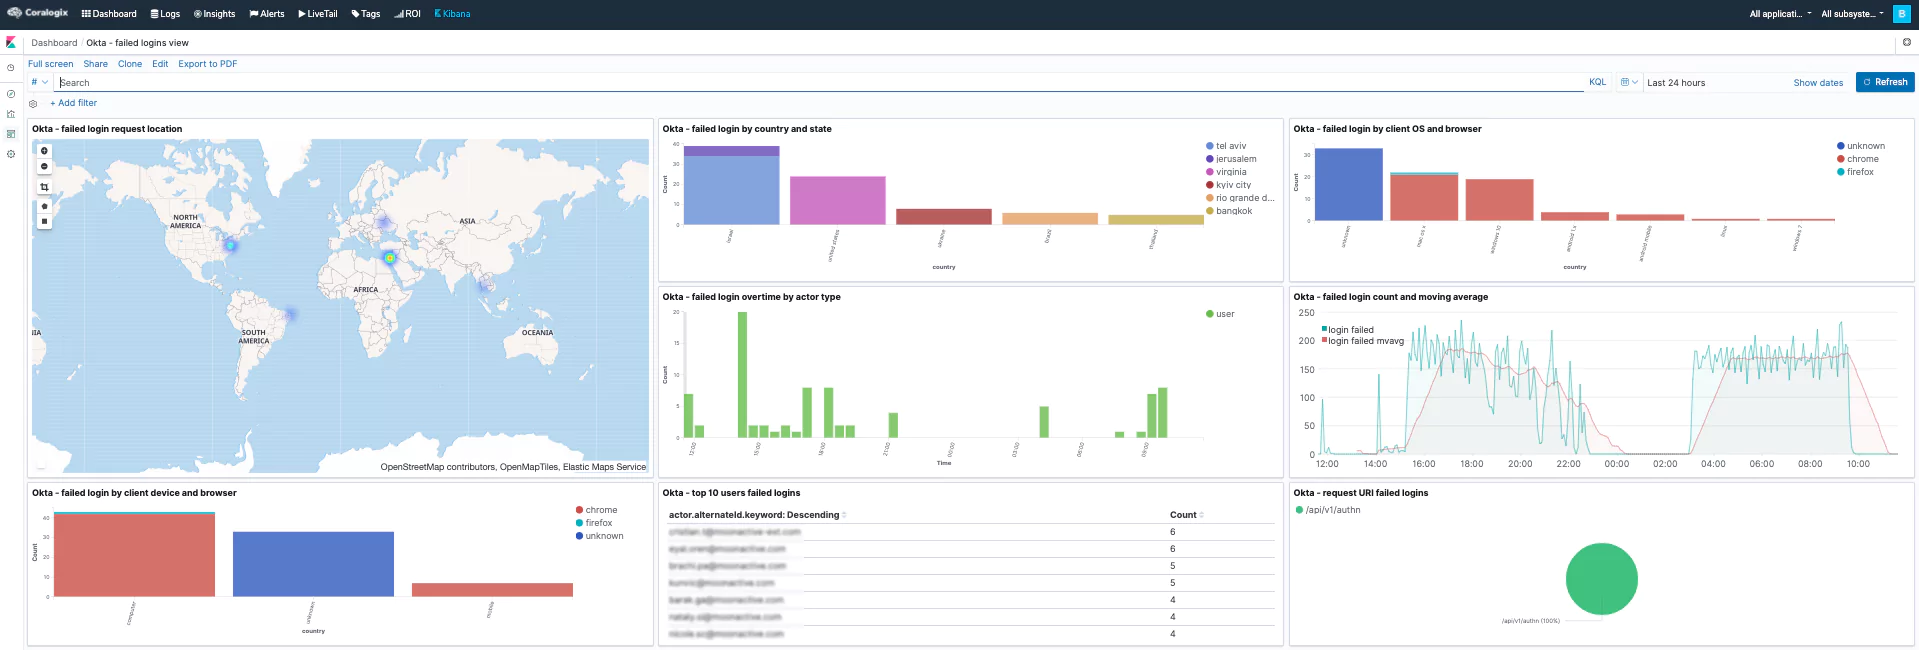
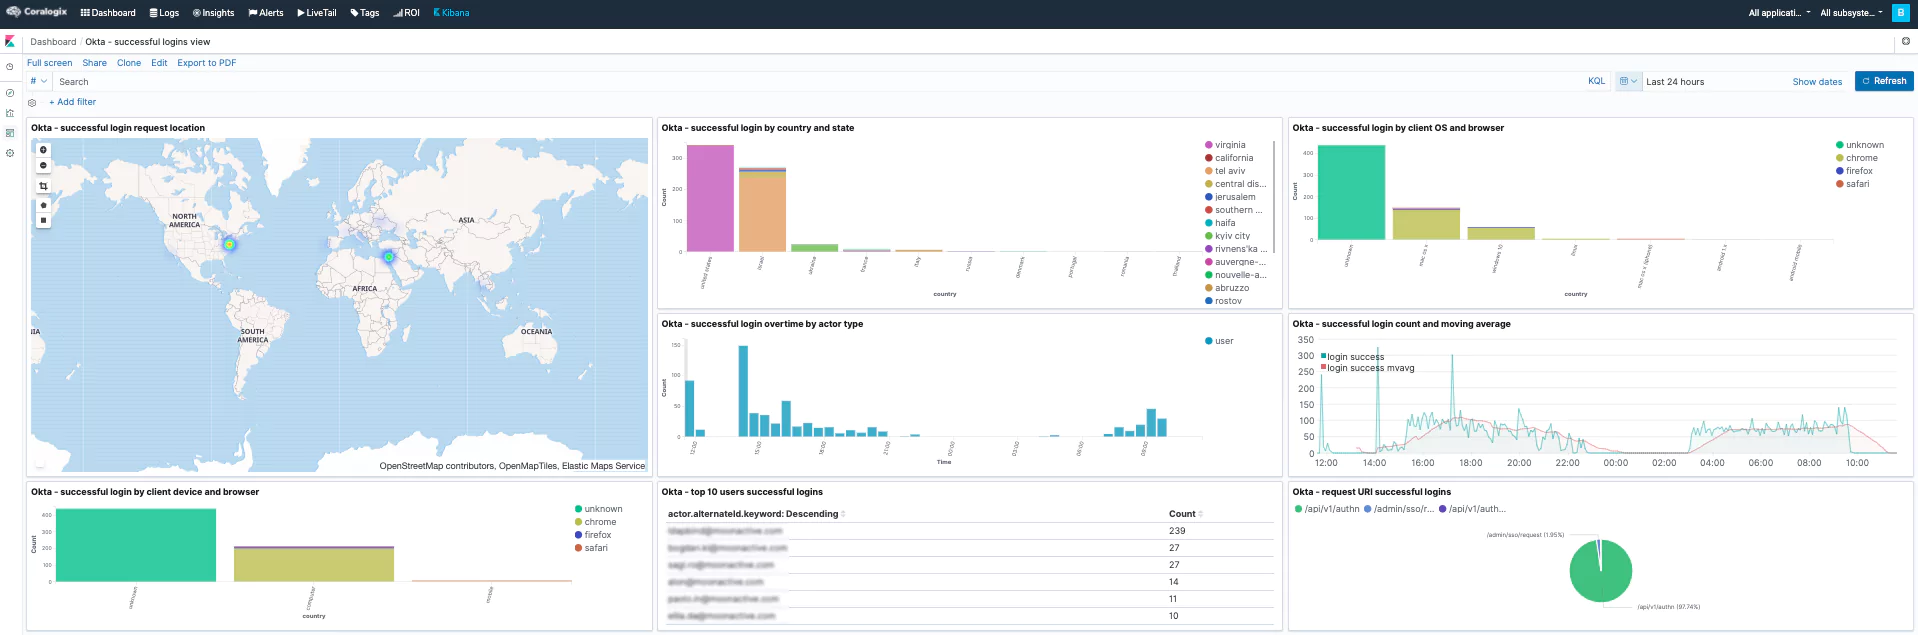
Several alerts and (Kibana) dashboards will be added to your account and will detect anomalies related to this attack. These dashboards will help investigate Okta authentication-related security issues. These alerts (such as ‘Unauthorized admin request,’ ‘A new non-browser like tool used to enter an app,’ and ‘Access admin app event from unknown actor’) can detect this specific breach.
Enable enrichment on relevant fields
To improve the detection even further, you can also enable the security enrichment in Coralogix on the logs from Okta. To do that, follow these simple steps:
- From the “Data Flow” menu, choose the “Data Enrichment” option
- Add the field “ip” to the “Security Enrichment”
Create alerts
- Add a standard alert to Coralogix with the following details:
- Name: Okta Authentication Attempt from a blacklisted IP
- Description: A user or service has attempted to log in via Okta from an IP address on the AlienVault database. See more details here:
- Alert Type: Standard
- Query: _exists_:ip_suspected
- Applications: The application names assigned to Okta audit events
- Subsystems: The subsystem names assigned to Okta audit events
- Conditions:
- Alert when: Notify immediately
- Add a unique count alert to Coralogix with the following details:
- Name: A user has attempted to log on from multiple locations within an hour
- Description: A user or service has attempted to log in via Okta from multiple geographic locations within the last hour
- Alert Type: Unique Count
- Query: _exists_:request.ipChain.geographicalContext.country AND _exists_:actor.id
- Applications: The application names assigned to Okta audit events
- Subsystems: The subsystem names assigned to Okta audit events
- Conditions:
- Unique Count By Key: request.ipChain.geographicalContext.country
- Max Unique Values: 1
- In Timeframe: 1 Hour
- Group Unique Count per Specific Key: Checked
- Group By Key: actor.id
- After you have done that, we recommend that you’ll take a look at this article and add the alerts mentioned in it too:
- Okta Policy update
- OKTA – Revoke user privilege
- OKTA – Admin Privilege Granted
- Okta – access admin app event from unknown actor
- administrative access to Okta
- Okta – login from an unfamiliar country
Create Visualization
The steps mentioned above will help you detect and alert about unusual Okta activities, which will indicate malicious activity such as the one done by the LAPSUS$ hacking group. In addition, you can build the following table visualization in Kibana and use it to examine the Okta logs from the past 24 hours to see if there was any alarming activity:
- Click on the menu button to the right of ‘All subsystems’ at the top right corner of the Coralogix UI and select “Kibana”
- Click on “Visualize” and then on “Create new visualization”
- Select “Data Table” visualization type
- Under “Metrics,” change the Metric aggregation from “Count” to “Unique Count” and set the field to “request.ipChain.geographicalContext.country.keyword”
- Set the “Custom label” to “Countries”
- Under “Buckets,” click “Add” and select “Split rows”
- In the “Aggregation” field, select “Terms” and set the field to “actor.id.keyword” and set “Size” to the number of Okta users you have
- Under “Buckets,” click “Add” and select “Split rows” again
- In the “Aggregation” field, select “Terms” and set the field to “actor.displayName.keyword” and set “Size” to the number of Okta users you have
- Click the blue “Apply Changes” button (looks like a blue triangle at the top)
- In the “Options” tab set the number of results per page to a number that will make the visualization useful for you.
- Click the “Save” button at the top. Now you can add this visualization to any Kibana dashboard that you’d like
You can now check the number of source countries per user across the selected time range at the top right. If you find a user that has connected from multiple locations, especially if this user is a privileged user, you can use this visualization to investigate the behavior of this user in the past to see if this is a new behavior.
If you have any further questions and need assistance, you can reach out to our 24×7 support team via the in-app chat.