 The new standard of observability is here. Discover Olly, the industry’s first

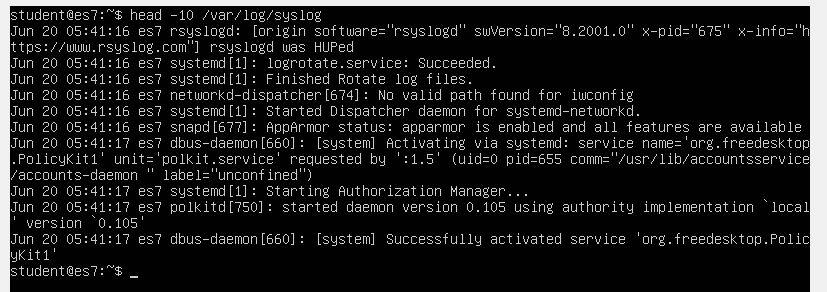
Syslog takes its name from the System Logging Protocol. It is a standard for message logging monitoring and has been in use for decades to send system logs or event messages to a specific server, called a Syslog Server.
Syslog Components
To achieve the objective of offering a central repository for logs from multiple sources, Syslog servers have several components including:
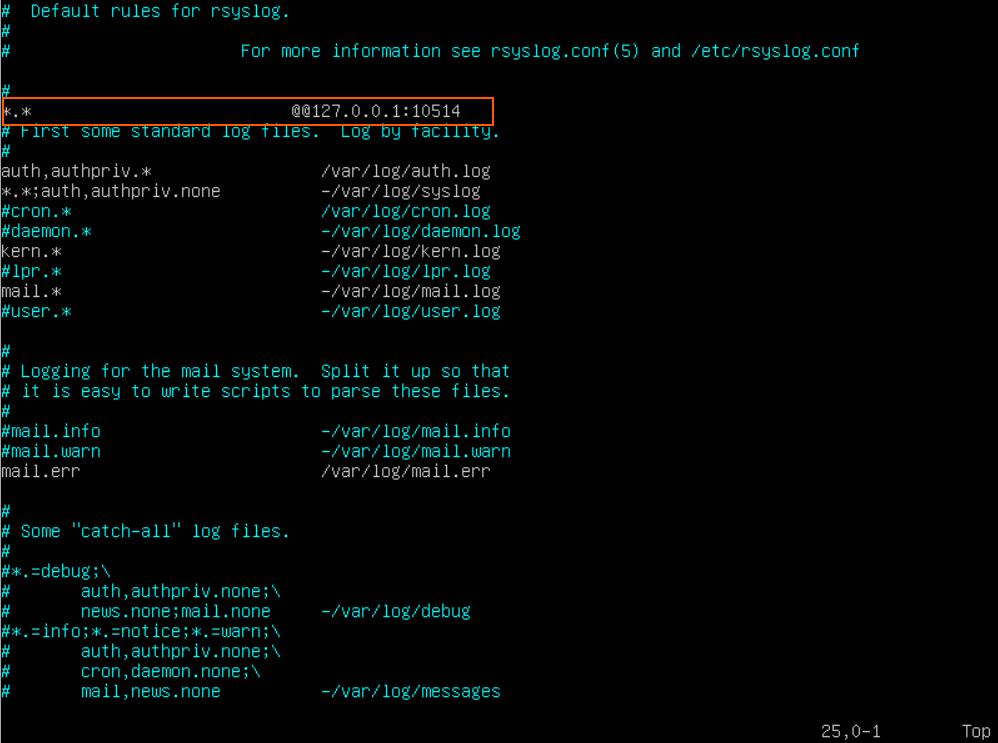
- Syslog Listener: This gathers and processes Syslog data sent over UDP port 514.
- Database: Syslog servers need databases to store the massive amounts of data for quick access.
- Management and Filtering Software: The Syslog Server needs help to automate the work, as well as to filter to view specific log messages. This software is able to extract specific parameters and filter logs as needed.
Message Components
The Syslog message format is divided into three parts:
- PRI: A calculated Priority Value which details the message priority levels.
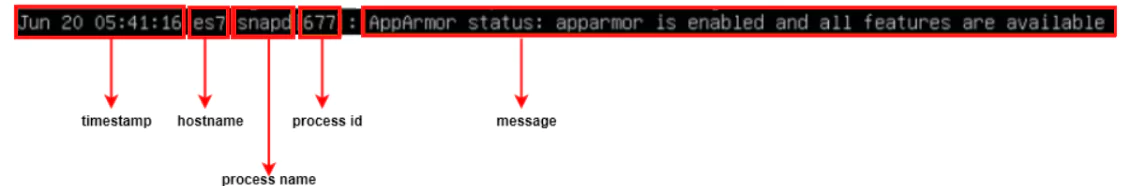
- HEADER: Consists of two identifying fields which are the Timestamp and the Hostname (the machine name that sends the log).
- MSG: This contains the actual message about the event that happened. It is UTF-8 encoded and is also divided into a TAG and a CONTENT field. The information includes event messages, severity, host IP addresses, diagnostics and more.
More About PRI
This is derived from two numeric values that help categorize the message, Facility Code and Severity Level.
Facility Code: This value is one of 15 predefined codes or various locally defined values in the case of 16 to 23. These codes specify the type of program that is logging the message. Messages with different facilities may be handled differently. The list of facilities available is defined by the standard:
| Facility Code | Keyword | Description |
|---|---|---|
| 0 | kern | Kernel messages |
| 1 | user | User-level messages |
| 2 | Mail system | |
| 3 | daemon | System daemons |
| 4 | auth | Security/authentication messages |
| 5 | syslog | Messages generated internally by syslogd |
| 6 | lpr | Line printer subsystem |
| 7 | news | Network news subsystem |
| 8 | uucp | UUCP subsystem |
| 9 | cron | Clock daemon |
| 10 | authpriv | Security/authentication messages |
| 11 | ftp | FTP daemon |
| 12 | ntp | NTP subsystem |
| 13 | security | Log audit |
| 14 | console | Log alert |
| 15 | solaris-cron | Scheduling daemon |
| 16-23 | local0 – local7 | Locally-used facilities |
The mapping between facility code and keyword is not uniform in different operating systems and Syslog implementations.
Severity Level: The second value of a Syslog message categorizes the importance or severity of the message in a numerical code from 0 to 7.
| Level | Severity | Description |
|---|---|---|
| 0 | Emergency | System is unusable |
| 1 | Alert | Action must be taken immediately |
| 2 | Critical | Critical conditions |
| 3 | Error | Error conditions |
| 4 | Warning | Warning conditions |
| 5 | Notice | Normal but significant condition |
| 6 | Informational | Informational messages |
| 7 | Debug | Debug-level messages |
The PRI value is calculated by taking the Facility Code, multiplying it by eight and then adding the Severity Level. Messages are typically no longer than 1024 bytes.
Advantages
Syslog allows the separation of the software that generates messages, the system that stores them and the software that reports and analyzes them. Therefore it provides a way to ensure that critical events are logged and stored off the original server. An attacker’s first effort after compromising a system is usually to cover their tracks left in the logs. Logs forwarded via Syslog are out of reach.
Monitoring numerous logs from numerous systems is time consuming and impractical. Syslog helps solve this issue by forwarding those events to the centralized Syslog server, consolidating logs from multiple sources into a single location.
While Syslog is not the best way to monitor the status of networked devices, it can be a good way to monitor the overall health of network equipment. Sudden spikes in event volume, for example, might indicate sudden traffic spikes. Learning about this at the edge of your system lets you get ahead of the problem before it happens.
Syslog can be configured to forward authentication events to a Syslog server, without the overhead of having to install and configure a full monitoring agent.
Limitations
Syslog does not include an authentication mechanism and is therefore weak on security. Therefore, it is possible for one machine to impersonate another machine and send fake log events. It is also susceptible to replay attacks.
Also, it is possible to lose Syslog messages because of its reliance on UDP transport. UDP is connectionless and not guaranteed, so messages could be lost due to network congestion or packet loss.
Another limitation of the Syslog protocol is that the device being monitored must be up and running and connected to the network to generate and send a message. A critical error from a server may never send an error at all if the system goes offline. Therefore, Syslog is not a good way to monitor the up and down status of devices.
Finally, although there are standards about the components of a message, there is a lack of consistency in terms of how message content is formatted. The protocol does not define standard message formatting. Some messages may be human readable, some not. Syslog just provides a method to transport the message.
Log Messages Best Practices
To help create the most useful Syslog messages possible, follow these best practices:
Use Parsable Log Formats
There is no universal structure for log messages. Working with large volumes of logs is almost impossible if you don’t have a way to automatically parse log entries to find what you’re searching for. Tools are far more likely to work with a parseable format.
One example is JSON, a structured-data log format that’s become the standard used for many logging applications. It is both machine and human-readable and is supported by most languages and runtimes. It also has the added benefit of being compact and efficient to parse.
Use a Logging Library or Framework
There are many logging libraries for programming languages and runtime environments. Whatever the language your app is developed with, use a compatible framework to transmit logs from your app or service to a Syslog server.
Standardized Formats
Set in the operating standards, the format or schema of the messages, for all users to follow. Standardizing the formats will mean less clutter in the logs and they become more searchable. Avoid long sentences and use standard abbreviations i.e use ‘ms’ for ‘milliseconds’.
There should be non-negotiable fields in your logs. IP address, timestamp, whatever you need. It’s important to have basic fields that are always set, every time. Additionally, log formats without schemas are difficult to maintain as new logging code is added to your software, new team members join and new features are developed.
Knowing exactly what information needs to be embedded in log messages helps users write them and helps everyone else read them.
Include Identifiers
Closely linked with using a format to precisely describe the log format is the best practice of using identifiers in the messages. Identifiers help identify where a message came from and figure out how multiple messages are related. For example, including a transaction or session ID in your log message allows you to link two separate errors to the same user session.
Include Syslog Severity Levels
Correctly using the most appropriate logging Severity Level when sending a message can make future troubleshooting easier. Allowing logging to be set at the wrong level and can cause monitoring issues creating false alarms or masking urgent issues.
Include the Right Amount of Context
The best Syslog messages include all the relevant context to recreate the state of your application at the time of the logging call. This means adding the source of the problem in error messages and concise reasons for sending emergency log messages.
Avoid Multi-line Log Messages
The Syslog protocol specification allows multiple lines to be contained within a single log message, but this can cause some parsing issues. Line breaks in log lines aren’t friendly with every log analysis tool. For example, sed and grep commands, don’t handle searching for patterns across lines very well. Therefore, review and declutter the messages following the agreed message format.
However, if you absolutely must include multiline messages then investigate using a cloud-based log aggregation tool such as Papertrail. This has the ability to find the separate parts of a single log message when it’s split across lines.
Don’t Log Sensitive Data
Never ever write any passwords to the log files. The same applies for sensitive data like credit card details, bank account details and personal information. Syslog messages are rarely encrypted at rest. A malicious attacker will be able to easily read them.
Refine Your Logging Code
Another good practice is to review the logging code to:
- Add more content in the Emergency, Alert, Critical, Error and Warning log statements.
- Keep the Notice, Informational and Debug messages short.
- Log in decision points, don’t log inside short loops.
Common Tooling
Some of best Syslog tools for Linux and Windows include:
SolarWinds Kiwi Syslog Server
One of best tools for collecting, viewing and archiving Syslog messages. It is a versatile, user friendly viewer with automated message responses. This tool is easy to install and generates reports in plain text or HTML.
The software handles Syslog and SNMP from Windows, Linux and UNIX hosts.
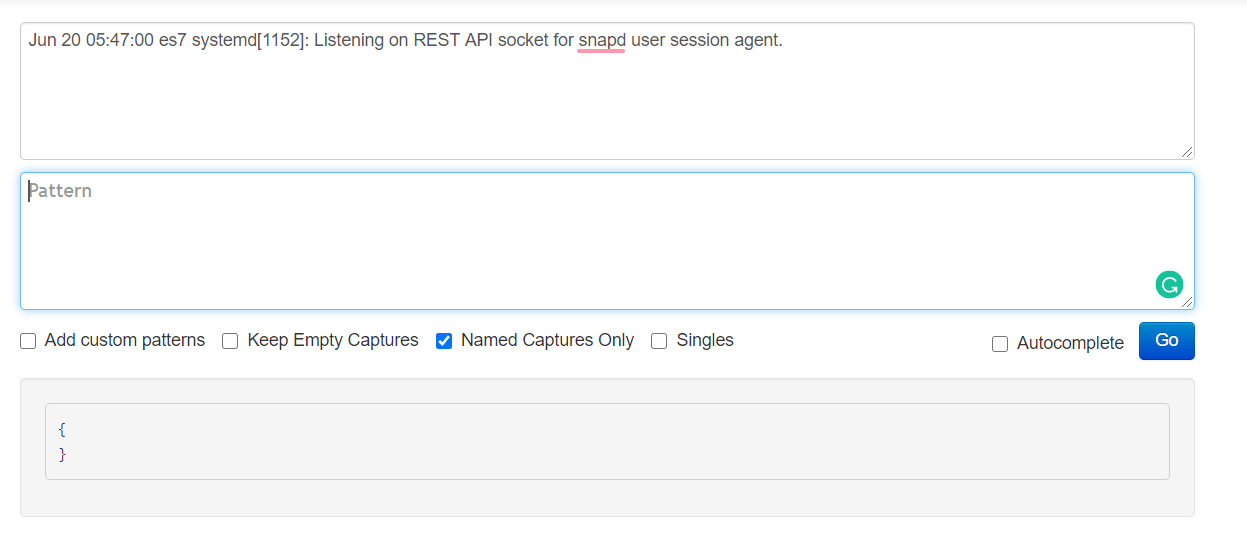
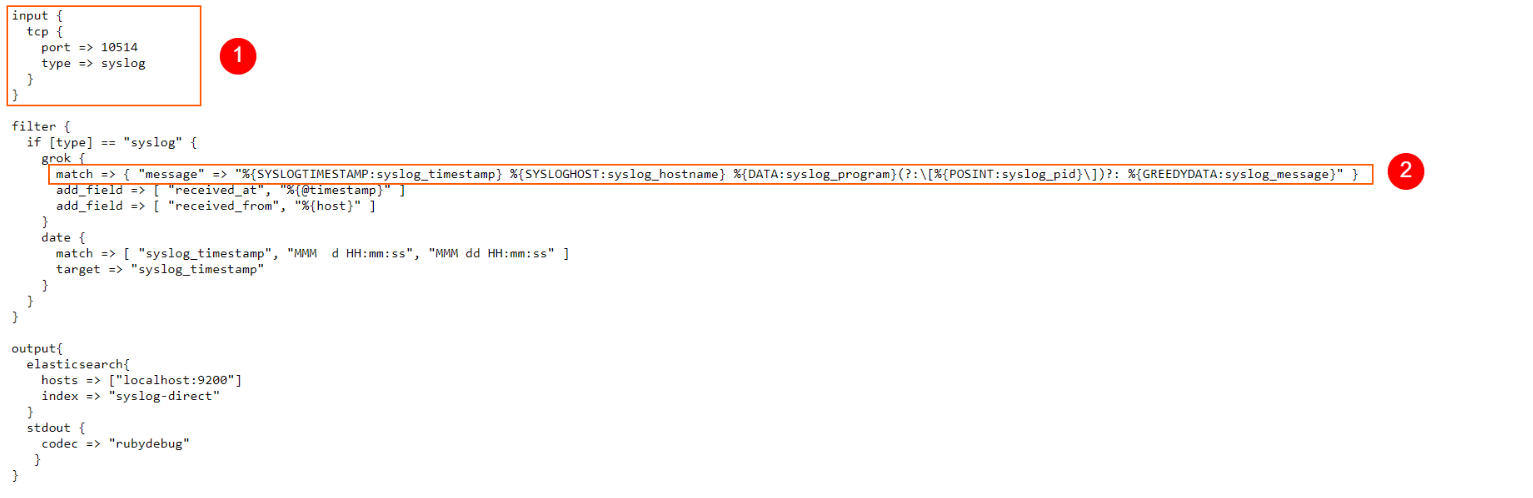
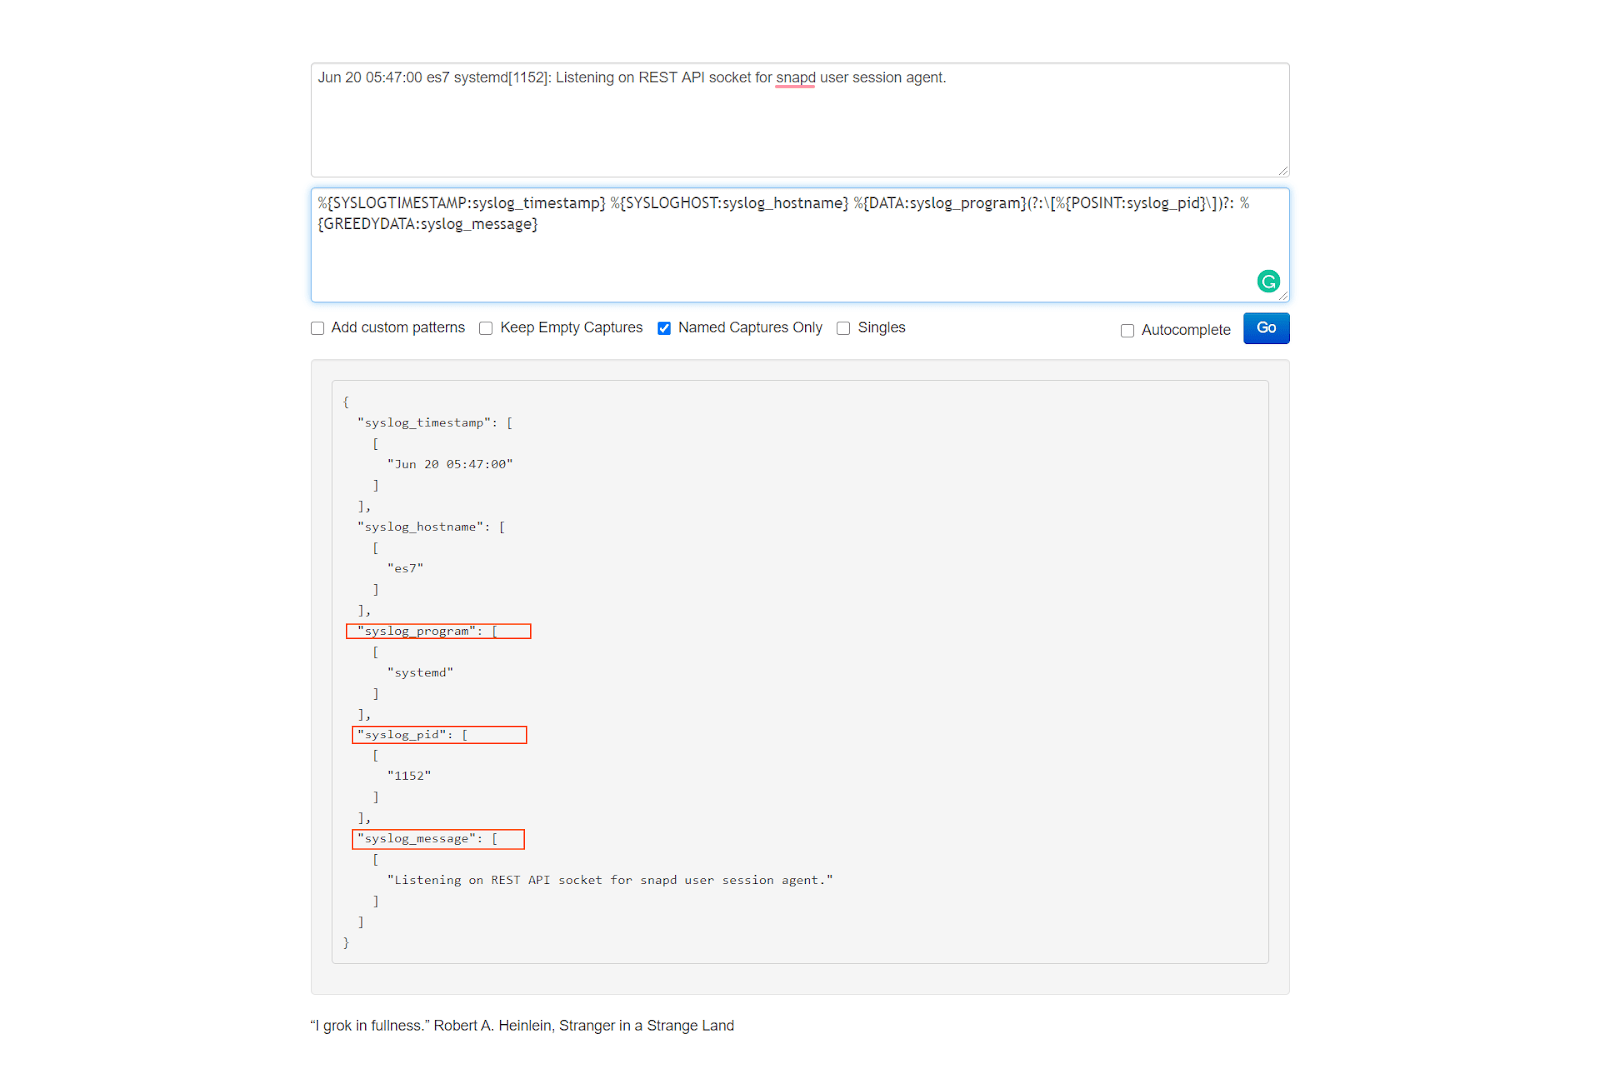
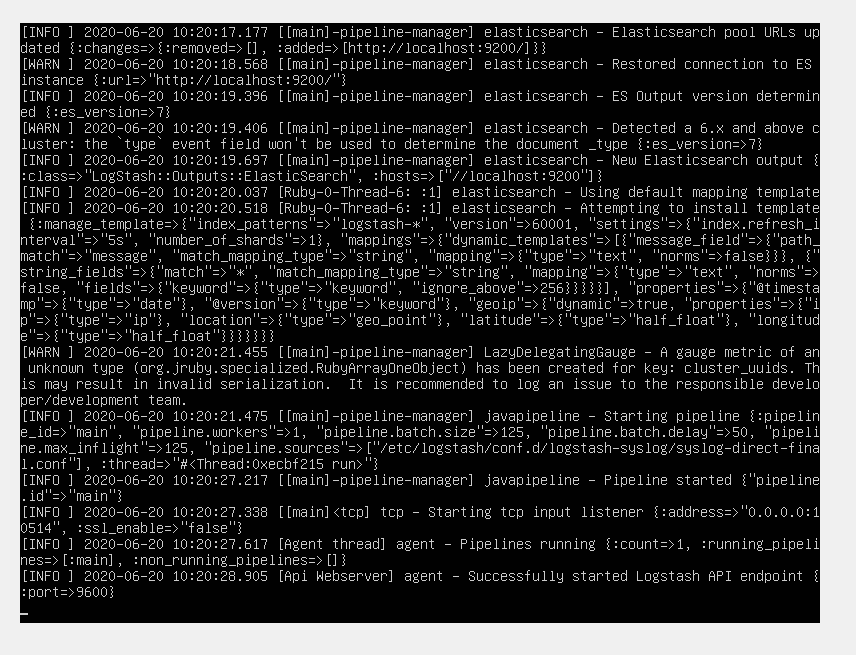
Logstash
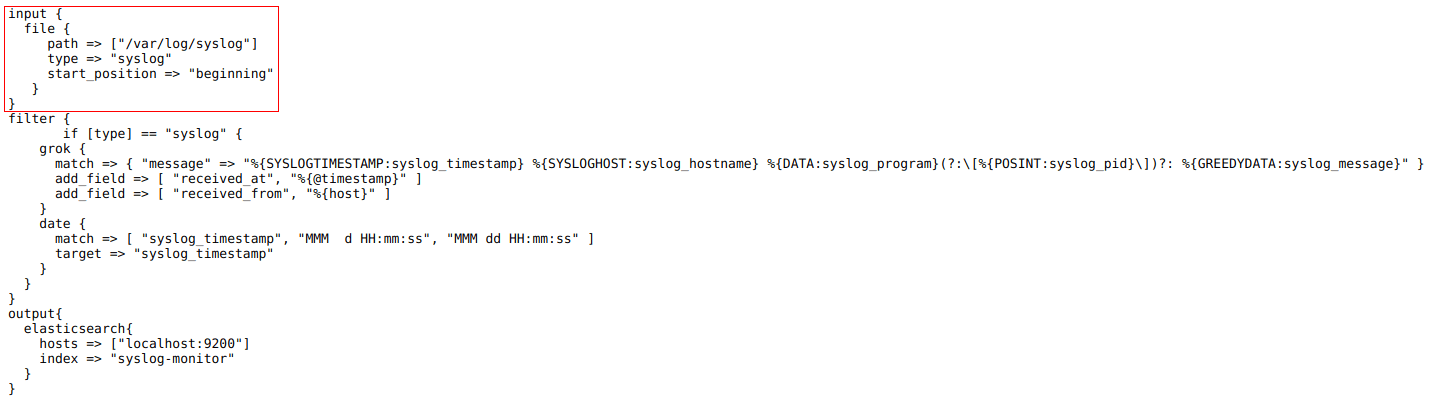
Data from the centralized Syslog server can be forwarded to Logstash. This can perform further parsing and enrichment of the log data before sending it on to Elasticsearch. Here’s a guide with hands-on exercises for getting familiar with Syslog in Logstash.
LOGalyzer
LOGalyzer is another free open-source, centralized log management and network monitoring tool.
It supports Linux and Unix servers, network devices and Windows hosts, providing real-time event detection and extensive search capabilities.
Summary
Complete network monitoring requires using multiple tools. Syslog is an important tool in network monitoring because it ensures that events occurring without a dramatic effect do not fall through any monitoring gaps. The best practice is to use software that combines all the tools, so to always have an overview of what is happening in your network.
As Syslog is a standard protocol, many applications support sending data to Syslog. By centralizing this data, you can easily audit security, monitor application behavior and keep track of other important server information.
The Syslog log message format is supported by most programming tools and runtime environments so it’s a useful way to transmit and record log messages. Creating log messages with the right data requires users to think about the situations and to tailor the messages appropriately. Following best practices makes the job easier.
