The new standard of observability is here. Discover Olly, the industry’s first
Logging is critical for monitoring and troubleshooting your Node.js project. The open-source Winston logger helps take a load off our shoulders by making it easier to centralize, format, enrich, and distribute the logs to fit a particular need.
Winston creates custom logger instances which can be configured to act as centralized logging entities. Essentially, the internal architecture of the module decouples the actual event logging from the implementation of the storage logic.
A simple console.log sends everything to the default standard output (i.e. to your console screen), and redirecting that flow into a centralized, managed location is not a simple task. An external plugin such as Winston conditionally redirects your logging activities’ destination. This gives developers great flexibility when it comes to choosing, and even switching between different storage options.
Why do we need a logger like Winston?
A logger offers many benefits over any type of manual logging techniques, such as the good old console.log. Winston offers:
1. Centralized control over how and when to log
With Winston, you can change your code in a single place and customize the format of your logs (e.g., logging in JSON format, or adding a timestamp). These are far superior options compared to those available when you use a console.log command, which requires logging code to be spread across your entire code base, breaking DRY principles.
2. Control where your logs are sent
Controlling where logs are saved is crucial for organizing the data and making it easier to query. Although console.log allows the redirection of logs via command line redirections, there are limitations (such as not being able to send them to a 3rd party system). With Winston, you can save your logs to multiple destinations (such as Elasticsearch, MongoDB, etc.). You can conditionally select the output destination and more.
3. Custom logging formats
When logging into a standard output, such as your terminal window, you can control the format for your logs. This enables you to improve readability by choosing the color of your text and format of your logging messages such as pre-fixing with a timestamp, or the logging level.
4. Extra context
This is particularly useful when the output arises from a distributed architecture. When you’re sending logs from different places into a single platform, you may add context to your log messages to identify their origin. For example, the source IP, or the server’s ID; anything that identifies where the data is coming from.
I’m sure you can think of specific benefits for your particular use case given a centralized logging library as powerful as Winston is.
Winston vs. Morgan vs. Bunyan
Although Winston logger is definitely one of the most powerful and flexible options out there, there are others that might better fit your needs depending on your particular use case.
Morgan
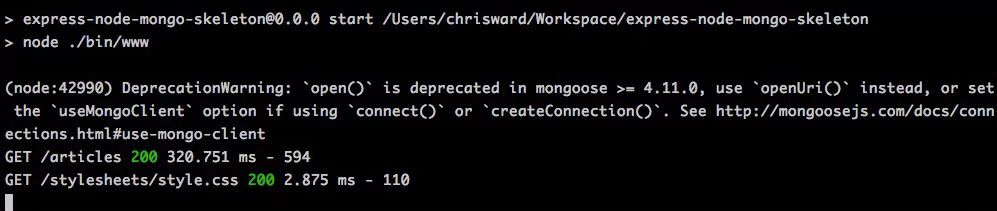
Morgan works with frameworks that are compatible with modules such as Express.js. As opposed to Winston, which is a general-purpose logger capable of great flexibility and customization, Morgan is intended to be used as middleware to customize the format of the HTTP-request event logline (and any associated errors during the processing of such requests).
As mentioned before, by default, all logs are written to the standard output, as with console.log, but Morgan allows you to override that and provide a custom stream and storage destination. If you’re looking for a basic logger for your web server, this might be a good choice.
Bunyan
Bunyan is very similar to the Winston logger from a feature set point of view. This is not a simple logger. On the contrary, it provides fine-tuned control over both the data being logged and its output destination.
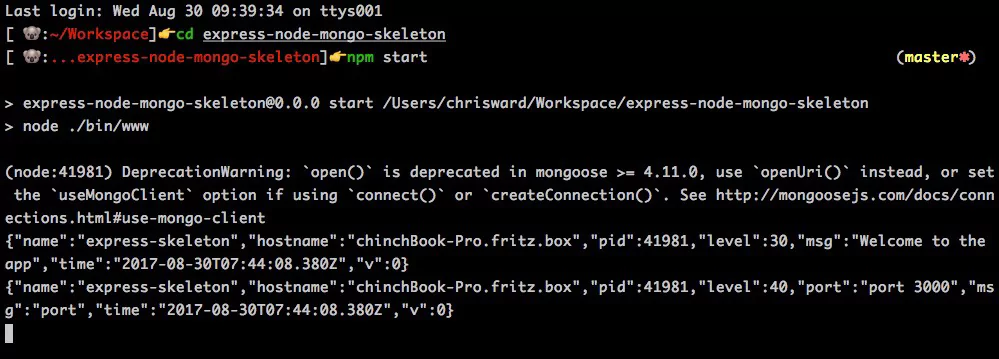
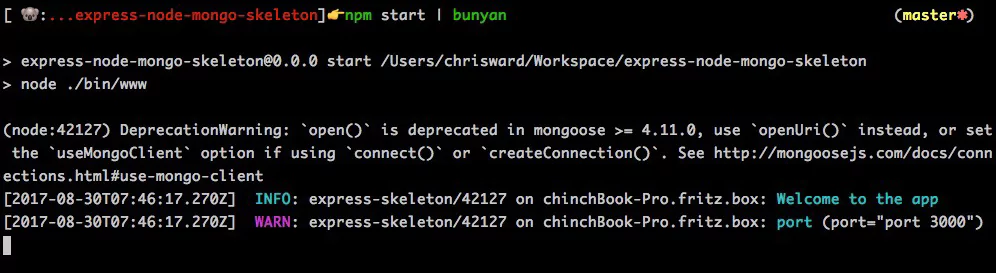
Bunyan’s output is in JSON format. A downside is this makes visual inspection a bit difficult, however, it does simplify the automated interpretation of the loglines.
Human vs. Machine Destined Logs
Here is a comparison of a human-destined log (free text, with minimum formatting) vs. a machine-destined log (JSON):
Human Destined Message
info: [2020-03-10 13:03:23hs] Hello there, this is an info message! error: [2020-03-12 02:20:32hs] There was an error on line 26 of file index.js please review!
Machine Destined Message
{"message":"Info message easy to parse","level":"info"}

{"message":"There was an error, please review the details","level":"error", "details": { "file": "index.js", "line": 12, "error_msg": "Parse error"}
If you’re looking for a flexible logger that works well with other systems (as opposed to people) then Bunyan might be a good option for you.
Winston & Morgan Make a Great Partnership
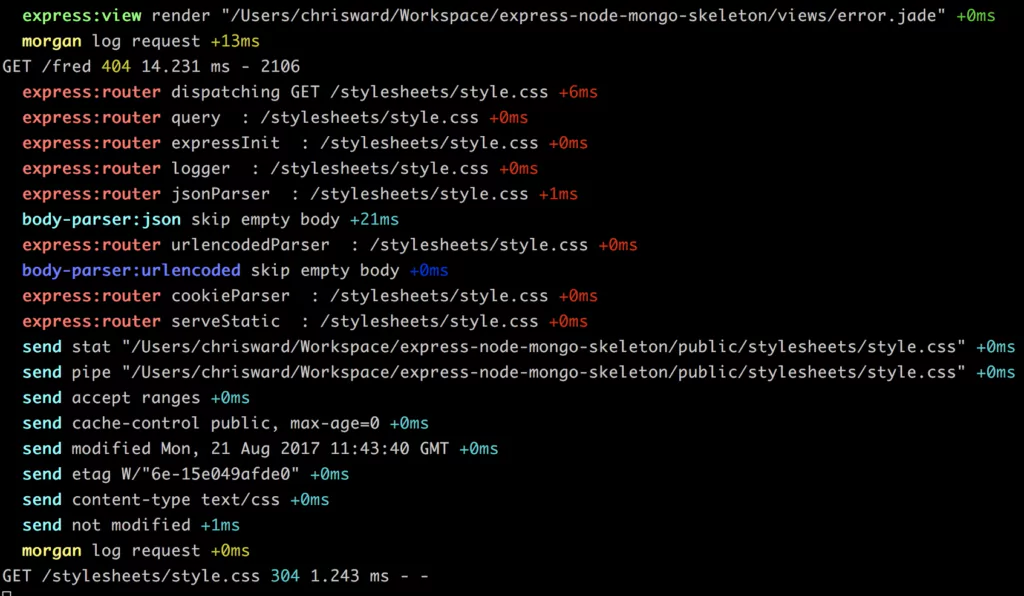
Morgan and Winston are highly compatible, and leveraging both modules provides the best of both worlds. Morgan provides the middleware for Express.js (and similar frameworks), capable of logging HTTP requests–with outputs directed to the standard terminal window. Whereas, the Winston logger allows you to overwrite, and customize, the output channel/s.
So, if you currently do something like this:
const morgan = require('morgan')

//...

app.use(morgan('tiny'))
Now, you can change it to something like:
//defining a custom logger
let logger = new (winston.Logger)({
    exitOnError: false,
    level: 'info',
    transports: [
        new (winston.transports.Console)(),
        new (winston.transports.File)({ filename: 'app.log'})
    ]
})

//using the logger and its configured transports, to save the logs created by Morgan
const myStream = {
    write: (text: string) => {
        logger.info(text)
    }
}

app.use(morgan('combined', { stream: myStream }));
Every single HTTP Request received, and any subsequent error response is logged. Then, with a custom logger defined (more on this in a second), and configured to save loglines to both the console and a file, you can output logs to several places simultaneously.
How to Use The Winston Logger
Winston is a highly intuitive tool that is easy to customize. Next, we will dive a little deeper into some commands to perform functions that you may find useful.
How to Define a Custom Logger
We will create a custom instance of Winston–which gives us the ability to customize its properties (e.g., the colors used, the logging levels, the storage device for logs, etc.).
In this example, to create a custom logger, we’ll use the createLogger method provided by Winston:
const config = require("config")

const { createLogger, format, transports } = require('winston');
const { combine, splat, timestamp, printf } = format;

const myFormat = printf( ({ level, message, timestamp , ...metadata}) => {
  let msg = `${timestamp} [${level}] : ${message} `
  if(metadata) {
	msg += JSON.stringify(metadata)
  }
  return msg
});

const logger = createLogger({
  level: 'debug',
  format: combine(
	format.colorize(),
	splat(),
	timestamp(),
	myFormat
  ),
  transports: [
	new transports.Console({ level: 'info' }),
	new transports.File({ filename: config.get("app.logging.outputfile"), level: 'debug' }),
  ]
});
module.exports = logger
More on the details down below, but first, let’s break down the code provided. The formatter function myFormat ensures that the logline has the required information and format. While the createLogger function defines parameters such as the maximum level to take into consideration and the list of storage devices to use for different log levels.
Levels, and Custom levels
The level defines the severity of a logged incident. There are many reasons why you might add logs to your code at any given point. These reasons are usually tied to a particular level. For example,the Debug level is usually applied when adding logging lines to understand a particular behavior. While adding a logging line to record when an error occurs is usually associated with the Error level.
The full list of default levels that come out-of-the-box with Winston are:
error: 0,
warn: 1,
info: 2,
http: 3,
verbose: 4,
debug: 5,
silly: 6
Notice the values; these signify the severity associated with the level; the lower the severity of the logged event, the higher the value. So, a debug message is considerably less important than a warning message.
With Winston, you can customize the levels if the default offerings don’t suit. That means that you can do the following:
const myLevels = {
	superImportant: 0,
	mediocre: 1,
	whoCares: 2
}

const logger = createLogger({
  levels: myLevels
});
Now, for the icing on this level-flavored cake, you can then reference the level you want directly by using its name as a method from the custom logger you just created:
logger.superImportant(“This message needs to be seen, something happened!”)
logger.whoCares(“Blah!”)
The same call can be done with the default levels; they are available as methods for you to use.
Formats and Custom Formats
When it comes to defining how your log messages look, the Winston logger provides flexibility. By default, the log message is not formatted and is printed as a JSON string with two parameters, message and level (where the message contains the actual text you’re logging and level a string with the name of the log level, such as ‘info’). However, overwriting that and adding parameters such as predefined tokens, timestamps, etc. is straightforward.
Winston uses logform to handle the log-formatting aspects. If you want to read the full list of predefined formats follow the link to their full documentation.
For example, let’s say you wanted to format your logs, so you get a timestamp and a custom label, and everything turned into a single string (instead of the default JSON). You can do something like:
const { createLogger, format, transports } = require('winston');
const { splat, combine, timestamp, label, printf, simple } = format;

const logger = createLogger({
  format: combine(
	label({ label: 'CUSTOM', message: true }),
	timestamp(),
    	simple()
  ),
  transports: [new transports.Console()]
});


logger.info("Hello there!")
logger.error("Testing errors too!")
info: [CUSTOM] Hello there! {"timestamp":"2020-03-13T05:37:32.071Z"}
error: [CUSTOM] Testing errors too! {"timestamp":"2020-03-13T05:37:32.074Z"}
As you can see, the level and the actual message are correctly formatted. However, we’re still getting an object-like structure at the end. That is because the timestamp format function adds that property to the log object (which by default only has message and level properties).
To solve that issue, you can create a custom formatter function, such as:
const myFormat = printf( ({ level, message, timestamp }) => {
  return `${timestamp} ${level}: ${message}`;
});
And then, instead of calling the simple formatter, we use myFormat, like so:
const logger = createLogger({
  format: combine(
	label({ label: 'CUSTOM', message: true }),
	timestamp(),
    	myFormat()
  ),
  transports: [new transports.Console()]
});
The output now becomes reader-friendly:
2020-03-13T07:02:26.607Z info: [CUSTOM] Hello there!
2020-03-13T07:02:26.609Z error: [CUSTOM] Testing errors too!
Filtering
You can even use the format configuration to filter out log messages you don’t wish to save. This works by adding a specific property to the logged object. For instance, the following logger will ignore any log that has an “ignore” property set to true:
const ignoreWhenTrue = format((info, opts) => {
  if (info.ignore) { return false; }
  return info;
});

const logger = createLogger({
  format: format.combine(
    ignoreWhenTrue(),
    format.json()
  ),
  transports: [new transports.Console()]
});
Now, you can temporarily add the attribute to silence one particular log message that’s not important, like so:
logger.log({
  private: true,
  level: 'error',
  message: 'This is top secret - hide it.'
});
Notice how this is accomplished with the log method, instead of using the custom methods added dynamically based on the level.
Transporters
Personally, transporters are my favorite feature from Winston because they allow you to switch between storage destinations for logs with ease. You can even have transporters directing logs to several storage devices simultaneously; either sending all logs or sending logs conditionally to various targets.
The internal architecture enables users of the module to create and publish their own independent transports. There are over 30 transports options, which include logging out into a single file, the console, or to 3rd party systems, such as AWS’s S3, Elasticsearch, MySQL, MongoDB, and many more.
You may have noticed that the code samples from before all contained at least one transport. To define them, you can add a transports array (which can contain as many transports as you’d like), when you configure the createLogger function.
Each transport sends data to storage devices that will have their own custom properties, depending on what they do with the data (you’ll need to read through their docs to get those details). But, there are two parameters that all transports implement:
- Level: This attribute sets the specific level for this transport to take into consideration. Any message that has a different level will be ignored. So although it’s optional, if you use it, ensure you don’t accidentally leave log levels without a transport assigned.
- Format: Just like the general format from above, you can also customize the format of specific transporters, giving you further control over the way you output data.
For example, this logger will only save logs to files, however, which file is conditional upon on the log level:
const logger = winston.createLogger({
  transports: [
    new winston.transports.File({
      filename: 'error.log',
      level: 'error',
      format: winston.format.json()
    }),
    new transports.Http({
      level: 'warn',
      format: winston.format.json()
    }),
    new transports.Console({
      level: 'info',
      format: winston.format.combine(
        winston.format.colorize(),
        winston.format.simple()
      )
    })
  ]
});
Streaming
One particular transport that you can use is the stream transport, which allows you to open up any Node.js stream and send logs into it.
This particular transport supports the following configuration properties:
- Stream: The Node.js stream to add logs to. If
objectModeis set totrue, then the entire log object will be logged (including the message, the level, and any other extra attributes added by the formatters). Otherwise, only the message attribute will be sent - Level: This defines which level/s the transport should log. If you don’t set it, then the logger object will use it’s own configuration to decide which to log and which to ignore
- Silent: If set to
true, it suppresses output. By default it’s set tofalse - EOL: The end-of-line character to use. By default, it applies
os.EOL
Profile Messages
Another interesting feature that Winston brings to the table is the ability to profile and debug your code. This module has the required methods to simplify that task for you.
If you’re looking to profile a piece of code, then you want to measure the time a piece of code takes to execute. Without a built in function, you would normally do something like:
let start = Date.now()

setTimeout(_ => {
    	let end = Date.now()
    	console.log("This took: ", (end - start) / 1000, " seconds to execute")
}, 1000)
With an output like the following:
This took: 1.003 seconds to execute
Of course, the example is over simplified, but you get the point. With Winston, however, we can do the following:
logger.profile("testing")
setTimeout(_ => {
    	logger.profile("testing")
}, 1000)
Assuming your logger was already created, you can use the profile method, which automatically starts and ends the timer for you and logs the message, as you can see below, with an INFO level message.
{"level":"info","durationMs":1007,"message":"testing"}
You can read here about other ways you can profile your code with Winston, but remember that, by customizing the format and other properties of the custom logger, you can affect the output from this method.
The Winston Logger as an Overall Logging Solution
If you are choosing an overall logging solution for your application, be it centralized or distributed, Winston is your bread and butter. Everything should go through your custom loggers and you can tweak the logic behind it by changing just a few lines of code.
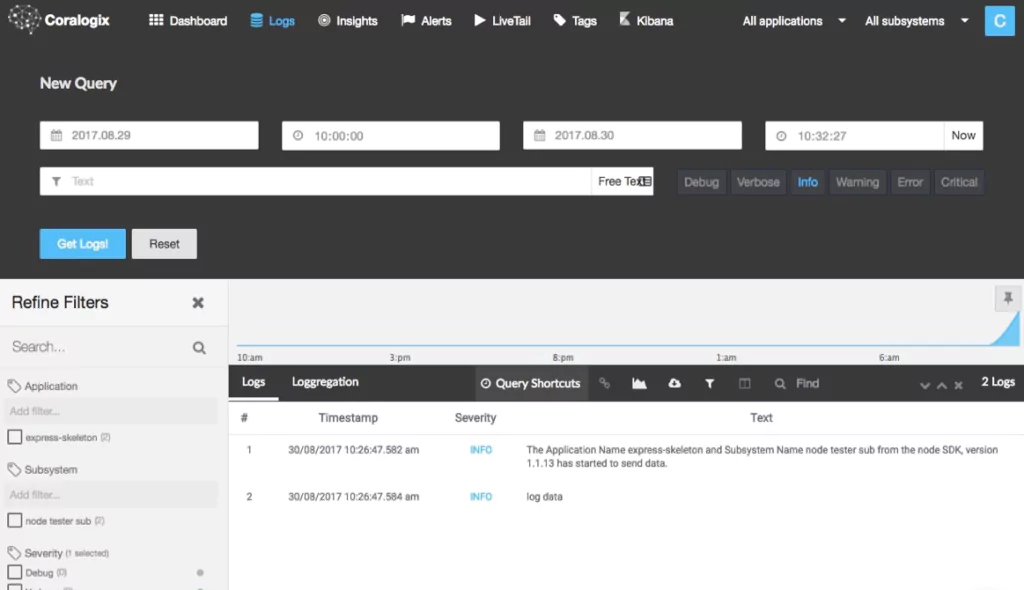
Taking it a step further, you might find the need to add more enterprise-level capabilities like ML-powered alerts and hosted, scaled secured ELK stack. Coralogix can help get you there faster. Our integration for Winston makes it a painless process.