Turn Raw Data into Reliability by Changing Performance Perspectives

In a global microservices architecture, technical performance initially presents as a chaotic stream of disconnected telemetry. For a Technical Program Manager (TPM), success depends on the ability to move past these disconnected individual data points to identify stable patterns. If they have services entering critical states, looking at individual logs or traces is inefficient. Protecting system reliability requires an engine that automates pattern recognition at scale.
Red Zone Mechanics
In modern observability, exceeding critical performance thresholds represents a critical operational breach. Governing this state is the Error Budget, a mathematical standard that balances deployment velocity with system stability.
Services entering the Red Zone signal to the team that they have exhausted their reliability tokens, which triggers a rapid operational shift:
- Engineering autonomy is suspended.
- Product roadmaps are frozen.
- Resources are diverted to a singular search for the root cause.
To resume innovation, teams must earn their budget back by maintaining stability through the Sliding Window of their Lookback Period until the service returns to a healthy state.
Granular Investigation Issues
During a crisis, a TPM’s instinct is to “zoom in” on raw logs, specific session_ids, or exact failure timestamps. However, at a scale of millions of spans per second, this focus on high-cardinality identifiers like user_id or transaction_id becomes a liability.
Every log contains unique metadata, such as timestamps, User IDs, and Trace IDs, so searching manually makes every event appear distinct. Attempting to resolve a systemic issue by investigating individual events is statistically impossible at scale. Effective Error Budget management requires a shift from manual interrogation to automated structural analysis.
II. Efficiency Gaps in Traditional Observability
In a traditional observability model, every log is treated as a unique data point. While manageable during normal operations, this approach fails during service disruptions in distributed environments. When a system breaks, the volume of telemetry scales exponentially, becoming bloated with diagnostic data and trace spans as they attempt to log the state of every failing request. Maintaining focus on individual records (the raw data) prevents a holistic view of the underlying failure.
MTTR Bottlenecks
Service reliability is quantified by Mean Time to Recovery (MTTR). If recovery depends on engineers manually executing Lucene queries to filter through logs, the Error Budget will be compromised. Each manual query attempt and the associated latency of loading raw text drains the reliability reserve. At a scale of billions of spans, manual searching is no longer a viable diagnostic strategy; it is a resource drain that delays recovery.
Cognitive Overload and High Cardinality
As humans, we have special skills in pattern recognition, but we have finite limits. A human operator simply cannot identify variances between healthy and failing states across millions of lines of JSON. Therefore, treating every log as a unique event creates a diagnostic environment overloaded with noise. High-cardinality data—such as unique User IDs, dynamic timestamps, and varying IP addresses—often mask the root cause of errors, leading to analytical paralysis.
Shifting the Physics of Investigation
To maintain governance at scale, investigation methods must evolve. An improvement would be if Logs could be viewed as a Gallery of Templates rather than a stream of individual events. Effective high-level governance requires a shift from individual record interrogation to structural oversight. This necessitates a system capable of filtering out high-cardinality noise to surface the underlying structure of the data. The goal is not to search millions of records faster, but to reduce those millions into a manageable set of actionable templates.
III. System Architecture: Loggregation
The good news is that such an improvement exists. Coralogix uses Loggregation to move from individual log chaos to clear operational views. The capability acts as a real-time processing engine that deconstructs high-volume telemetry streams. It isolates recurring system errors from unique, non-actionable background noise by automatically identifying and clustering identical log structures.
Constants vs. Variables
Loggregation performs the automated deconstruction of every record without relying on pre-defined rules. Using unsupervised machine learning, the Streama engine deconstructs telemetry in-stream to surface emerging patterns.
The engine categorizes log data into two primary components:
- Variables: High-cardinality values that shift with each request, such as unique user_id, dynamic IPs, or specific trace_id. These unique identifiers are what make manual searching mathematically exhausting.
- Constants: Fixed components of the log message, such as error strings or code execution paths, that remain identical across thousands of events (e.g., GetCartAsync called with userId = <variable>).
Unclassified Logs as Governance Signals
In a structured observability model, random or chaotic data obscures the system image. Coralogix identifies these as Unclassified Logs. These serve as a governance signal. Logs marked as “Unclassified” due to extreme cardinality act as prompts to apply Parsing Rules. This ensures that the data remaining in the system is structured, clear, and actionable.
Pattern Frequency and Impact
Loggregation surfaces high-impact patterns by identifying the most frequent templates. The platform provides a visual representation for each template, showing the arrival frequency of a specific pattern relative to the rest of the stream. This allows TPMs to prioritize fixes based on the actual volume of the error pattern rather than the sheer number of raw logs.
IV. The Technical Workflow: Save the SLOs
Now that we understand the engine, we can execute an SLO recovery that not only fixes defects but also stops Error Budget leaks. Here is a sample structured, high-velocity workflow.
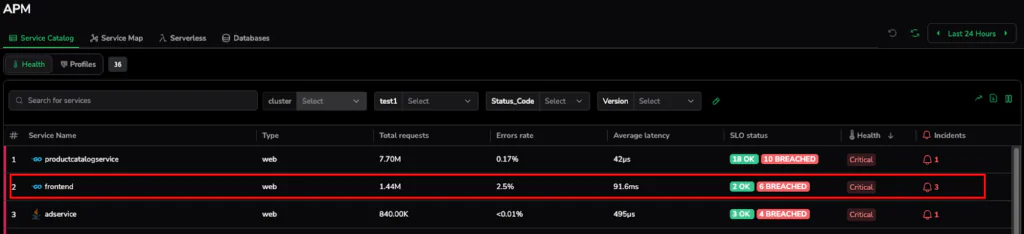
- Macro View (Service Catalog): We begin in the Service Catalog, where we can already see that, in our scenario, the monitoring layer indicates 6 breaches in the frontend service over the previous 24-hour window.
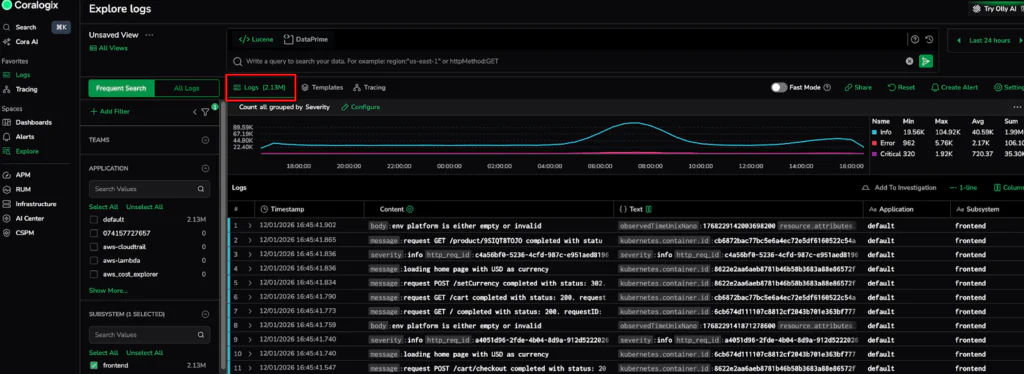
- Subsystem Isolation: Next, we navigate to the Logs interface and add a filter for the specific Subsystem (e.g., frontend). This isolates the relevant telemetry from the global stream. In this scenario, the filtered dataset for the past 24 hours exceeds 2.13 million logs, which serves as our baseline for further reduction.
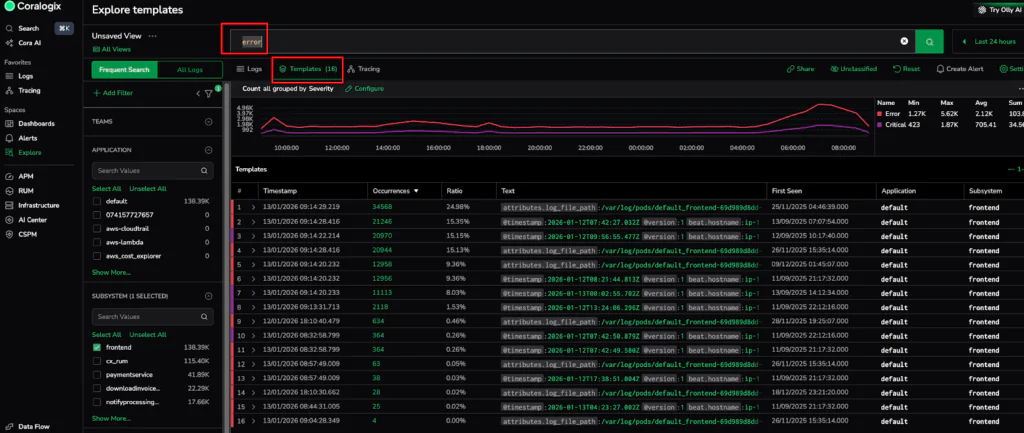
- Structural Reduction (Template Activation): Once we activate the templates on the filter screen, the Streama engine uncovers patterns and shapes. This reduces the volume to a mere 31 templates, which we further reduce to just 16 by simply entering an error filter.
- Template drill down: Let’s select the highest-frequency template to perform a deep dive analysis. Hovering over a template makes a magnifying glass appear. Clicking that takes you to the Logs view, in which an automated Lucene query retrieves the raw logs matching the structural DNA discovered by the engine. This allows a TPM to pinpoint the exact location of failures without mining data manually.
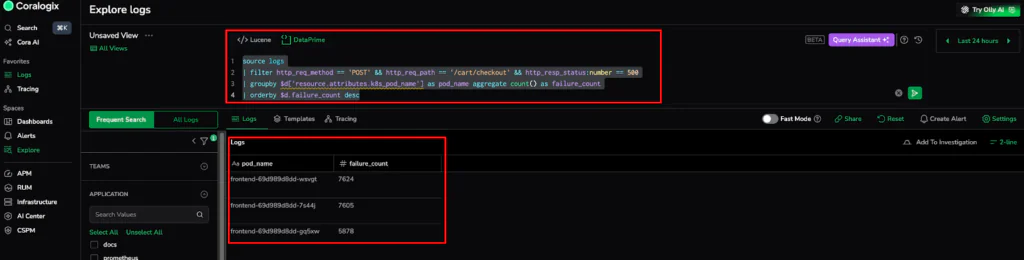
- Variance Analysis (The DataPrime Interrogation): With the “What” confirmed (POST 500s on checkout), we use DataPrime to find the “Where.” We’ll run a grouping query to see if the failure is localized to a single pod: source logs | groupby $d[‘resource.attributes.k8s_pod_name’] as pod_name aggregate count() as failure_count
- The results reveal that instead of one pod failing, errors are distributed almost equally across all frontend pods (e.g., wsvgt at 7,624 and 7s44j at 7,605). This Variance Analysis tells us that the issue isn’t a “noisy” piece of hardware. It’s a systemic failure—likely caused by a broken upstream dependency or a buggy code deployment affecting the entire frontend deployment.
- Resolution and Budget Restoration: Because we caught this early via Loggregation, we don’t have to guess. We will go straight to the Upstream Traces or Rollback the latest deployment. Our Error Budget will now stabilize because we stopped the 500-error surge at the source. This will start clearing the sliding window, steadily returning our SLO to the Green Zone.
The Framework for Operational Excellence
Modern observability is about scalable governance, not faster manual searching. Unsupervised machine learning bypasses the “individualism” of raw logs, reduces MTTR, and prevents operator burnout in TPMs.
Loggregation is a tremendous catalyst for data hygiene as it strips away high-cardinality noise while surfacing the constants that dictate system stability. Shifting to template-based oversight allows teams to protect their SLOs and resolve systemic failures efficiently, ensuring the organization remains focused on innovation rather than recovery.